

Conjoint Analysis of Crime Rankings | Andrew Wheeler
source link: https://andrewpwheeler.com/2020/05/22/conjoint-analysis-of-crime-rankings/
Go to the source link to view the article. You can view the picture content, updated content and better typesetting reading experience. If the link is broken, please click the button below to view the snapshot at that time.
Conjoint Analysis of Crime Rankings
So part of my recent research mapping crime harm spots uses cost of crime estimates relevant to police departments (Wheeler & Reuter, 2020). But a limitation of this is that cost of crime estimates are always somewhat arbitrary.
For a simple example, those cost estimates are based mostly on people time by the PD to respond to crimes and devote investigative resources. Many big city PDs entirely triage crimes like breaking into vehicles though. So based on PD response the cost of those crimes are basically $0 (especially if PDs have an online reporting system).
But I don’t think the public would agree with that sentiment! So in an act of cognitive dissonance with my prior post, I think asking the public is likely necessary for police to be able to ultimately serve the publics interest when doing valuations. For some ethical trade-offs (like targeting hot spots vs increasing disproportionate minority contact, Wheeler, 2019) I am not sure there is any other reasonable approach than simply getting a bunch of peoples opinions.
But that being said, I suspected that these different metrics would provide pretty similar rankings for crime severity overall. So while it is criminology 101 that official crime and normative perceptions of deviance are not a perfect 1 to 1 mapping, most folks (across time and space) have largely similar agreement on the severity of different crimes, e.g. that assault is worse than theft.
So what I did was grab some survey ranking of crime data from the original source of crime ranking that I know of, Marvin Wolfgang’s supplement to the national crime victimization survey (Wolfgang et al., 2006). I have placed all the code in this github folder to replicate. And in particular check out this Jupyter notebook with the main analysis.
Conjoint Analysis of Crime Ranks
This analysis is often referred to as conjoint analysis. There are a bunch of different ways to conduct conjoint analysis – some ask folks to create a ranked list of items, others ask folks to choose between a list of a few items, and others ask folks to rank problems on a Likert item 1-5 scale. I would maybe guess Likert items are the most common in our field, see for example Spelman (2004) using surveys of asking people about disorder problems (and that data is available to, Taylor, 2008).
The Wolfgang survey I use here is crazy complicated, see the codebook, but in a nutshell they had an anchoring question where they assigned stealing a bike to a value of 10, and then asked folks to give a numeric score relative to that theft for a series of 24 other crime questions. Here I only analyze one version of the questionnaire, and after eliminating missing data there are still over 4,000 responses (in 1977!).
So you could do analyze those metric scores directly, but I am doing the lazy route and just doing a rank ordering (where ties are the average rank) within person. Then conjoint analysis is simply a regression predicting the rank. See the notebook for a more detailed walkthrough, so this just produces the same analysis as looking at the means of the ranks.
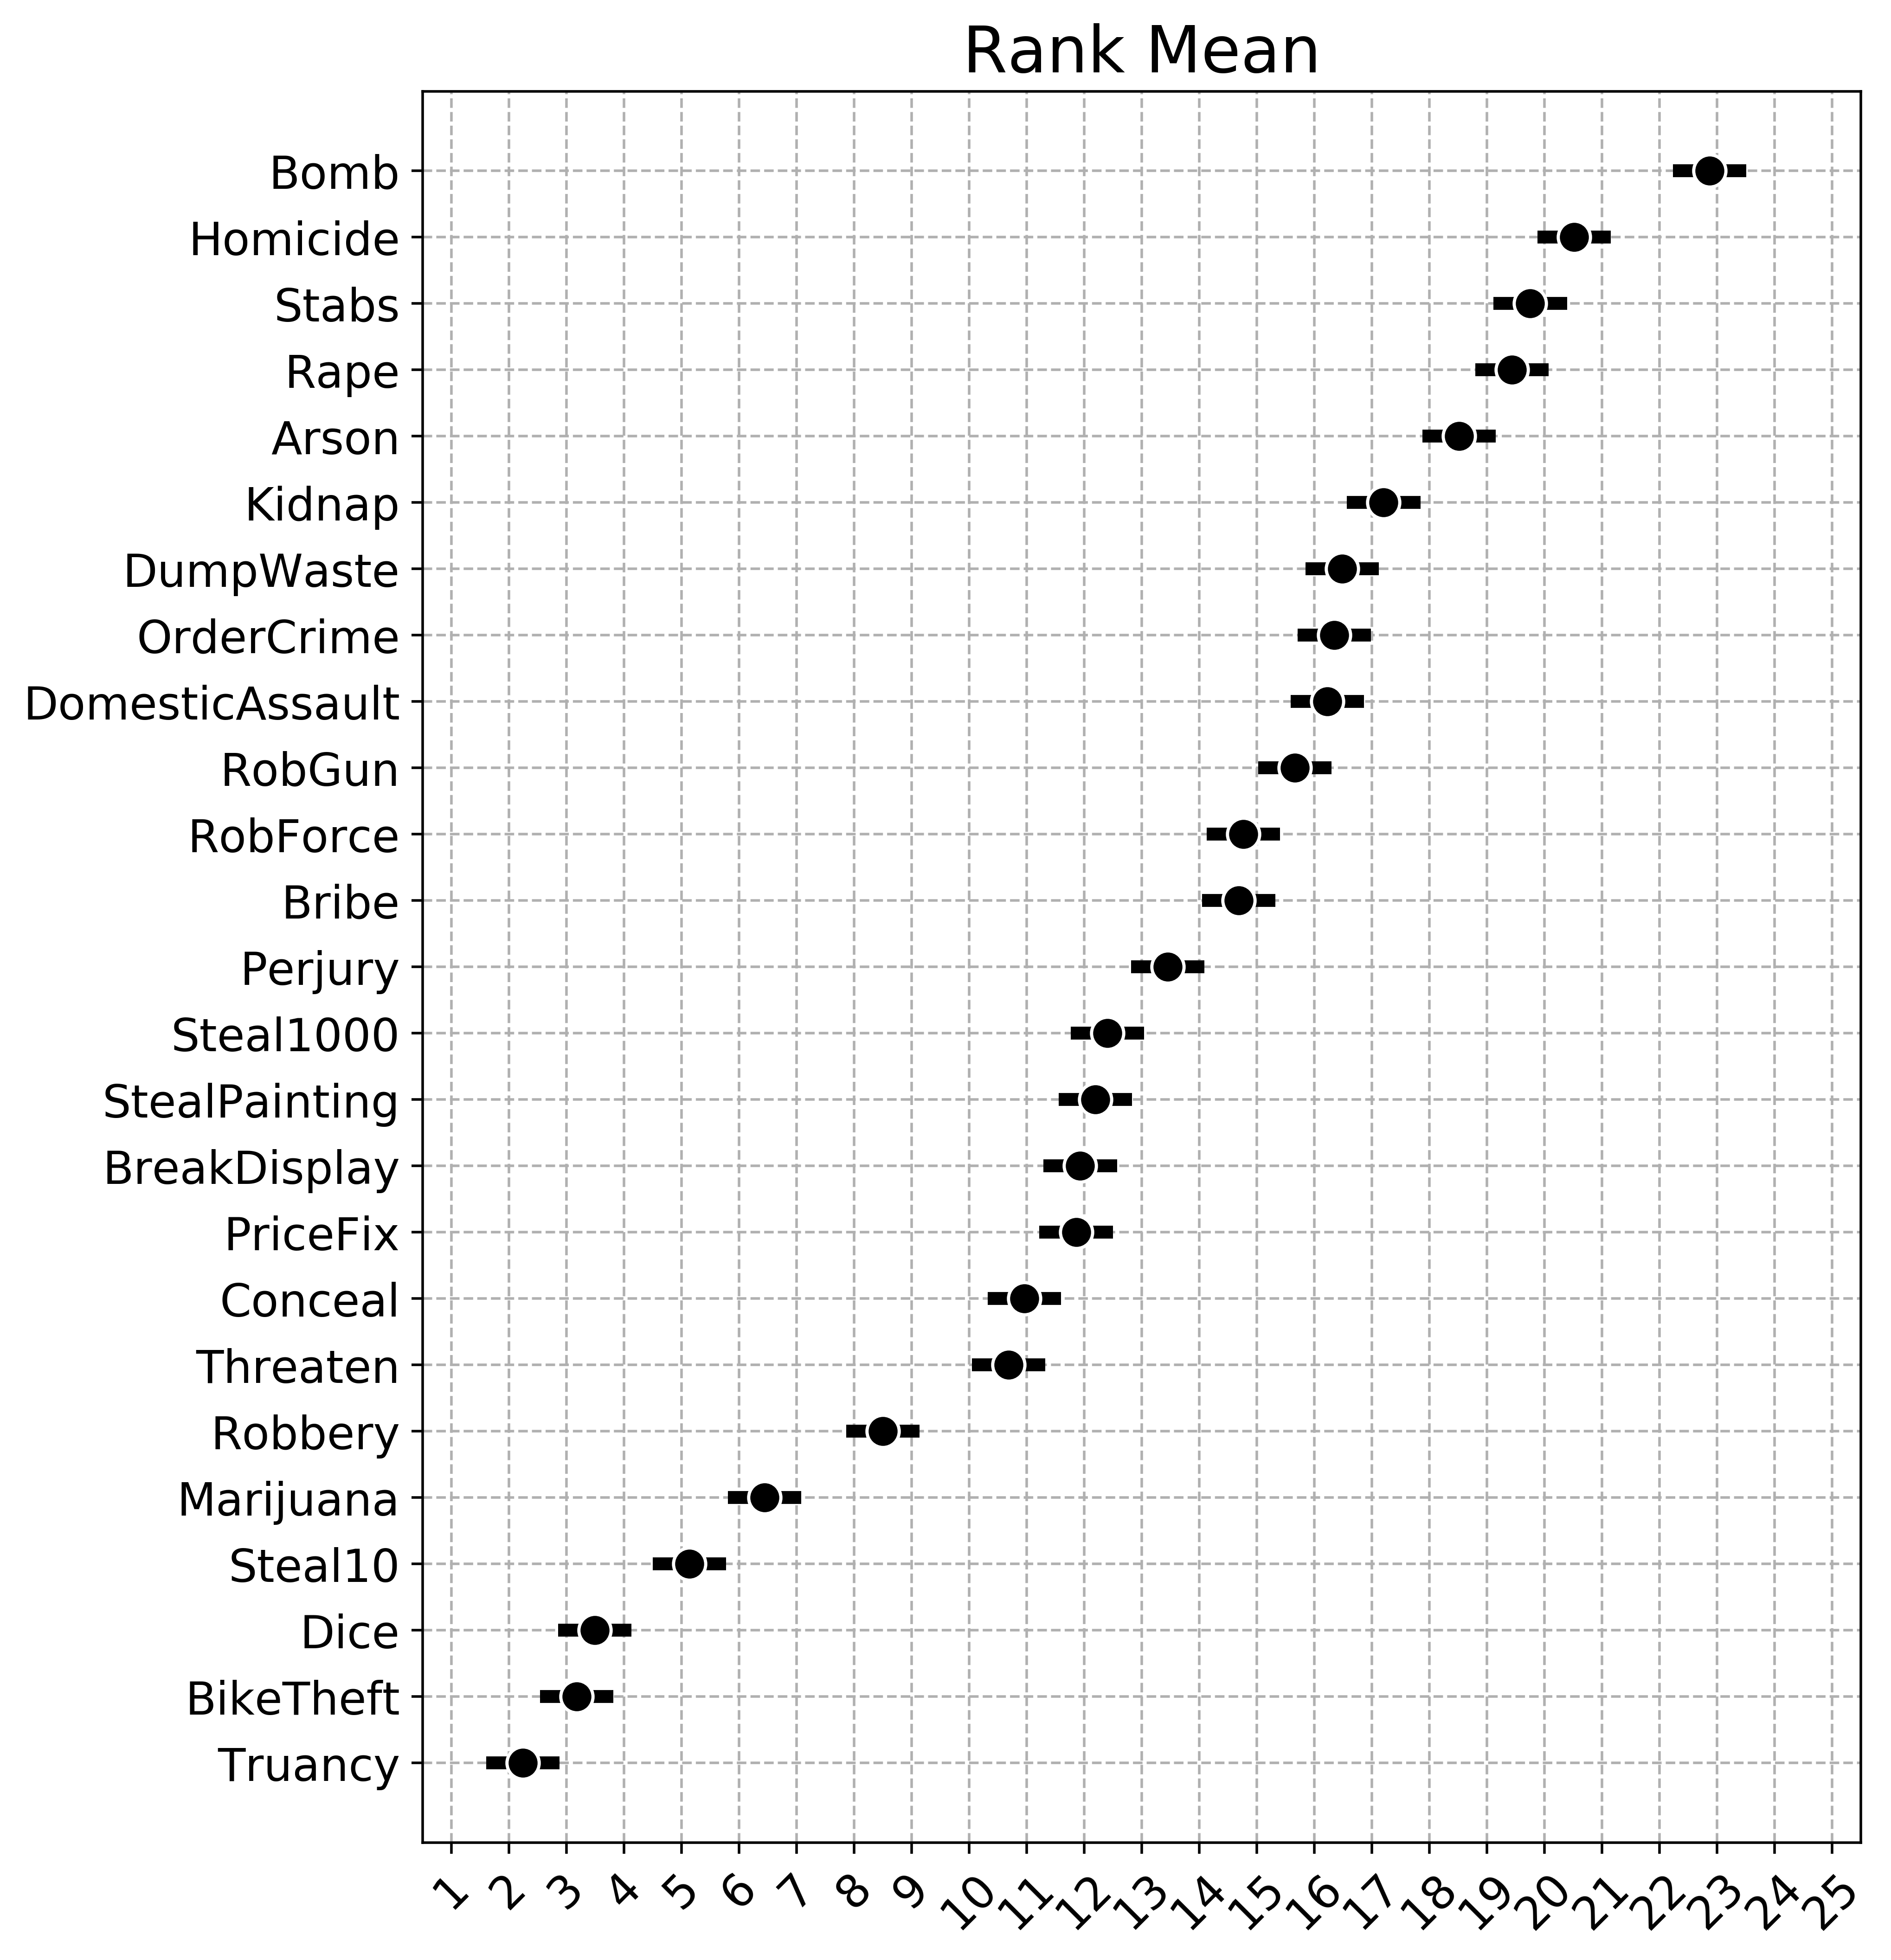
About the only thing I do different here than typical conjoint analysis is that I rescale the frequency weights (just changes the degrees of freedom for standard error estimates) to account for the repeated nature of the observations (e.g. I treat it like a sample of 4000 some observations, not 4000*25 observations). (I don’t worry about the survey weights here.)
To test my assertion of whether these different ranking systems will be largely in agreement, I take Jerry’s crime harm paper (Ratcliffe, 2015), which is based on sentencing guidelines, and map them as best I could to the Wolfgang questions (you could argue with me some though on those assements – and some questions don’t have any analog, like a company dumping waste). I rescaled the Wolfgang rankings to be in a range of 1-14, same as Jerry’s, instead of 1-25.
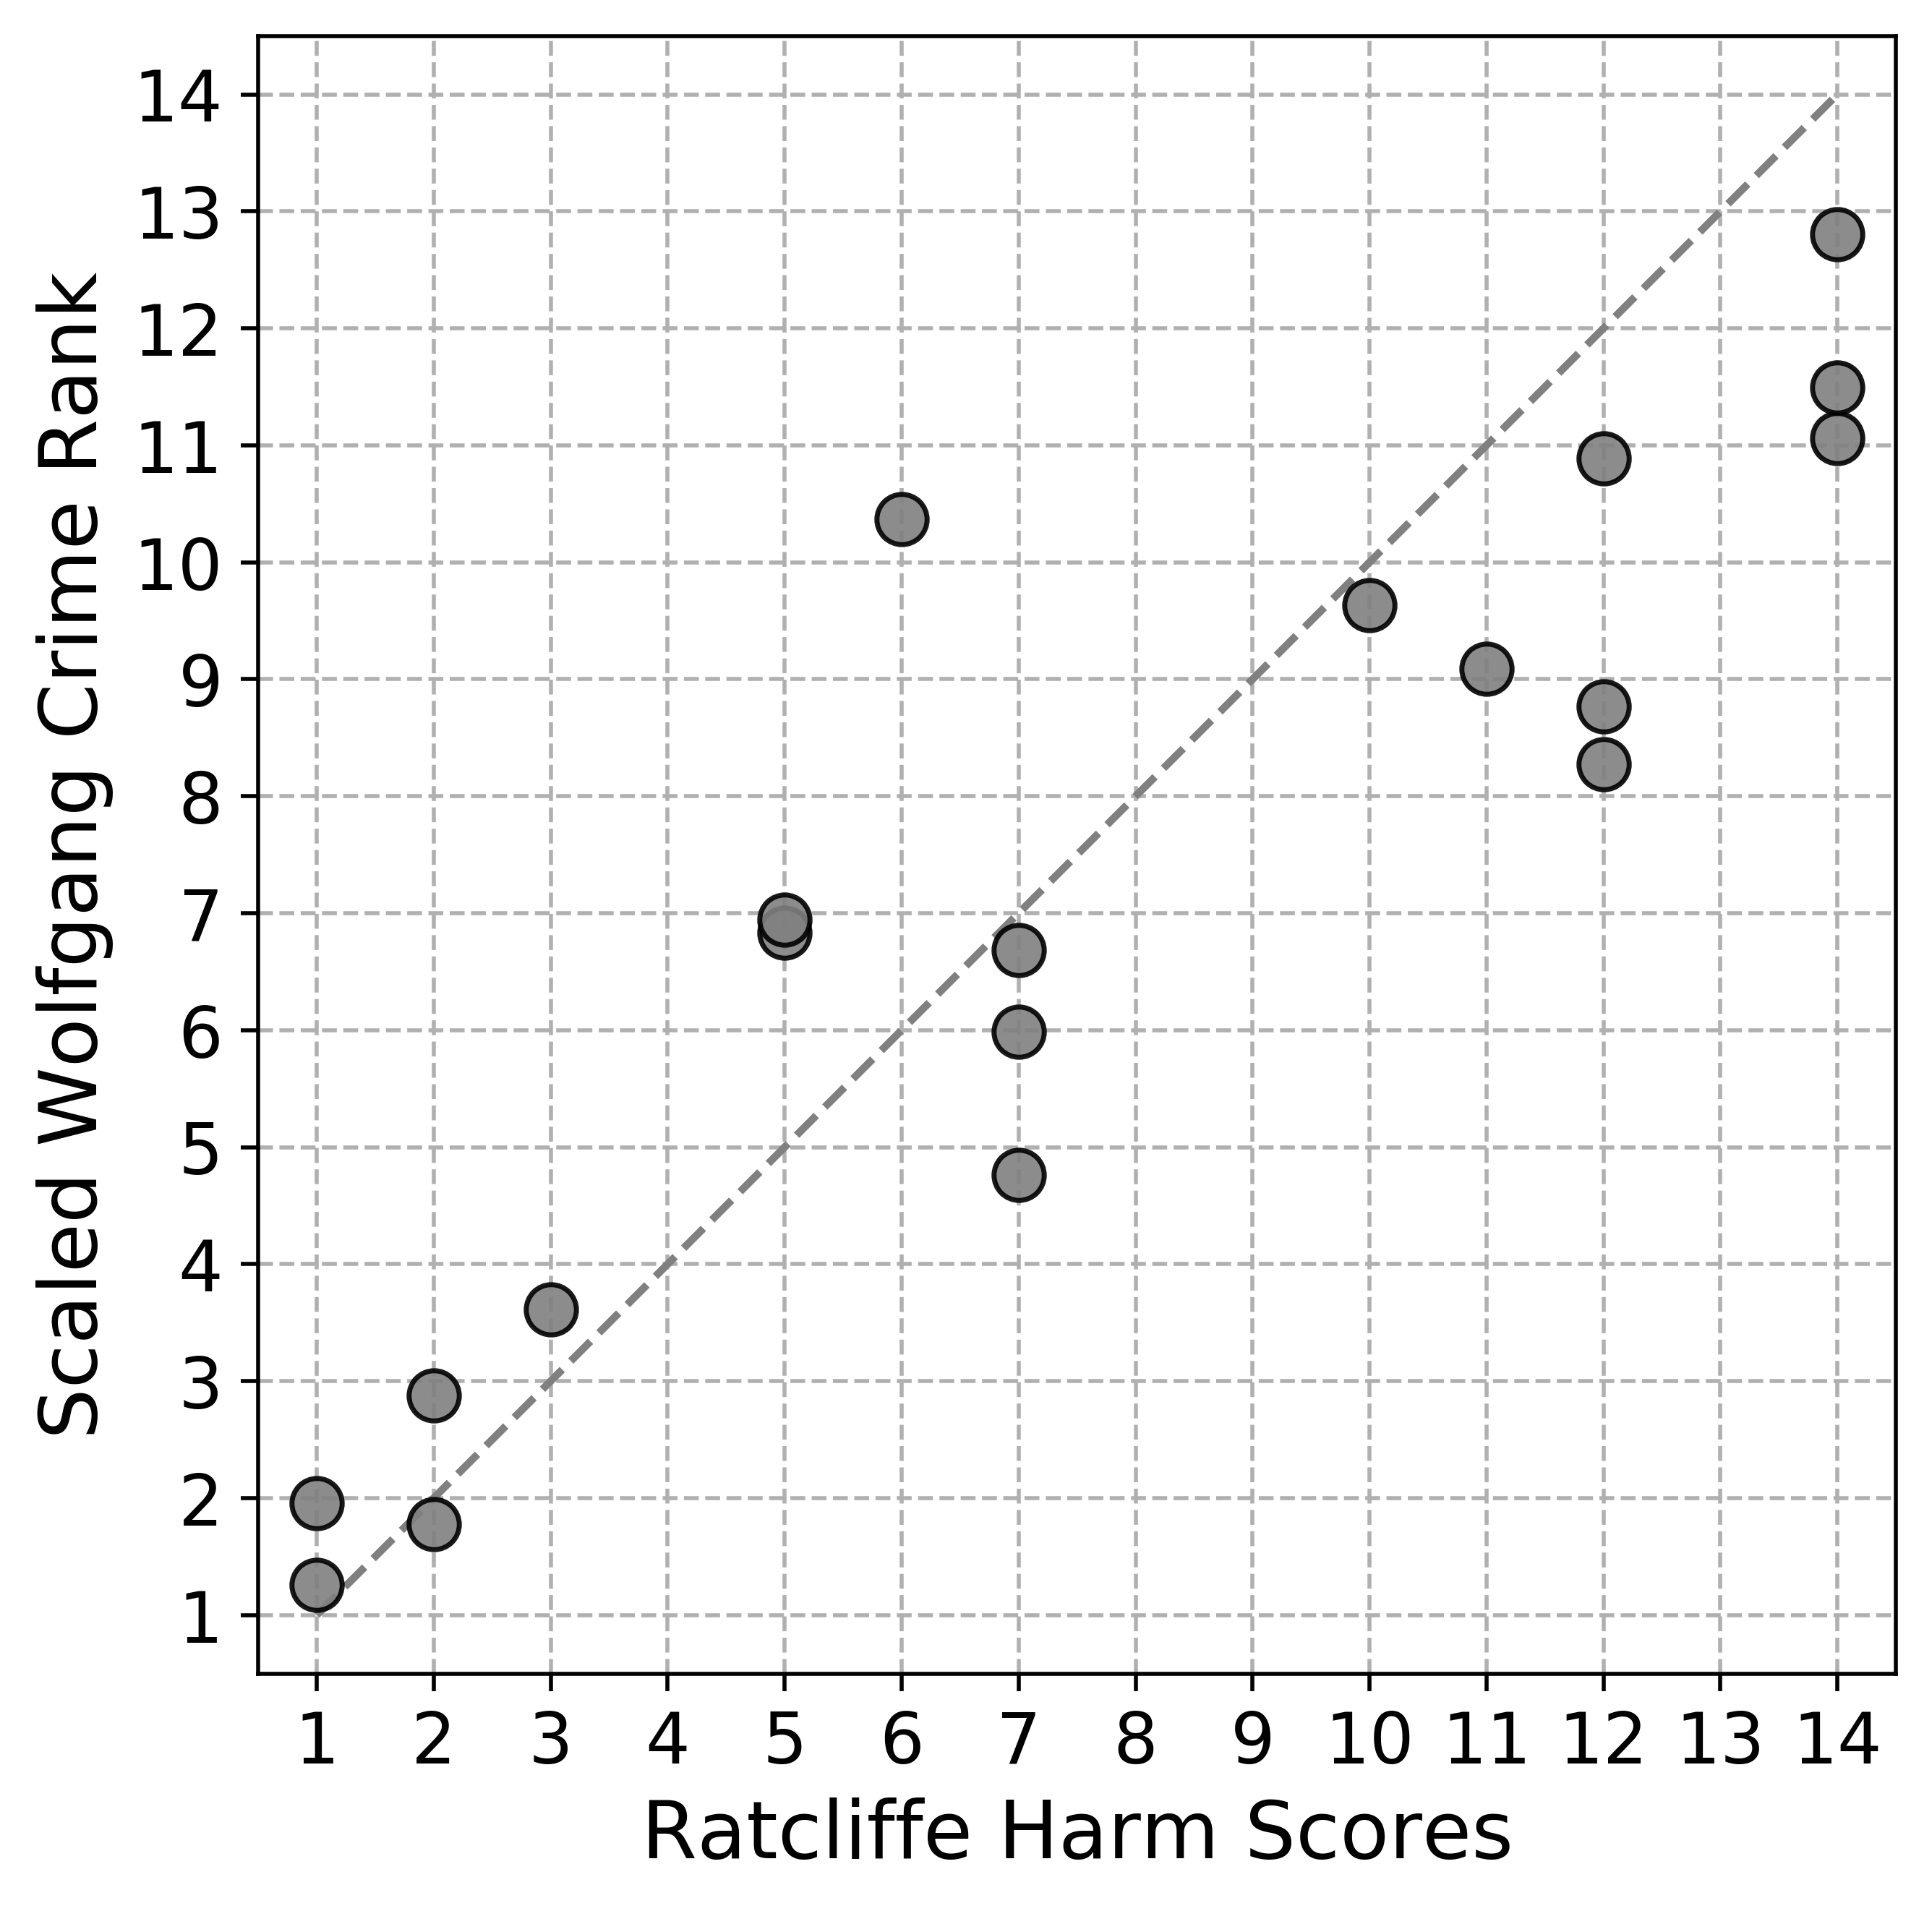
Doing a more deep dive into the Wolfgang questions, there are definately different levels in the nature of the questions you can tease out. Folks clearly take into account both harm to the victim and total damages/theft amounts. But overall the two systems are fairly correlated. So if an analyst wants to make crime harm spots now, I think it is reasonable to use one of these ranking systems, and then worry about getting the public perspective later on down the line.
The Wolfgang survey is really incredible. In this regression framework you can either adjust for other characteristics (e.g. it asks about all the usual demographics) or look at interactions (do folks who were recently victimized up their scores). So this is really just scratching the surface. I imagine if someone redid it with current data many of the metrics would be similar as well, although if I needed to do this I don’t think I would devise something as complicated as this, and would ask people to rank a smaller set of items directly.
References
- Ratcliffe, J.H. (2015). Towards an index for harm-focused policing. Policing: A Journal of Policy and Practice, 9(2), 164-182.
- Spelman, W. (2004). Optimal targeting of incivility-reduction strategies. Journal of Quantitative Criminology, 20(1), 63-88.
- Taylor, R.B. (2008). Impacts of Specific Incivilities on Responses to Crime and Local Commitment, 1979-1994: [Atlanta, Baltimore, Chicago, Minneapolis-St. Paul, and Seattle]. https://doi.org/10.3886/ICPSR02520.v1
- Wheeler, A.P., & Reuter, S. (2020). Redrawing hot spots of crime in Dallas, Texas. https://doi.org/10.31235/osf.io/nmq8r
- Wheeler, A.P. (2019). Allocating police resources while limiting racial inequality. Justice Quarterly, Online First.
- Wolfgang, M.E., Figlio, R.M., Tracy, P.E., and Singer, S.I. (2006). National Crime Surveys: Index of Crime Severity, 1977. https://doi.org/10.3886/ICPSR08295.v1
Recommend
About Joyk
Aggregate valuable and interesting links.
Joyk means Joy of geeK