

weighted displacement difference
source link: https://andrewpwheeler.com/2018/09/25/new-paper-a-simple-weighted-displacement-difference-test-to-evaluate-place-based-crime-interventions/
Go to the source link to view the article. You can view the picture content, updated content and better typesetting reading experience. If the link is broken, please click the button below to view the snapshot at that time.
New paper: A simple weighted displacement difference test to evaluate place based crime interventions
At the ECCA conference this past spring Jerry Ratcliffe asked if I could apply some of my prior work on evaluating changes in crime patterns over time to make a set of confidence intervals for the weighted displacement quotient statistic (WDQ). The answer to that is no, you can’t, but in its stead I created another statistic in which you can do that, the weighted displacement difference (WDD). The work is published in the open access journal Crime Science.
The main idea is we wanted a simple statistic folks can use to evaluate place based interventions to reduce crime. All you need is pre and post crime counts for you treated and control areas of interest. Here is an excel spreadsheet to calculate the statistic, and below is a screen shot. You just need to fill in the pre and post counts for the treated and control locations and the spreadsheet will spit out the statistic, along with a p-value and a 95% confidence interval of the number of crimes reduced.
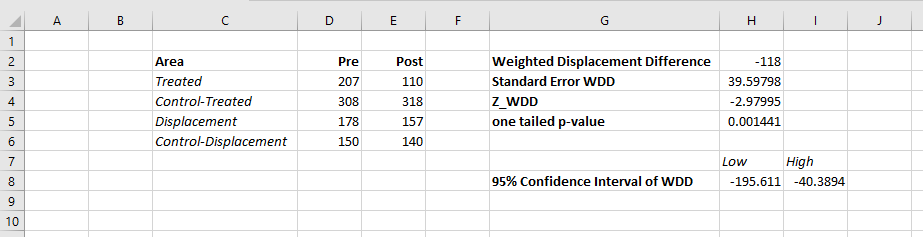
What is different compared to the WDQ statistic is that you need a control area for the displacement area too in this statistic. But if you are not worry about displacement, you can actually just put in zero’s for the displacement area and still do the statistic for the local (and its control area). In this way you can actually do two estimates, one for the local effects and one for the displacement. Just put in zero’s for the other values.
While you don’t really need to read the paper to be able to use the statistic, we do have some discussion on choosing control areas. In general the control areas should have similar counts of crime, you shouldn’t have a treatment area that has 100 crimes and a control area that only has 10 crimes. We also have this graph, which is basically a way to conduct a simple power analysis — the idea that “could you reasonably detect whether the intervention reduced crime” before you actually conduct the analysis.
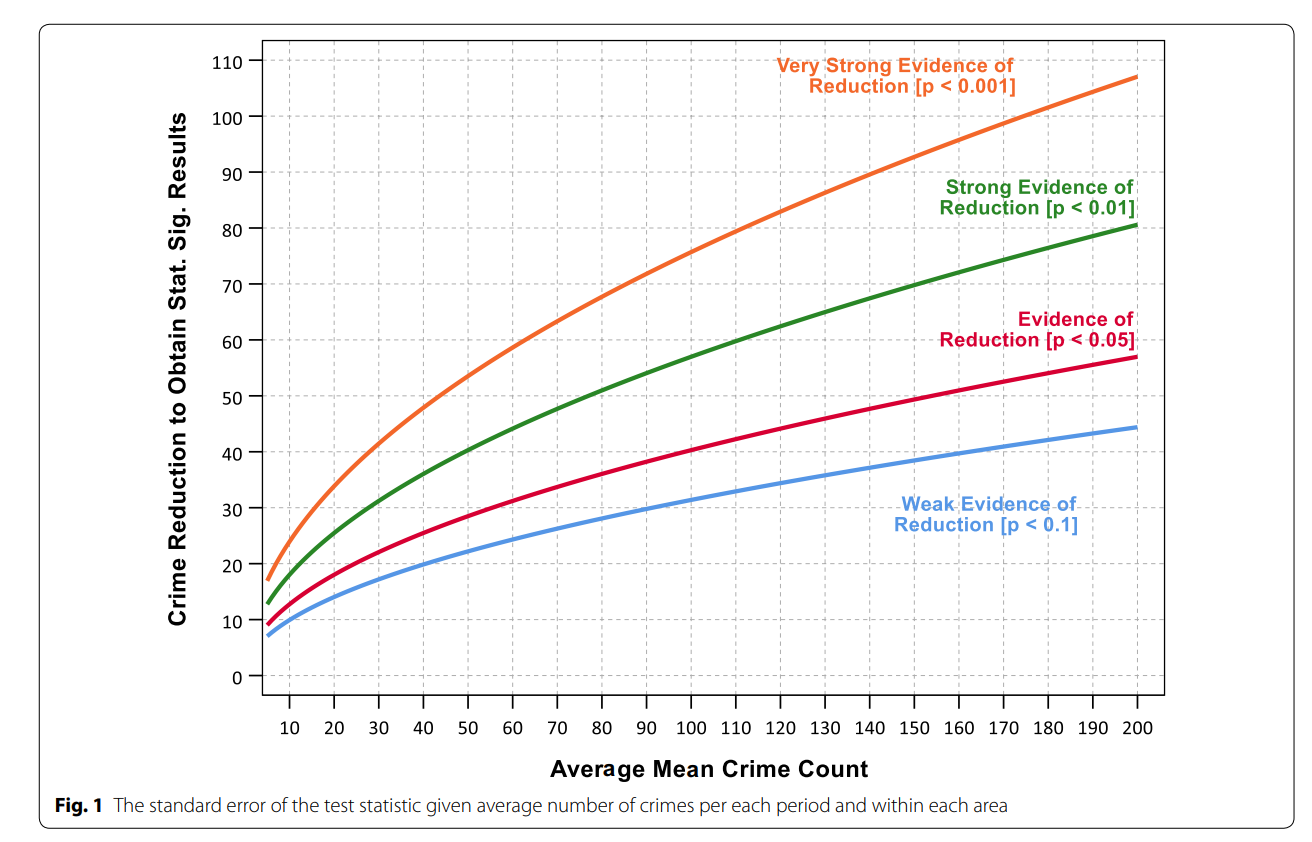
So the way to read this graph is if you have a set of treated and control areas that have an average of 100 crimes in each period (so the cumulative total crimes is around 800), the number of crimes you need to reduce due to the intervention to even have weak evidence of a crime reduction (a one-tailed p-value of less than 0.1), the intervention needs to have prevented around 30 crimes. Many interventions just aren’t set up to have strong evidence of crime reductions. For example if you have a baseline of 20 crimes, you need to prevent 15 of them to find weak evidence of effectiveness. Interventions in areas with fewer baseline crimes basically cannot be verified they are effective using this simple of a design.
For those more mathy, I created a test statistic based on the differences in the changes of the counts over time by making an assumption that the counts are Poisson distributed. This is then basically just a combination of two difference-in-difference estimates (for the local and the displacement areas) using counts instead of means. For researchers with the technical capabilities, it probably makes more sense to use a data based approach to identify control areas (such as the synthetic control method or propensity score matching). This is of course assuming an actual randomized experiment is not feasible. But this is too much a burden for many crime analysts, so if you can construct a reasonable control area by hand you can use this statistic.
Recommend
About Joyk
Aggregate valuable and interesting links.
Joyk means Joy of geeK