

Does Hot Spots Policing Have Meaningful Impacts on Crime? Findings from An Alter...
source link: https://link.springer.com/article/10.1007/s10940-020-09481-7
Go to the source link to view the article. You can view the picture content, updated content and better typesetting reading experience. If the link is broken, please click the button below to view the snapshot at that time.

Advertisement
- Original Paper
- Published: 04 November 2020
Does Hot Spots Policing Have Meaningful Impacts on Crime? Findings from An Alternative Approach to Estimating Effect Sizes from Place-Based Program Evaluations
Journal of Quantitative Criminology
(2020)Cite this article
-
262 Accesses
-
3 Altmetric
Abstract
Objectives
Prior meta analyses of hot spots policing show that the approach reduces crime, but report relatively small mean effect sizes based on Cohen’s d. The natural logarithm of the relative incidence rate ratio (log RIRR) has been suggested as a more suitable effect size metric for place-based studies that report crime outcomes as count data. We calculate the log RIRR for hot spots policing studies to assess whether it changes interpretation of hot spots policing’s impact on crime.
Methods
Cohen’s d and log RIRR effect size metrics were calculated for 53 studies representing 60 tests of hot spots policing programs. Meta-analytic techniques were used to compare the estimated impacts of hot spots policing on crime and investigate the influence of moderating variables using the two differing effect size metrics.
Results
The Cohen’s d meta-analysis revealed a “small” statistically significant mean effect size favoring hot spots policing in reducing crime outcomes at treatment places relative to control places (d = .12) of approximately 8.1%. In contrast, the log RIRR meta-analysis suggests that hot spots policing generated a more substantive 16% (d = .24) statistically significant crime reduction. The two metrics also produced differing rank orders in magnitudes of effect for the same studies.
Conclusion
Cohen’s d provides misleading results when used to calculate mean effect size in place based studies both in terms of the relative ranking of the magnitude of study outcomes, and in the interpretation of average impacts of interventions. Our analyses suggest a much more meaningful impact of hot spots policing on crime than previous reviews.
Introduction
Hot spots policing is an important innovation in policing that is used to control crime by many police departments in the United States, United Kingdom, Australia, and other countries throughout the world (e.g., see Ariel et al. 2020; Weisburd and Braga 2019; Weisburd and Majmundar 2018). Simply defined, hot spots policing is the application of police interventions at very small geographic units of analysis. The emergence of hot spots policing can be traced to innovations in criminological theory that recognized the uneven distribution of crime across urban landscapes (Sherman et al. 1989a) and its persistent concentration at very small places such as street segments within larger neighborhood settings (Weisburd et al. 2004). Before the approach was widely diffused across police departments, focusing police crime prevention efforts at small high-activity crime places was subjected to rigorous program evaluations that yielded notable crime control benefits at targeted places without simply displacing crime to nearby areas (e.g., see Sherman and Weisburd 1995; Weisburd and Green 1995; Braga et al. 1999). Its adoption was further aided by the general familiarity that most police executives already had with the idea of deploying police officers to high-crime locations as well as the proliferation of new crime mapping software that easily identified crime hot spots and management accountability systems, such as Compstat, that promoted putting “cops on dots” (Braga and Weisburd 2010; Weisburd et al. 2003; Weisburd and Lum 2005).
The ubiquity of hot spots policing in modern police departments is also due to its stature as an evidence-based crime prevention strategy. Rigorous empirical evidence supports focusing police resources on problem places. An influential Campbell Collaboration systematic review of randomized controlled trials and quasi-experiments concluded that hot spots policing programs are effective in reducing crime at treated places relative to control places that experienced routine police responses (Braga 2001; Braga et al. 2014, 2019). The systematic review also found that, when spatial displacement effects were measured, hot spots policing programs did not push crime from treated areas into proximate areas; rather, surroundings areas often experienced unanticipated crime reductions known as a “diffusion of benefits” (Clarke and Weisburd 1994; Weisburd et al. 2006). In their review of the available empirical evidence on hot spots policing, the National Research Council’s Committee on Proactive Policing reached a similar conclusion and reported that “hot spots policing strategies generate statistically significant crime reduction effects without simply displacing crime… hot spots policing studies… tend to find that those programs generate a diffusion of crime control benefits” (Weisburd and Majmundar 2018, p. 6).
There is today little disagreement that hot spots policing has a significant impact on crime. However, the magnitude of that effect raises important questions about the policy recommendations that researchers should draw from existing reviews. The Campbell systematic review meta-analysis relied upon the Cohen’s d standardized mean difference effect size to represent the impacts of hot spots policing on crime outcomes in treatment places relative to control places. Braga et al. (2019) reported a “small” overall mean Cohen’s d effect size generated by hot spots policing programs but noted prominent differences in the Cohen’s d effect sizes across included studies with effects ranging from null to large. The overall small effect of hot spots policing on crime raises questions about the practical value of the approach to controlling urban crime problems relative to other crime prevention frameworks (e.g., see Buckley et al. 2020). The estimated small effects of hot spots policing at high-activity crime places raise further questions of crime prevention efficacy when scaling programs up from a limited number of hot spots included in a program evaluation to cover all crime hot spots in a jurisdiction (e.g., see Nagin and Sampson 2019; Weisburd and Majmundar 2018).
The Cohen’s d effect size measure is a standard approach to calculating individual study effects and estimating overall program impacts on outcomes in meta-analysis (Lipsey and Wilson 2001). However, a number of scholars have criticized the use of Cohen’s d as a metric for estimating program effects in area-based crime prevention studies (Farrington et al. 2007; Farrington and Welsh 2013; Wilson 2020). Wilson (2020) recommends using the natural logarithm of the relative incidence rate ratio (RIRR) to represent program effects in evaluations that use place-based count data. The exponential of the log RIRR can be interpreted as the relative percent change in the treatment units of analysis as compared to the control units. Not only is the log RIRR more appropriate to represent effects in hot spots policing studies, it offers a more interpretable estimate of the overall program impacts on crime outcomes relative to the blunt categorization of Cohen’s d as small, medium, or large effects—conventions developed in psychology for research contexts and outcomes very different from those encountered in field studies in crime prevention. In this paper, we re-estimate the results of the Braga et al. (2019) meta-analysis using the log RIRR effect size measure. We find that hot spots policing programs generate statistically-significant reductions in crime that have noteworthy practical significance for police crime prevention policy.
Rethinking Effect Size Measurement in Place Based Studies
The standardized mean difference effect size, also known as Cohen’s d, is calculated by taking the difference in mean outcomes for two groups and dividing the difference by the pooled standard deviation of the outcome for the units of analysis in those groups (Cohen 1988; Lipsey and Wilson 2001). In general, when treatment and control group means are compared, a positive effect size indicates that the treatment group improved relative to the control group and a negative effect size suggests the treatment group worsened relative to the control group. A large literature exists on the statistical properties of Cohen’s d and its standard error, statistical significance testing, and uses in meta-analysis (e.g., Lipsey 1990; Cook et al. 1992; Cooper and Hedges 1994; Rosenthal 1994). Cohen (1988) proposed interpreting the estimated d effect size metrics as small (0.2), medium (0.5), and large (0.8). In sum, this scale suggests the observed difference between two means is trivial if they don't differ by 0.2 standard deviations or more even when the result is statistically significant at the p < 0.05 level.
An ongoing Campbell Collaboration systematic review of hot spots policing on crime used the Cohen’s d metric to represent the results of individual studies as well as when estimating an overall mean program effect in meta-analyses (Braga 2005; Braga et al. 2014, 2019). The meta-analysis in the most recent version of the review included 65 studies representing 78 independent test of hot spots policing and reports an overall statistically-significant small effect of hot spots policing on crime outcomes (d = 0.132, p < 0.05). The Braga et al. (2019) review also reported noteworthy heterogeneity in the statistically-significant individual study effect sizes that favor treatment conditions over control conditions. For instance, the Kansas City gun quasi-experiment study estimated that gun seizures in hot spot locations had a large impact on gun crimes in treatment places relative to control places (d = 0.866, p < 0.05; see Sherman and Rogan 1995b). In contrast, the Philadelphia hot spots foot patrol randomized controlled trial estimated a much more modest impact of increased foot patrol on violent incidents in treatment hot spots (d = 0.143, p < 0.05; see Ratcliffe et al. 2011).
Randomized controlled trials are generally considered to have higher levels of internal validity and, as such, are seen to use a more rigorous evaluation methodology when compared to quasi experimental designs (Shadish et al. 2002). Social scientists often observe that more rigorous research designs tend to report null findings (e.g., see Rossi 1987). Indeed, criminal justice program evaluation research has suggested that less rigorous research designs, such as quasi-experiments, estimate larger effect sizes relative to randomized experimental designs (Weisburd et al. 2001; Welsh et al. 2011). This relationship has not been universally observed, however, as other reviews have found that rigorous quasi-experiments can generate effect sizes that are similar in size to those generated by randomized experiments (Lipsey and Wilson 2001; Shadish and Ragsdale 1996). Braga et al. (2019) noted that research design was an important moderator of hot spots policing effect sizes with quasi-experimental studies estimating a modestly larger within-group effect size (d = 0.171, p < 0.05) relative to the randomized controlled trials (d = 0.109, p < 0.05).
Blueprints for Healthy Youth Development researchers recently completed an unpublished meta-analysis of hot spots policing randomized experiments (Buckley et al. 2020). The Blueprints review used less inclusive methodological criteria for hot spots policing randomized experiments but estimated the same Cohen’s d effect sizes as Braga et al. (2019) for the 19 individuals studies included in their meta-analysis. Based on this limited set of randomized experiments and varying model specifications, the Buckley et al. (2020) meta-analysis estimated an even smaller Cohen’s d effect size for the impacts of hot spots policing on crime (ranging from d = 0.046 to d = 0.051, both p < 0.05). In both the Campbell and Blueprints meta-analyses, the overall mean effect of hot spots policing on crime is considered a small effect by conventional standards developed by Cohen (1988). Yet, Lipsey (2000, p. 109) describes effects in this range in research on delinquency as small but meaningful impacts that could “easily be of practical significance.”
Irrespective of the size of Cohen’s d, it may not be an appropriate metric to summarize the program impacts presented in many hot spots policing studies. Area-based crime prevention evaluations tend to present the count of events, such as the number of robberies at a street segment over a six month span, for treated areas relative to control areas during pre-test and post-test time periods (Farrington and Welsh 2013). In the Braga et al. (2019) hot spots policing review, the researchers converted place-based count data reported in specific studies into an effect size index by first calculating an Odds Ratio (OR) and then transforming the odds ratio into Cohen’s d for inclusion in their meta-analysis. In a recent paper, Wilson (2020) notes that this approach is problematic for place-based count data. First, he correctly observes that the OR is not suitable to represent counts at places as it assumes the outcome data are binary rather than counts. Second, he notes that Cohen’s d is not appropriate for place-based count data as it generates varying values of d depending on how counts are converted to a mean rate. In area-based crime prevention studies, counts are converted to rates by dividing outcomes by units of space, time, or both. As will be described further below, the units of analysis included the Braga et al. (2019) review are heterogeneous, ranging from specific buildings to vary kinds of hot spot locations to larger police districts. Wilson (2020) suggests the lack of a common unit of analysis yields Cohen’ d metrics that are not comparable across studies included in a meta-analysis of study effect sizes.
Wilson (2020) suggests using the relative incidence rate ratio (RIRR) as an effect size for both primary area-based crime prevention studies and the meta-analyses of overall effects across area-based studies. Similar to the OR (and described as the “relative effect size” by Welsh and Farrington (2002)), the RIRR is calculated by the cross-product of rates (rather than counts) from the cells of a 2 by 2 frequency table [(pre-test treatment * post-test control)/(post-test treatment * pre-test control)]. The exponential of the natural logarithm of the RIRR can be then be interpreted as the relative percent change in treatment group outcomes compared to control group outcomes. The RIRR, referred to as the rate ratio, is suggested by the Cochrane systematic reviewing handbook as appropriate for count data (Higgins et al. 2019). However, as Wilson (2020) notes, the Cochrane handbook does not develop a methodology for addressing overdispersion issues when estimating the standard error based on the ratio of post-test counts as compared to pre-test counts (see Berk and MacDonald 2008 for a discussion of handling overdispersion issues in count data). While Wilson suggests adjusting for overdispersion by using a quasi-Poisson model, he acknowledges that most studies do not report the information necessary to calculate an overdispersion parameter via the quasi-Poisson model. Absent such data he recommends an adjustment developed by Farrington et al. (2007) as a suitable solution for addressing overdispersion issues when estimating the standard error of the log RIRR.
A comparison of Cohen’s d and log RIRR effect size metrics in meta-analyses of place-based crime prevention programs was recently conducted in an updated systematic review of 34 studies evaluating the effects of problem-oriented policing on crime (Hinkle et al. 2020). The meta-analysis of Cohen’s d suggested problem-oriented policing produced a statistically significant but small effect on crime outcomes that favor treatment over control conditions (d = 0.183, p < 0.05). In contrast, the log RIRR meta-analysis suggested that problem-oriented policing generated a 29.1% reduction in crime outcomes at treatment areas/groups relative to control areas/groups. The difference in conclusions about the crime control efficacy of problem-oriented policing is noteworthy. The Cohen’s d meta-analytic approach, unsuitable for estimating the effects of the place-based count data used by most of the included problem-oriented policing studies, suggests a small impact on crime while the more appropriate log RIRR approach suggests a substantive crime prevention impact associated with problem-oriented policing. We apply this same comparative approach to better understand the crime control impacts of hot spots policing programs.
Data and Methods
The latest iteration of the systematic review of the effects of hot spots policing on crime followed the protocols and conventions of the Campbell Collaboration (Farrington and Petrosino 2001). We briefly summarize the methods of the most recent systematic review here and encourage interested readers to examine the methodological details described by Braga et al. (2019). The Campbell review only considered hot spot interventions that were comprised of police-led crime control efforts. Eligible interventions included increased traditional policing tactics such as directed radio car and foot patrol (Sherman and Weisburd 1995; Ratcliffe et al. 2011), raids (Sherman and Rogan 1995a), increased traffic enforcement (Rydberg et al. 2017), “broken windows” disorder enforcement (Weisburd et al. 2012), and the application of new technologies, such as actively-monitored closed circuit televisions (CCTV) and license plate readers (Lum et al. 2011; Piza et al. 2015), intended to enhance police presence in crime hot spot locations. Problem-oriented policing efforts designed to identify and address the underlying criminogenic conditions at crime hot spots were also included (Braga et al. 1999; Weisburd and Green 1995).
The units of analyses were crime hot spots or very small high-activity crime places, usually comprising specific locations such as stores and apartment buildings as well as clusters of street addresses, street blocks, and street segments (see Weisburd et al. 2016). Evaluation designs that assess program effects at larger areal units, such as police districts or census tracts, were included if the hot spots policing programs were only implemented at specific crime hot spot locations within these larger units of analysis (see, e.g., Sherman and Rogan 1995b). Eligible studies had to compare official crime outcomes at treated units of analysis relative to official crime outcomes at control locations. Treated units had to be compared to controls units that experienced routine policing services (e.g., regular levels of patrol or enforcement activities). The Campbell review only included comparison group studies that were randomized experiments or nonrandomized quasi-experimental designs (Shadish et al. 2002). The Campbell review also analyzed crime displacement and diffusion of crime control benefits impacts (Clarke and Weisburd 1994; Reppetto 1976).
Multiple search strategies were used to identify eligible studies (see Braga et al. 2019, pp. 5–6 for details). To ensure consistency between the completed Campbell review and our re-analysis of study effect sizes, we did not seek to identify new studies completed after Braga et al. (2019) completed their search. In early 2017, the following search strategies were executed: a keyword search of 15 online abstract databases (including grey literature databases that identify published reports, theses, dissertations, unpublished reports, and unpublished working papers), a search of bibliographies and empirical reviews of the efficacy of police crime control efforts, forward searches for literature that referenced key hot spots policing studies, searches of completed Campbell systematic reviews of police crime prevention programs, and hand searches of leading criminology and criminal justice journals. These searches were conducted under the supervision of an information retrieval specialist. After the initial search was completed, the search criteria and identified studies were emailed to 146 leading policing experts. These experts reviewed the identified studies and made referrals for studies that were not included, especially unpublished reports and other grey literature sources. In total, the Braga et al. (2019) systematic review identified 65 studies that included 78 independent randomized experimental and quasi-experimental tests of hot spots policing on crime. However, only 62 studies representing 73 tests reported the necessary information to be included in their meta-analysis.
Meta-analytic techniques are typically deployed to synthesize the empirical relationships across studies included in systematic reviews and use specialized statistical methods to analyze the relationships between findings and study features (Lipsey and Wilson 2001; Wilson 2001). The findings of each study are indexed in the overall meta-analysis through the “effect size statistic” which represents the direction (negative or positive) and strength (size of the program impact) of the relationship estimated in a specific study. The average treatment effect of the program on outcomes across the included studies is represented by the “mean effect size.” The overall mean effect size is estimated by calculating a mean that is weighted by the precision of the effect size for each specific study. Braga et al. (2019) generally calculated Cohen’s d by transforming Odds Ratio (OR) effect sizes estimated from treatment and control group pre-test and post-test crime counts.Footnote 1 The log of this OR was then multiplied by √3/π (Hasselblad and Hedges 1995). The variance of log OR was adjusted for overdispersion (Farrington et al. 2007) and then then multiplied by (3/π2) to give the final variance of the effect size [V(d)] (Hasselblad and Hedges 1995). When this OR approach was not possible in specific studies, Braga et al. (2019) used other methods to estimate Cohen’s d.
For this paper, we calculated the RIRR and the variance of the log RIRR from the raw pre-test and post-test counts from the treatment and control groups in the included studies using the following formulae:
The variance of the log of the RIRR (V(log RIRR)) was then adjusted for overdispersion (see Farrington et al. 2007). The overdispersion adjustment was calculated as the product of V(log RIRR) and D, with D = 0.0008 × N + 1.2.Footnote 2 In this formula, N is the mean number of incidents per case and is estimated as the total number of incidents (a + b + c + d) divided by the total number of treatment units plus control units. For those studies that reported sufficient information, we also estimated a quasi-Poisson estimator for overdispersion and conducted a sensitivity analysis that compared the results of the two overdispersion adjustments.Footnote 3 As described above, the exponential of the natural log of the RIRR was used to represent the relative percent change in the treatment group compared to the control group.
Fifty-three studies representing 60 tests of hot spots policing interventions provided the necessary pre-test and post-test counts for the treatment and control groups to estimate log RIRR and V(log RIRR). One of these studies, the Philadelphia predictive policing randomized experiment (Groff et al. 2015), did not report these data but provided the log IRR and its standard error. These 53 included hot spots policing studies and 60 tests of hot spots policing interventions accounted for 85.5% of the 62 studies and 82.2% of the 73 tests reported in the main effects meta-analyses in the Campbell review (Braga et al. 2019, p. 33). Further, the 53 studies included in this research contained 26 tests of crime displacement and diffusion of crime control benefits effects that reported the necessary information to calculate log RIRR and V(log RIRR). These 26 tests represent 65.0% of the 40 diffusion and displacement tests included in the Campbell review meta-analyses (Braga et al. 2019, p. 33).
Biostat’s Comprehensive Meta Analysis Version 2.2 was used to conduct the meta- analyses of log RIRR effect sizes for the 60 main effect tests and 26 displacement and diffusion effects tests reported in the 53 included hot spots policing studies. Moderator analyses to estimate the effects of research design and hot spots policing program types on overall effect sizes were then conducted. The mean effect sizes for the effects of hot spots policing programs on violent crime, property crime, and drug/disorder offense outcomes were also estimated. Below the results of meta-analyses of Cohen’s d effect sizes are presented in tandem with the log RIRR meta-analyses.
Results
The forest plot in Fig. 1 shows the Cohen’s d standardized difference in means between the treatment and control or comparison conditions with a 95% confidence interval plotted around them for each of the 60 main effects tests. Points plotted to the right of 0 indicate a treatment effect; in other words, the hot spots policing intervention improved conditions in the treated crime hot spots relative to the control hot spots. Points to the left of 0 indicate an iatrogenic effect; this suggests that conditions in the control hot spots improved relative to treatment hot spots that experienced the intervention. Forty-five tests reported effect sizes that favored treatment conditions over control conditions (75.0% of 60 total tests). A random effects model was used to estimate the overall mean effect size given a heterogeneous distribution of effect sizes (Q = 314.494, degrees of freedom = 59, p < 0.001, I2 = 81.240). The meta-analysis of effect sizes suggests an overall small effect in favor of hot spots policing programs (d = 0.120, p < 0.001). We note that this effect size is very close to that reported for the full sample of studies in Braga et al. (2019), where a “small mean effect size” of 0.13 is reported (p < 0.001). The d = 0.120 mean effect size suggests hot spots policing programs generate an 8.1% reduction in crime outcomes in treatment hot spots when compared to control hot spots.
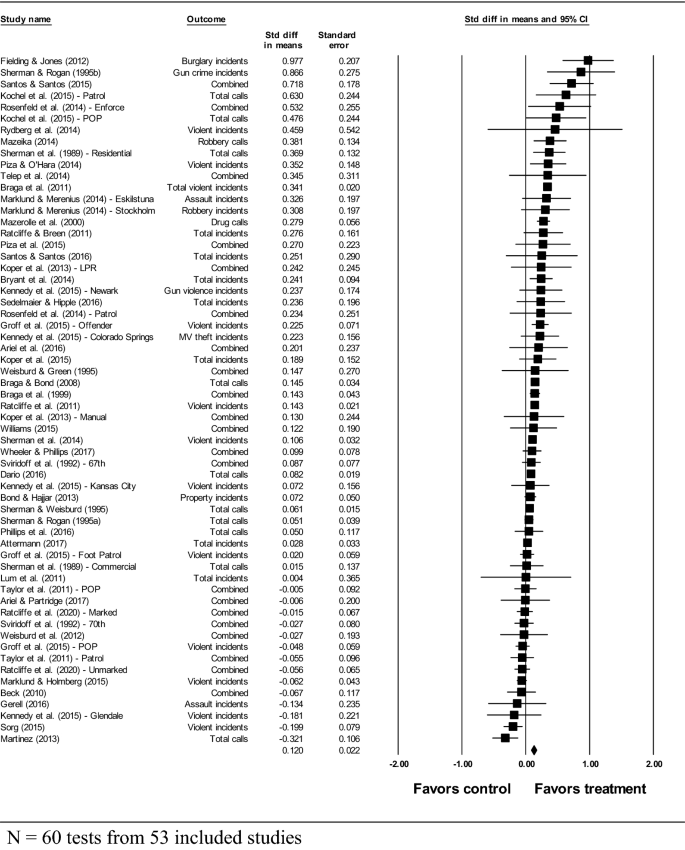
Main effects meta-analysis of included hot spots policing studies: standardized mean differences (Cohen’s d). N = 60 tests from 53 included studies. Random effects model used. Standardized mean difference = 0.120, standard error = 0.022, Z = 5.478, p < 0.001, 95% CI = (0.077, 0.162). Q = 314.494, degrees of freedom = 59, p < 0.001, I2 = 81.240
Figure 2 presents the forest plot for the random effects meta-analysis of log RIRR effect sizes for the 60 hot spots policing main effects tests (Q = 355.894, degrees of freedom = 59, p < 0.001, I2 = 83.422). Similar to the standardized mean difference meta-analysis, the random effects model analyzing the log RIRR effect sizes suggests an overall effect in favor of hot spots policing programs (log RIRR = 1.161, p < 0.001). However, the interpretation of the log RIRR coefficient suggests that hot spots policing interventions on average have a substantive impact on crime. Our model suggests that, on average, hot spots policing interventions generate a 16% reduction in crime outcomes in treatment hot spots relative to control hot spots (in standard deviation units, d = 0.235). As we discuss below, we do not think that this RIRR warrants an interpretation of a marginal effect for hot spots policing programs. Rather it illustrates the strong potential for hot spots policing to have meaningful impacts on crime as the estimated overall log RIRR mean effect size is roughly twice the size of the estimated overall standardized mean difference effect size when placed on the same percent and standard deviation unit scales.
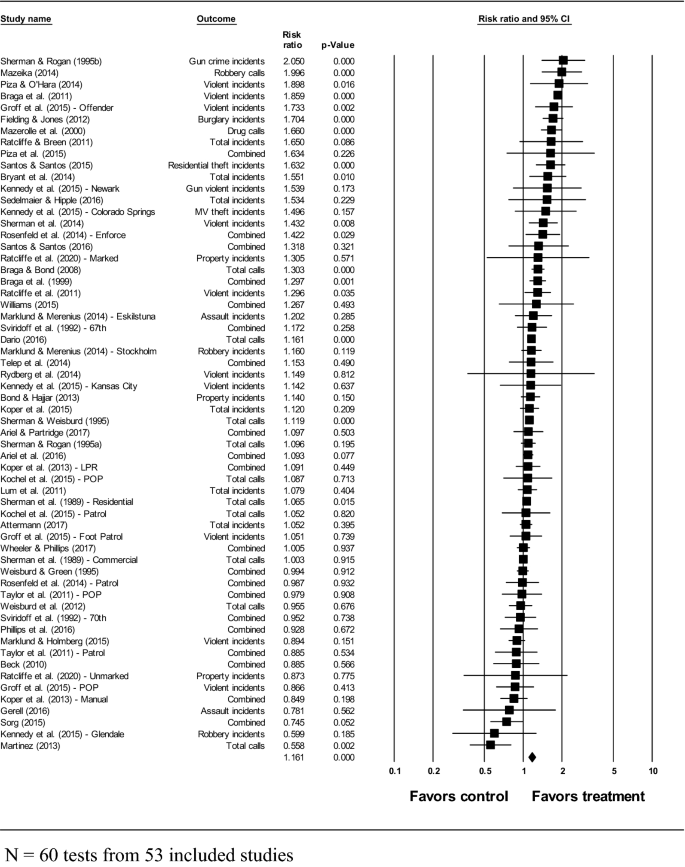
Main effects meta-analysis of included hot spots policing studies: log of the relative incidence rate ratio (Log RIRR). N = 60 tests from 53 included studies. Random effects model used. Log RIRR = 1.161, Z = 4.773, p < 0.001, 95% CI = (1.092, 1.235). Q = 355.894, degrees of freedom = 59, p < 0.001, I2 = 83.422
Importantly, the comparison of results not only alters our interpretation of the mean effect of hot spots policing interventions, it suggests problems in interpreting the relative impacts of specific studies. In the case of Cohen’s d, the five largest program impacts are found in descending order for Fielding and Jones (2012), Sherman and Rogan (1995b), Santos and Santos (2015), Kochel et al. (2015) patrol intervention, and Rosenfeld et al. (2014) aggressive enforcement patrol intervention. In the log RIRR analysis, only Sherman and Rogan (1995b) is included in the top five effect size studies. Fielding and Jones (2012) moved from position 1 in the Cohen’s d analysis, to position 6 in the log RIRR analysis. Santos and Santos (2015) moved from position 3 to position 10. Kochel et al. (2015) patrol intervention moved from position 4 to position 40, and Rosenfeld et al. (2014) aggressive enforcement patrol intervention moved from position 5 to position 16. We find a mean difference of 9.3 rank positions when comparing the absolute differences between the rank order of the scores using the Cohen’s d method as contrasted with the log RIRR method. What this suggests is that the IRR results not only provide an interpretive difference as compared with the Cohen’s d results, they provide different relative effect sizes. Given the clear methodological limitations of using Cohen’s d to estimate standardized effects for place based count data, these findings show that Cohen’s d estimates lead to misleading relative effect sizes in hot spots policing studies.
It is worth noting here that our meta-analyses estimated overall mean effect sizes are based on heterogeneous outcome measures. Heterogeneity in reported outcomes across the studies included the kind of outcome data evaluated (such as crime incidents versus calls for service), the type of crime outcomes measured (total crimes versus a specific crime category such as robbery or assault), and the number of crime outcomes reported. For instance, the Minneapolis hot spots patrol experiment reported hard, soft, and total calls for service as the main study outcome measures (Sherman and Weisburd 1995) while the Kansas City gun quasi-experiment only reported gun crime incidents as the key outcome measure (Sherman and Rogan 1995a, b). As such, the study mean effect sizes may not be directly comparable and caution should be used when interpreting overall mean effect sizes. Additionally, we follow meta-analysis conventions by combining all outcomes reported in each study into an overall mean effect size statistic (Lipsey and Wilson 2001).Footnote 4 This approach is conservative and likely underestimates the effects of hot spots policing on crime (for a discussion, see Braga et al. 2019).
Twenty-three studies involving 28 tests of hot spots policing interventions on some 87 outcome measures reported sufficient information to calculate study-level quasi-Poisson estimators for overdispersion. Similar to the results of the random effects model using the Farrington et al. (2007) adjustment, a random effects model analyzing the log RIRR effect sizes with standard errors adjusted via the quasi-Poisson overdispersion parameter suggested an overall effect in favor of hot spots policing programs (log RIRR = 1.154, p < 0.038) for these 28 tests.Footnote 5 We then estimated a mean quasi-Poisson overdispersion parameter based on the 87 outcomes reported by these 28 tests and used this mean parameter to adjust the standard errors for the 32 hot spots policing tests that did not report sufficient information to calculate study-level quasi-Poisson estimators for overdispersion. A random effects model that included all 60 tests adjusted by quasi-Poisson overdispersion parameters also estimated an overall log RIRR effect size in favor hot spots policing (log RIRR = 1.144, p < 0.001).Footnote 6 These sensitivity analyses suggests that the results of our meta-analyses were robust to varying methods to adjust for overdispersion in the standard errors of log RIRR effect sizes.
The 60 studies included 32 randomized controlled trials (53.3%) and 28 quasi-experimental evaluations (46.7%). Consistent with the prior Campbell hot spots policing review (Braga et al. 2019), we included research design as an effect size moderator given the suggested differences in methodological rigor between randomized controlled trials and quasi-experiments. Figure 3 presents the results of a random effect models using Cohen’s d standardized mean effect sizes for 32 randomized controlled trials and 28 quasi-experiments included in this study. The quasi-experimental designs were associated with a modestly larger within-group effect size (d = 0.152, p < 0.001) relative to the randomized controlled trial designs (d = 0.096, p < 0.001). Figure 4 presents the results of the random effects meta-analysis of log RIRR effect sizes that included research design as an effect size moderator. The results were essentially the same with randomized controlled trials generating a smaller within-group effect size (log RIRR = 1.118, p < 0.001) when compared to quasi-experiments (log RIRR = 1.212, p < 0.001). However, the interpretation of the log RIRR coefficients suggests that quasi-experimental evaluations of hot spots policing programs estimate a 21% reduction in crime at treatment locations relative to control locations while randomize experiments testing hot spots policing programs estimate a more modest 12% reduction in crime at treatment locations relative to control locations. In both the Cohen’s d and log RIRR meta analyses, the between group Q statistic suggested that the within-group mean effect sizes were indeed different (p < 0.001).Footnote 7
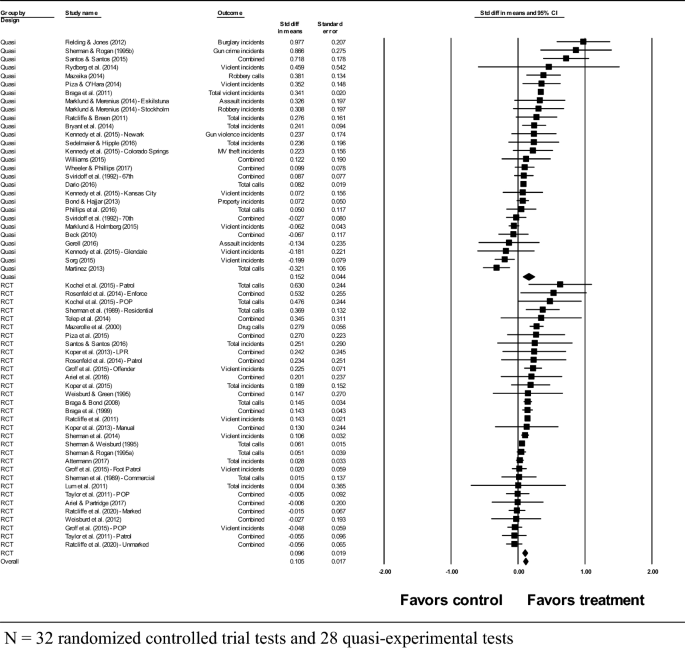
Research design as moderator for study outcomes: standardized mean differences (Cohen’s d). N = 32 randomized controlled trial tests and 28 quasi-experimental tests. Random effects model used. Quasi-experiment standardized mean difference = 0.152, standard error = 0.044, Z = 3.484, p < 0.001, 95% CI = (0.067, 0.238). Randomized controlled trial standardized mean difference = 0.096, standard error = 0.019, Z = 5.065, p < 0.001, 95% CI = (0.059, 0.134). Overall standardized mean difference = 0.105, standard error = 0.017, Z = 6.036, p < 0.001, 95% CI = (0.071, 0.140). Quasi-experiment Q = 223.435, degrees of freedom = 27, p < 0.001, I2 = 87.916. Randomized controlled trial Q = 70.488, degrees of freedom = 31, p < 0.001, I2 = 56.021. Between group Q = 20.573, degrees of freedom = 1, p < 0.001
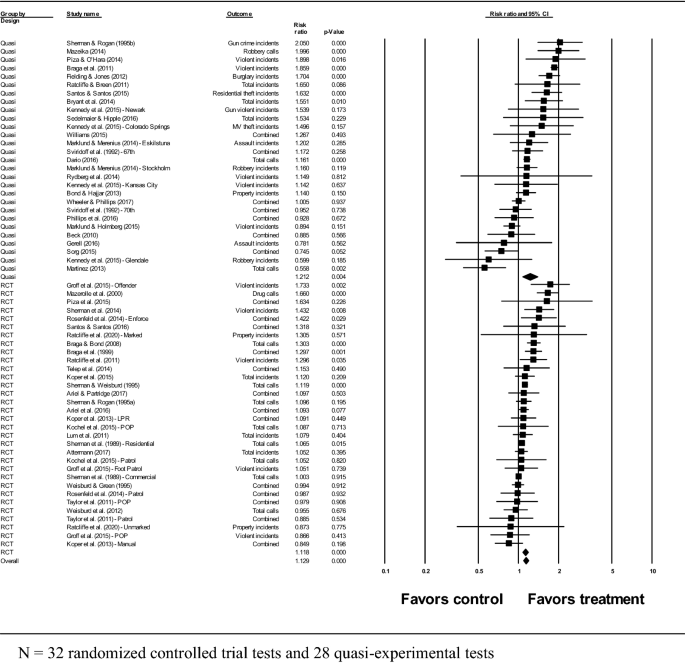
Research design as moderator for study outcomes: log of the relative incidence rate ratio (Log RIRR). N = 32 randomized controlled trial tests and 28 quasi-experimental tests. Random effects model used. Quasi-experiment Log RIRR = 1.212, Z = 2.883, p = 0.004, 95% CI = (1.064, 1.382). Randomized controlled trial Log RIRR = 1.118, Z = 4.564, p < 0.001, 95% CI = (1.066, 1.173). Overall Log RIRR = 1.129, Z = 5.277, p < 0.001, 95% CI = (1.079, 1.180). Quasi-experiment Q = 223.506, degrees of freedom = 27, p < 0.001, I2 = 87.920. Randomized controlled trial Q = 70.729, degrees of freedom = 31, p < 0.001, I2 = 56.171. Between group Q = 61.658, degrees of freedom = 1, p < 0.001
Figures 5 and 6 make the same effect size comparisons for the Cohen’s d and log RIRR meta-analyses for the 26 included crime displacement and diffusion of crime control benefits effects. The meta-analyses suggest that hot spots policing interventions do not push offenders to commit their crimes in surrounding areas. Rather, both analyses suggested that areas proximate to treated hot spots relative to areas proximate to control hot spots experienced small diffusion of crime control benefits effects that were not statistically significant at the conventional p < 0.05 benchmark (Cohen’s d = 0.033, log RIRR = 1.069). The overall mean log RIRR effect size suggests a marginally significant (p = 0.89) diffusion effect when crime outcomes in catchment areas surrounding the treated hot spots were compared to crime outcomes in catchment areas surrounding the control hot spots.
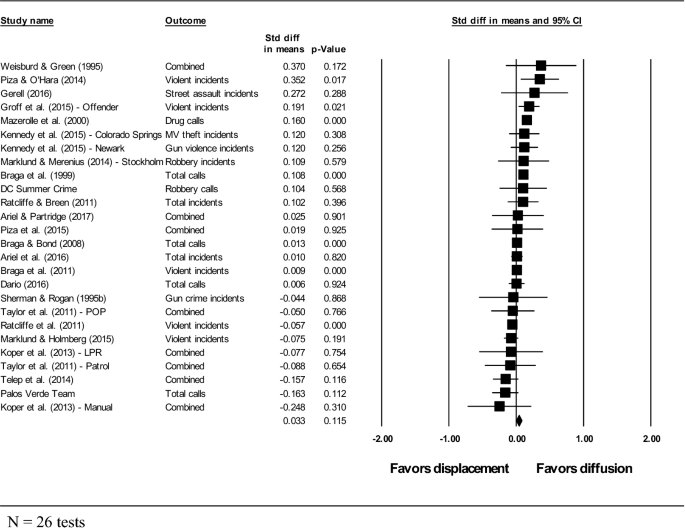
Crime displacement and diffusion of crime control benefits effects meta-analysis of hot spots policing studies: standardized mean differences (Cohen’s d). N = 26 tests. Random effects model used. Standardized mean difference = 0.033, standard error = , Z = 1.575, p = 0.115, 95% CI = (-0.008, 0.074). Q = 641.612, degrees of freedom = 25, p < 0.001, I2 = 99.961
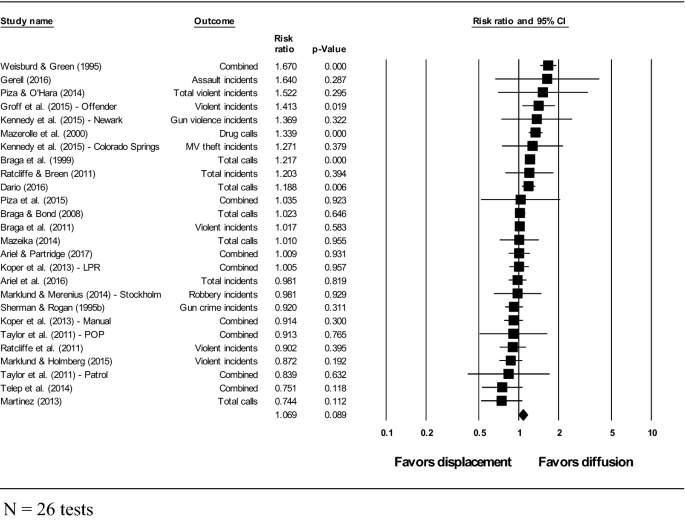
Crime displacement and diffusion of crime control benefits effects meta-analysis of hot spots policing studies: log of the relative incidence rate ratio (Log RIRR). N = 26 tests. Random effects model used. Log RIRR = 1.069, Z = 1.701, p = 0.089, 95% CI = (0.990, 1.069). Q = 91.200, degrees of freedom = 25, p < 0.001, I2 = 72.588
The Braga et al. (2019) systematic review identified two broad classes of interventions used to prevent crime at hot spots: problem-oriented policing and increased levels of traditional policing tactics. As Table 1 reveals, this analysis included 20 studies evaluating the impacts of problem-oriented policing interventions on crime hot spots (33.3%) and 40 studies evaluating the impacts of increased policing interventions on crime hot spots (66.7%). Consistent with the findings of the Braga et al. (2019) review, both meta-analyses revealed that problem-oriented policing programs produced a slightly larger overall mean effect size relative to the size of the overall mean effect size generated by increased traditional policing programs. Using the overall mean log RIRR effect size metric, problem-oriented policing programs generated a 17% reduction and increased policing programs generated a 14% reduction in crime outcomes at treatment hot spots relative to crime outcomes at control hot spots. However, the differences between problem oriented policing and increased police presence was not statistically significant (Q = 0.161, df = 1, p = 0.688).
Table 1 also presents the overall mean Cohen’s d and log RIRR effect sizes estimated by the meta-analyses for specific crime types reported in the included studies. Both types of effect size metrics noted that hot spots policing programs produced statistically-significant reductions in violent crime, property crime, and disorder/drug crimes in the treatment hot spots relative to control hot spots. Based on the overall mean log RIRR effect size, hot spots policing interventions generated a 19% reduction in violent crime (p < 0.05), a 16% reduction in property crime (p < 0.05), and a 20% reduction in disorder/drug crimes (p < 0.05).
Discussion
A key purpose of our analyses in this paper was to identify whether Cohen’s d estimates provide a biased view of the impacts of hot spots policing interventions. As we noted earlier, meta-analytic scholars argue that Cohen’s d estimates are inappropriate for assessing count based outcomes in place based studies (Farrington et al. 2007; Farrington and Welsh 2013; Wilson 2020). Using log RIRR estimates suggested by Wilson (2020) to overcome these limitations for assessing effect sizes, we find very different results for the magnitudes of specific hot spots policing studies. Indeed, studies ranked as having very large effect sizes in the Cohen’s d approach often have relatively modest effects using the log RIRR approach. And the rank ordering of effect sizes for the two approaches is notably different. This suggests not simply that there will be some error in using Cohen’s d as the estimator for mean effect size in place based studies using count data, but that it will provide misleading results. We think that this finding is relevant not only for hot spots policing meta analyses but across the broad range of place based studies that are reviewed using meta analyses. Our findings confirm Wilson’s (2020) recommendation that Cohen’s d not be used in such situations.
But more importantly, given the goals of our review, our findings alter substantively our interpretation of the average impacts of hot spots policing interventions. One reason for this derives from the inherent limitations of using conventions from a different field to assess the importance of effect sizes in criminology. The standardized effect size conventions that are commonly used today in meta analyses, and other areas of research, were developed by Jacob Cohen in the 1980s. He recognized at the outset that such conventions were arbitrary. But in developing a methodology for estimating statistical power, he sought to provide some guidance that would allow researchers to carry out power analyses on unknown outcomes (see Cohen 1988, p. 13). He noted that his conventions “accord with a subjective average of effect sizes such as are encountered in behavioral science.” But to our knowledge he did not present any substantive research to support his propositions. Defining small effects (d = 0.2) he notes:
Small effect sizes must not be so small that seeking them amidst the inevitable operation of measurement and experimental bias and lack of fidelity is a bootless task, yet not so large as to make them fairly perceptible to the naked observational eye.
Defining large effects (d = 0.8), he notes:
In contrast, large effects must not be defined as so large that their quest by statistical methods is wholly a labor of supererogation, or to use Tukey’s delightful term “statistical sanctification.” That is, the difference in size between apples and pineapples is of an order which hardly requires an approach via statistical analysis.
We think that it is time to recognize that Cohen’s suggestions for effect size conventions may not be appropriate for field evaluations in crime research Lipsey (2000). has already made this point based on his meta analyses of research on misbehavior by juveniles, suggesting that 0.10 might be a better mark for a small effect than 0.20. But we think the problem is deeper than simply the size of the effect. The effect size conventions developed by Cohen should be reconsidered in the context of what effects mean in crime prevention. For example, a small impact on murder rates would lead to significant societal benefit. The RAND Corporation has estimates that each murder prevented translates to a societal economic savings of $8,649,216.Footnote 8 Cohen’s d effect sizes were created in a different time for a different purpose (i.e. for conducting power analyses) than the assessment of the magnitude of impacts in evaluations of field studies in crime. More generally, program implementation fidelity should also be assessed when considering effect sizes for inclusion in meta-analysis (Johnson, Tilley, and Bowers 2015). More accurate effect size estimates may be of little value if evaluated programs were not implemented or only partially implemented.
Irrespective of the value of Cohen’s d standardized effect size conventions, the log RIRR results provide a different perspective on the average impacts of hot spots policing interventions. Our results show an average 16% decline in crime in hot spot areas versus control areas. In the world of place based prevention this would not likely be seen as a trivial impact. For a police executive, knowing that the application of hot spots policing would lead to a 16% decline in areas with large numbers of crime events, is likely to be an attractive option—especially when we consider that the decline is not relative to “no policing” but rather to standard police attention at these places. This point is made strongly in a recent paper reporting on a randomized hot spots experiment at public transportation hot spots (Ariel et al. 2020). In that study there was no police patrol in the control areas, and large intervention impacts were observed. Indeed, there was a 21% decline in crime at the treatment hot spots. Ariel et al. (2020) argue that their study shows that hot spots policing evaluations often underestimate the impacts of hot spots interventions because they generally compare the intervention to policing as usual, and not a true placebo outcome.
Nonetheless, to some observers, the estimated overall crime reductions generated by hot spots policing programs included in this analysis may seem to be modest. However, when the costs associated with crime incidents are considered, the policy impacts of these estimated crime reductions are much more substantive. For instance, the violent crime hot spot identification phase of the Jersey City problem-oriented policing at violent crime places randomized controlled trial identified 56 violent crime hot spots for possible inclusion in the field experiment: these hot spots consisted of roughly 6% of the intersections and street segments in Jersey City and, in 1993, these places accounted for some 24% of total assault incidents and 20% of total robbery incidents.Footnote 9 In 1993, the Jersey City Police Department reported a citywide total of 1,964 aggravated assault incidents and 2,500 robbery incidents to the FBI Uniform Crime Reports program,Footnote 10 with an estimated 471 aggravated assaults and 500 robberies occurring in the violent crime hot spots. The hot spot identification phase of the Lowell policing crime and disorder hot spots randomized controlled trial identified 34 hot spots that accounted for slightly less than 3% of the city’s total geography but generated roughly 29% of violent crime calls for service to the Lowell Police Department in 2004 (Braga and Bond 2008). In that same year, the Lowell Police Department reported 169 robbery incidents and 771 aggravated assault incidents to the FBI UCR program,Footnote 11 with an estimated 49 robbery incidents and 224 aggravated assault incidents occurring in the identified crime and disorder hot spot locations.
Applying the log RIRR overall mean effect of an 18.6% reduction in violent crimes generated by hot spots policing programs to these data, the hot spots policing intervention would have prevented some 88 aggravated assault incidents and 100 robbery incidents in Jersey City, and some 9 robbery incidents and 42 aggravated assault incidents in Lowell. The Rand Corporation estimates that each aggravated assault costs $87,238 and each robbery costs $67,277.Footnote 12 As such, the hot spots policing intervention would have generated roughly $14.4 million in cost savings if the program was applied to all violent crime hot spots in Jersey City for one year.Footnote 13 In Lowell, the hot spots policing intervention would have saved nearly $4.3 million if implemented over the course of one year. The Jersey City and Lowell hot spots policing programs were “cost neutral” in the sense that these interventions were implemented using existing resources within these respective police departments. However, it is obviously important to consider implementation costs and other economic factors when assessing potential savings associated with implemented programs. Hot spots policing programs should be subjected to much more rigorous cost–benefit analyses that go beyond the simple calculations presented here (for a discussion, see Manning et al. 2016).
Conclusion
The results of this updated meta-analysis suggest that the practical effects of hot spots policing are not small when a more appropriate effect size measure is applied to the meta-analysis of study findings. In this analysis, the overall mean log RIRR effect size suggest hot spots policing programs generate a statistically significant 16% reduction in crime counts at treatment places relative to crime counts at control places. Further, hot spots policing programs generated statistically significant reductions in specific violent crime, property crime, and drug/disorder offense outcomes. When the included studies measured spillover program effects in spatially-proximate areas, the meta-analysis did not find significant crime displacement into locations surrounding treatment hot spots relative to locations surrounding control hot spots—indeed marginally significant outcomes were identified for a diffusion of crime control benefits to those areas.
The meta-analyses presented here and in the ongoing Campbell systematic review of hot spots policing studies reveal heterogeneous effect sizes associated with varying kinds of hot spots policing interventions implemented to control a wide range of crime hot spots. Despite this heterogeneity, the study effect sizes are almost all in the same direction and, overall, support a crime reduction impact generated by hot spots policing. This is strong evidence that the approach will consistently generate crime prevention benefits when implemented by police departments. However, it is important to recognize that these meta-analyses are, to some extent, “mixing apples and oranges” within the broad category of hot spots policing programs. As such, we think it is inadvisable to rely too heavily on the average effect size estimated by a meta-analysis of hot spots policing programs when considering police crime prevention policy and practice. We encourage policy makers, police executives, and scholars to review specific studies to develop a clearer sense for the types of hot spots policing interventions and the kinds of high-crime places that will generate the most benefit for a specific jurisdiction dealing with persistent crime problems that concentrate at particular locations.
Notes
- 1.
While some meta-analytic scholars had raised concerns about using Cohen’s d to represent program effects in studies that reported area-based crime count data (Farrington et al. 2007; Farrington and Welsh 2013), the general approach used in the ongoing hot spots policing systematic review was considered an acceptable methodology. Indeed, the effect size approach used in the hot spots policing review passed ongoing scientific scrutiny by Campbell Collaboration methods reviewers and high-quality social science journal peer reviewers.
- 2.
In their meta-analysis of an English national quasi-experimental multi-site evaluation of the effects of closed-circuit television (CCTV), Farrington et al. (2007) derived this adjustment for overdispersion through a linear regression analysis of 70 sets of monthly crime counts in treatment, control, buffer, and police division areas. As they described (Farrington et al. 2007, pp. 36–37), “For each area in each year, the total number of crimes N was compared with V/N, where V is the estimated variance of the number of crimes (based on monthly numbers). In a Poisson process, V/N = 1. It was clear that V/N increased with the total number of crimes. The correlation between V/N and N was 0.77 (p < 0.0001). A linear regression analysis showed that V/N = 0.0008 * N + 1.2.”.
- 3.
Wilson (2020) suggests the following formula to estimate the quasi-Poisson overdispersion parameter: ∅=1∑nk−2∑s2k(nk−1)xk¯¯¯¯¯¯,∅=1∑nk−2∑sk2(nk−1)xk¯, where xk¯¯¯¯¯xk¯ is the mean count (or rate) for the treatment and control areas both pretest and post-test, resulting in four means, sk is the standard deviation for each of the four mean counts, and nk is the number of counts contributing to each mean and standard deviation. For studies that reported the log IRR and its standard error, we used those metrics in the meta-analysis as these count regression models already adjusted for overdispersion.
- 4.
When included studies reported an aggregate crime category (such as total incidents or total calls for service), we calculated our effect size measures based on the provided metrics. In the absence of an aggregate crime category, we combined all reported outcomes into an overall average effect size statistic (designated “combined” in the meta-analysis forest plots).
- 5.
Q = 67.516, degrees of freedom = 27, p < 0.001, I2 = 60.009.
- 6.
Q = 78/944, degrees of freedom = 59, p < 0.05, I2 = 25.264.
- 7.
For the Cohen’s d meta-analysis, the between group Q = 20.573, degrees of freedom = 1, p < 0.001. For the log RIRR meta-analysis, the between group Q = 61.658, degrees of freedom = 1, p < 0.001.
- 8.
https://www.rand.org/well-being/justice-policy/centers/quality-policing/cost-of-crime.html (accessed May 22, 2020).
- 9.
While the identification process yielded 56 distinct violent crime hot spots, the Jersey City Police Department’s Violent Crimes Unit only had the resources to implement the problem-oriented policing intervention at 12 treatment locations that were matched in pairs to 12 control locations (one member of each pair was allocated to treatment and control conditions). As such, the resulting randomized controlled trial only considered N = 24 total violent crime hot spots. For discussion of the hot spots identification process and the implementation of the randomized controlled trial, please see Braga (1997) and Braga et al. (1999). We used FBI UCR citywide counts to estimate the number of aggravated assaults because the randomized experiment included simple assaults and aggravated assaults in one total assault incident outcome.
- 10.
https://www.ucrdatatool.gov/Search/Crime/Local/RunCrimeJurisbyJurisLarge.cfm (accessed May 22, 2020).
- 11.
https://www2.fbi.gov/ucr/cius_04/documents/CIUS_2004_Section2.pdf (accessed May 22, 2020).
- 12.
https://www.rand.org/well-being/justice-policy/centers/quality-policing/cost-of-crime.html (accessed May 17, 2020).
- 13.
When we limited our main effects meta-analysis to the hot spots policing studies included in the Blueprints review (Buckley et al. 2020) that included the appropriate information to estimate log RIRR effect size metrics (N = 18), our meta-analysis estimated a 10.3% reduction in crime at treatment places relative to control places. Using the violent crime counts and cost estimates presented in the main text, the much more restrictive Blueprints review suggests that the hot spots policing intervention would have generated roughly $7.8 million in cost savings if the program was applied to all violent crime hot spots in Jersey City for one year and $2.3 million if applied to violence in all crime and disorder hot spots in Lowell for one year.
References
Ariel B, Partridge H (2017) Predictable policing: Measuring the crime control benefits of hotspots policing at bus stops. J Quant Criminol 33:809–833
Ariel B, Sherman LW, Newton M (2020) Testing hot-spots police patrols against no-treatment controls: temporal and spatial deterrence effects in the London Underground experiment. Criminology 58:101–128
Ariel B, Weinborn C, Sherman LW (2016) “Soft” policing at hot spots—do police community support officers work? A randomized controlled trial. J Exp Criminol 12:277–317
Attermann CV (2017) Investigating hot spots policing. Ministry of Justice Research Office, Copenhagen
Beck JW (2010) The Effects of Directed Patrols in Unincorporated Areas: A Case Study of the Data-Driven Approach to Crime and Traffic Safety. University of Nevada, Reno, NV
Berk R, MacDonald JM (2008) Overdispersion and Poisson regression. J Quant Criminol 24:269–284
Bond BJ, Hajjar L (2013) Measuring congruence between property crime problems and response strategies: enhancing the problem-solving process. Police Q 16:323–338
Braga AA (1997) Solving violent crime problems: an evaluation of the Jersey City police department’s pilot program to control violent places, Ph.D. diss., Rutgers University, University Microfilms International, Ann Arbor, MI
Braga AA (2001) The effects of hot spots policing on crime. Annals 578:104–125
Braga AA (2005) Hot spots policing and crime prevention: a systematic review of randomized controlled trials. J Exp Criminol 1:317–342
Braga A, Bond B (2008) Policing crime and disorder hot spots: a randomized controlled trial. Criminology 46:577–608
Braga A, Hureau D, Papachristos A (2011) An ex-post-facto evaluation framework for place-based police interventions. Eval Rev 35:592–626
Braga AA, Papachristos AV, Hureau DM (2014) The effects of hot spots policing on crime: an updated systematic review and meta-analysis. Just Q 31:633–663
Braga AA, Turchan B, Papachristos AV, Hureau DM (2019) Hot spots policing of small geographic areas effects on crime. Campbell Syst Rev 15:e1046
Braga AA, Weisburd D (2010) Policing problem places: crime hot spots and effective prevention. Oxford University Press, New York
Braga A, Weisburd D, Waring E, Mazerolle LG, Spelman W, Gajewski F (1999) Problem-oriented policing in violent crime places: a randomized controlled experiment. Criminology 37:541–580
Bryant KM, Collins G, Villa J (2014) Data driven approaches to crime and traffic safety: Shawnee, Kansas 2010–2013. US Bureau of Justice Assistance, Washington, DC
Buckley P, Cook T, Elliott D, Gardner F, Gottfredson D, Hawkins JD, Hedges LV, Murry V, Tolan P, Tipton E, Vollmer L, Wadhwa M (2020) Does hot spots policing reduce crime? An alternative interpretation based on a meta-analysis of randomized experiments, University of Colorado, Boulder, CO
Clarke RV, Weisburd D (1994) Diffusion of crime control benefits: observations on the reverse of displacement. Crime Prev Stud 2:165–184
Cohen J (1988) Statistical power analysis for the behavioral sciences, 2nd edn. Lawrence Erlbaum, Hillsdale
Cook T, Cooper H, Cordray D, Hartmann H, Hedges LV, Light R, Louis T, Mosteller F (1992) Meta-analysis for explanation: a casebook. Russell Sage Foundation, New York
Cooper H, Hedges LV (eds) (1994) The handbook of research synthesis. Russell Sage Foundation, New York
Dario LM (2016) Crime at convenience stores: assessing an in-depth problem-oriented policing initiative, Ph.D. diss., Arizona State University, Phoenix, AZ
Farrington D, Gill M, Waples S, Argomaniz J (2007) The effects of closed-circuit television on crime: meta-analysis of an English national quasi-experimental multi-site evaluation. J Exp Criminol 3:21–38
Farrington D, Petrosino A (2001) The Campbell collaboration crime and justice group. Annals 578:35–49
Farrington D, Welsh B (2013) Measuring effect size in meta-analysis, with special reference to area-based crime prevention programmes and the effects of closed-circuit television on crime. In: Kuhn A, Margot P, Aebi M, Schwarzenegger C, Donatsch A, Jositsch D (eds) Criminology, criminal policy and criminal law in international perspective. Stämpfli Verlag, Bern, Switzerland, pp 75–89
Fielding M, Jones V (2012) ‘Disrupting the optimal forager’: Predictive risk mapping and domestic burglary reduction in Trafford, Greater Manchester. Int J Police Sci Mgmt 14:30–41
Gerell M (2016) Hot spot policing with actively monitored CCTV cameras: does it reduce assaults in public places? Int Crim Just Rev 26:187–201
Groff ER, Ratcliffe JH, Haberman CP, Sorg ET, Joyce NM, Taylor RB (2015) Does what police do at hot spots matter? The Philadelphia policing tactics experiment. Criminology 53:23–53
Hasselblad V, Hedges LV (1995) Meta-analysis of screening and diagnostic tests. Psych Bull 117:167–178
Higgins J, Thomas J, Chandler J, Cumpston M, Li T, Page M, Welch V (2019) Cochrane handbook for systematic reviews of interventions, https://www.training.cochrane.org/handbook. Accessed 24 May 2020
Hinkle J, Weisburd D, Telep C, Peterson K (2020) Problem-oriented policing for reducing crime and disorder: an updated systematic review and meta-analysis, unpublished manuscript submitted to the Campbell collaboration
Johnson SD, Tilley N, Bowers KJ (2015) Introducing EMMIE: an evidence rating scale to encourage mixed-method crime prevention synthesis reviews. J Exp Criminol 11:459–473
Kennedy L, Caplan J, Piza E (2015) A multi-jurisdictional test of risk terrain modeling and a place-based evaluation of environmental risk-based patrol deployment strategies. Rutgers University, Newark, NJ
Kochel TR, Burruss G, Weisburd D (2015) St. Louis county hot spots in residential areas (SCHIRA) final report: assessing the effects of hot spots policing strategies on police legitimacy, crime, and collective efficacy, US Department of Justice, Washington, DC
Koper CS, Lum C, Hibdon J (2015) The uses and impacts of mobile computing technology in hot spots policing. Eval Rev 39:587–624
Koper CS, Taylor BG, Woods DJ (2013) A randomized test of initial and residual deterrence from directed patrols and use of license plate readers at crime hot spots. J Exp Criminol 9:213–244
Lipsey MW (1990) Design sensitivity: statistical power for experimental research. Sage Publications, Thousand Oaks, CA
Lipsey MW (2000) Statistical conclusion validity for intervention research: a significant (p < .05) problem. In: Bickman L (ed) Validity and social experimentation: Donald Campbell’s legacy. Sage Publications, Thousand Oaks, pp 101–120
Lipsey M, Wilson DB (2001) Practical meta-analysis. Sage Publications, Thousand Oaks, CA
Lum C, Hibdon J, Cave B, Koper CS, Merola L (2011) License plate reader (LPR) police patrols in crime hot spots: an experimental evaluation in two adjacent jurisdictions. J Exp Criminol 7:321–345
Manning M, Johnson SD, Tilley N, Wong GT, Vorsina M (2016) Economic analysis and efficiency in policing, criminal justice and crime reduction: What works? Springer, New York
Marklund F, Holmberg S (2015) Camera monitoring in Stureplan and civic square: full report. Brå, Stockholm, Sweden
Marklund F, Merenius S (2014) Policing crime “hot spots”: results and experiences from two projects against personal abuse and abuse. Brå, Stockholm, Sweden
Martinez NN (2013) Team policing revisited: a quasi-experimental evaluation in Las Vegas. University of Nevada, Las Vegas, NV, Nevada
Mazeika DM (2014) General and specific displacement effects of police crackdowns: criminal events and “local” criminals, Ph.D. diss., University of Maryland, College Park, MD
Mazerolle L, Price J, Roehl J (2000) Civil remedies and drug control: a randomized field trial in Oakland, California. Eval Rev 24:212–241
Nagin DS, Sampson RJ (2019) The real gold standard: measuring counterfactual worlds that matter most to social science and policy. Ann Rev Criminol 2:123–145
Phillips SW, Wheeler A, Kim D (2016) The effect of police paramilitary unit raids on crime at micro-places in Buffalo, New York. Int J Police Sci Mgmt 18:206–219
Piza E, Caplan JM, Kennedy LW, Gilchrist AM (2015) The effects of merging proactive CCTV monitoring with directed police patrol: a randomized controlled trial. J Exp Criminol 11:43–69
Piza E, O’Hara BA (2014) Saturation foot-patrol in a high-violence area: a quasi-experimental evaluation. Just Q 31:693–718
Ratcliffe JH, Breen C (2011) Crime diffusion and displacement: measuring the side effects of police operations. Prof Geograph 63:230–243
Ratcliffe J, Taniguchi T, Groff E, Wood J (2011) The Philadelphia foot patrol experiment: a randomized controlled trial of police patrol effectiveness in violent crime hot spots. Criminology 49:795–831
Ratcliffe J, Taylor RB, Askey AP, Thomas K, Grasso J, Bethel K (2020) The Philadelphia predictive policing experiment. J Exp Criminol. https://doi.org/10.1007/s11292-019-09400-2
Reppetto T (1976) Crime prevention and the displacement phenomenon. Crime Delinq 22:166–177
Rosenfeld R, Deckard MJ, Blackburn E (2014) The effects of directed patrol and self-initiated enforcement on firearm violence: a randomized controlled study of hot spot policing. Criminology 52:428–449
Rosenthal R (1994) Parametric measures of effect size. In: Cooper H, Hedges LV (eds) The handbook of research synthesis. Russell Sage Foundation, New York, pp 231–244
Rossi PH (1987) The iron law of evaluation and other metallic rules. Res Soc Prob Publ Pol 4:3–20
Rydberg J, McGarrell EF, Norris A, Circo G (2017) Applying synthetic control to evaluate the impact of data driven approaches to crime and traffic safety on violent crime, unpublished manuscript
Santos RB, Santos RG (2016) Offender-focused police intervention in residential burglary and theft from vehicle hot spots: a partially blocked randomized control trial. J Exp Criminol 12:373–402
Santos RG, Santos RB (2015) An ex post facto evaluation of tactical police response in residential theft from vehicle micro-time hot spots. J Quant Criminol 31:679–698
Sedelmaier CM, Hipple NK (2016) New Haven, Connecticut Smart Policing Initiative: employing evidence-based policing strategies to engage the community and reduce crime. US Bureau of Justice Assistance, Washington, DC
Shadish WR, Cook TD, Campbell DT (2002) Experimental and quasi-experimental designs for generalized causal inference. Wadsworth Cengage Learning, Belmont, CA
Shadish WR, Ragsdale K (1996) Random versus nonrandom assignment in controlled experiments: Do you get the same answer? J Consult Clin Psychol 64:1290–1305
Sherman L, Buerger M, Gartin P (1989) Beyond dial-a-cop: a randomized test of repeat call policing (RECAP). Crime Control Institute, Washington, DC
Sherman L, Gartin P, Buerger M (1989) Hot spots of predatory crime: routine activities and the criminology of place. Criminology 27:27–56
Sherman L, Rogan D (1995a) Deterrent effects of police raids on crack houses: a randomized controlled experiment. Just Q 12:755–782
Sherman L, Rogan D (1995b) Effects of gun seizures on gun violence: ‘Hot spots’ patrol in Kansas City. Just Q 12:673–694
Sherman L, Weisburd D (1995) General deterrent effects of police patrol in crime hot spots: a randomized controlled trial. Just Q 12:625–648
Sherman L, Williams S, Ariel B, Strang LR, Wain N, Slothower M, Norton A (2014) TTPS hotspot experiment: Murder, wounding, shooting data graphs. Unpublished report
Sorg ET (2015) An ex post facto evaluation of the Philadelphia GunStat model, Ph.D. diss., Temple University, Philadelphia, PA
Sviridoff M, Sadd S, Curtis R, Grinc R (1992) The neighborhood effects of street-level drug enforcement: tactical narcotics teams in New York. Vera Institute of Justice, New York
Taylor B, Koper C, Woods D (2011) A randomized controlled trial of different policing strategies at hot spots of violent crime. J Exp Criminol 7:149–181
Telep CW, Mitchell RJ, Weisburd D (2014) How much time should the police spend at crime hot spots? Answers from a police agency directed randomized field trial in Sacramento, California. Just Q 31:905–933
Weisburd D, Braga AA (2019) Hot spots policing as a model for police innovation. In: Weisburd D, Braga AA (eds) Police innovation: Contrasting perspectives, 2nd edn. Cambridge University Press, New York, pp 291–313
Weisburd D, Bushway S, Lum C, Yang S (2004) Trajectories of crime at places: a longitudinal study of street segments in the city of Seattle. Criminology 42:283–321
Weisburd D, Green L (1995) Policing drug hot Spots: the Jersey City DMA experiment. Just Q 12:711–736
Weisburd D, Eck J, Braga A, Telep C, Cave B et al (2016) Place matters: criminology for the 21st century. Cambridge University Press, New York
Weisburd D, Hinkle JC, Famega C, Ready J (2012) Legitimacy, fear and collective efficacy in crime hot spots: assessing the impacts of broken windows policing strategies on citizen attitudes. US National Institute of Justice, Washington, DC
Weisburd D, Lum C (2005) The diffusion of computerized crime mapping in policing: linking research and practice. Police Prac Res 6:419–434
Weisburd D, Lum C, Petrosino A (2001) Does research design affect study outcomes in criminal justice? Annals 578:50–70
Weisburd D, Majmundar MK (eds) (2018) Proactive policing: effects on crime and communities, Committee on proactive policing, National Academies Press, Washington, DC
Weisburd D, Mastrofski S, McNally AM, Greenspan R, Willis J (2003) Reforming to preserve: compstat and strategic problem solving in American policing. Criminol Publ Pol 2:421–456
Weisburd D, Wyckoff L, Ready J, Eck J, Hinkle J, Gajewski F (2006) Does crime just move around the corner? A controlled study of spatial displacement and diffusion of crime control benefits. Criminology 44:549–592
Welsh B, Farrington D (2002) Crime prevention effects of closed circuit television: a systematic review. Home Office, London
Welsh B, Peel M, Farrington D, Elffers H, Braga A (2011) Research design influence on study outcomes in crime and justice: a partial replication with public area surveillance. J Exp Criminol 7:183–198
Wheeler AP, Phillips SW (2018) A quasi-experimental evaluation using roadblocks and automatic license plate readers to reduce crime in Buffalo. NY Sec J 31:190–207
Williams SA (2015) Do visits or time spent in hot spots patrol matter most? A randomized control trial in the West Midlands Police. Fitzwilliam College, Cambridge
Wilson DB (2001) Meta-analytic methods for criminology. Annals 578:71–89
Wilson, D. B. (2020). The relative incident rate ratio effect size for count-based impact evaluations: When an odds ratio is not an odds ratio, unpublished manuscript.
Author information
Affiliations
School of Criminology and Criminal Justice, Northeastern University, 204 Churchill Hall, 360 Huntington Avenue, Boston, MA, 02115, USA
Anthony A. Braga
Institute of Criminology, Hebrew University Law School, Jerusalem, Israel
David L. Weisburd
Department of Criminology, Law and Society, George Mason University, Fairfax, VA, USA
David L. Weisburd
Corresponding author
Correspondence to Anthony A. Braga.
Additional information
Publisher's Note
Springer Nature remains neutral with regard to jurisdictional claims in published maps and institutional affiliations.
Rights and permissions
About this article
Cite this article
Braga, A.A., Weisburd, D.L. Does Hot Spots Policing Have Meaningful Impacts on Crime? Findings from An Alternative Approach to Estimating Effect Sizes from Place-Based Program Evaluations. J Quant Criminol (2020). https://doi.org/10.1007/s10940-020-09481-7
Accepted23 October 2020
Published04 November 2020
Share this article
Anyone you share the following link with will be able to read this content:
Provided by the Springer Nature SharedIt content-sharing initiative
Keywords
- Hot spots policing
- Meta-analysis
- Effect size
- Cohen’s d
- Log RIRR
Recommend
About Joyk
Aggregate valuable and interesting links.
Joyk means Joy of geeK