

Trauma Center Drive Time Distances and Fatal Outcomes among Gunshot Wound Victim...
source link: https://link.springer.com/article/10.1007/s12061-020-09362-3
Go to the source link to view the article. You can view the picture content, updated content and better typesetting reading experience. If the link is broken, please click the button below to view the snapshot at that time.
Abstract
Despite nation-wide decreases in crime, urban gun violence remains a serious and pressing issue in many cities. Victim survival in these incidents is often contingent on the speed and quality of care provided. Increasingly, new research has identified the role that specialized trauma care plays in victim survival from firearm-related injuries. Using nearly four years of data on shooting victimizations in Philadelphia we test whether distance to the nearest level 1 trauma center is associated with victim survival. We employ different distance measures based on straight-line Euclidian distance, street network distances, and drive-time estimates—comparing the predictive accuracy of each. Our results find that victims who are shot farther from trauma centers have an increased likelihood of death, and drive time distances provide the most accurate predictions. We discuss the practical implications of this research as it applies to urban public health.
Introduction
The costs of gun violence are well documented. In 2016 alone, over 38,000 Americans died of gun-related injuries (Vlahov 2018). Setting aside suicides, 15,549 individuals were killed by firearms in 2017. While firearm-related deaths represent a nation-wide problem, urban gun violence reflects the convergence of poverty, racial segregation, and weapon availability (Friedson and Sharkey 2015; Roberto et al. 2018). Urban areas disproportionately contribute to the overall number of firearm deaths and subsequently are the focus of many gun violence prevention initiatives (Braga et al. 2010). While law enforcement is concerned with preventing and apprehending individuals involved in gun violence, the treatment of victims is of equal importance. Indeed, access to medical care is critical among those who are injured in violent incidents – with the first 24 h often seen as especially important (Kellermann 2004). Improved medical care has meant that victim survival from even severe firearm injuries is no longer automatically fatal (Joseph et al. 2014; Manley et al. 2018). Consequently, access to medical care—such as specialized trauma care—is an important factor in victim survival. Our paper focuses on this particular question: that is, the role that level 1 trauma centers play in the “chain of survival” for victims with gunshot wounds (Nicholl, 1999). To answer this question, we analyze shooting victimization data from Philadelphia, PA between 2015 and 2019 on 5,580 individuals. Our analysis addresses two primary questions:
1.
Is victim survival associated with distance to the nearest level 1 trauma center?
2.
Does the estimate of survival depend on the type of distance measure?
While the first question has been addressed both directly and indirectly in several studies (e.g.: Crandall et al. 2013; Seamon et al. 2007; Beard et al. 2019; Circo 2019), the second question focuses on a more specific concern. Most prior studies have relied on straight-line, “as the crow flies” distance from the site of the victimization to the nearest trauma center (aka Euclidean distance). This measure potentially ignores several important factors related to transit time, including the distribution of the road network, road speeds, and time-varying traffic levels (Caniglia et al. 2019). To test this, we utilize data from the Google distance matrix API which allows the estimation of real-world drive times over road networks. We contrast our model estimates using network drive time, network distance, and Euclidean distance as it pertains to predictive accuracy and model coefficients. We find distance to the nearest level 1 trauma center is inversely related to victim survival, with victims who are shot farther from trauma centers having a higher probability of death. When comparing models, we find that network drive time provides more accurate predictions compared to distance-only measures. In our results section we discuss the implications of this study as it pertains to urban gun violence and the optimal distribution of critical health care.
Urban Gun Violence, Trauma Centers, and Victim Survival
Urban gun violence represents both a public safety and public health problem costing cites and municipalities hundreds of millions of dollars each year (Cook and Ludwig 2000). Treating a single gunshot wound victim can cost upwards of $45,000, not including post-treatment (Bartlett 2003). Beyond the simple monetary cost of gun violence is the substantial personal cost of physical injury and death of the victim, along with the negative impact to communities – the value of which is difficult to quantify. While the primary goal of police and public health officials should be the prevention of gun violence before it happens, a secondary goal should be the minimization of harm after it occurs (Nicholl 1999; Kellermann 2004). Crucial among these is access to timely medical care immediately after being shot (Kellermann 2004). In urban areas, hospitals with specialized medical staff and facilities play an important role in victim survival. Level 1 trauma centers represent the highest level of care available for victims with traumatic injuries. These locations must meet a number of requirements including: 24-h coverage by surgeons and specialists, providing prevention to local communities, and treating a minimum number of severely injured patients each year (American Trauma Society 2019). In cases of critical injuries, such as gunshot wounds, level 1 trauma centers are the preferred patient destination (Hameed et al. 2010; Lale et al. 2017). A nationwide study found that patients treated at hospitals with level 1 trauma centers had lower in-hospital mortality rates than similar patients at non-trauma center hospitals (MacKenzie et al. 2006). Therefore, access to these facilities among gunshot wound victims is especially important.
In urban areas gun violence is generally stably concentrated in a small number of neighborhoods (Braga et al. 2010). These areas disproportionately contribute to overall levels of violence, and generate a disproportionate number of victims as well (Braga et al. 2008). The question, therefore, is whether the distribution of hospitals with level 1 trauma facilities impacts victim survival – taking into consideration the spatial dynamics of urban areas. If victim survival is, indeed, contingent on the time to the nearest trauma center, then disparities in outcomes might be spatially concentrated (Wandling et al. 2016). A number of studies have examined this exact question, both directly and indirectly. For example, a study of gunshot wound injuries among victims in Chicago found evidence of so-called “trauma deserts” (Crandall et al. 2013). These ‘deserts’ represented neighborhoods in the city which were more than five miles away from the nearest trauma center. Victims in these areas had an increased risk of death by about 23% compared to those who were not more than five miles away. Many of these underserved areas were distributed on Chicago’s South-East side, suggesting a need for increased access (Wandling et al. 2016). A further follow-up study in Chicago found that nearly 30% of gunshot wound victims were treated in a non-designated trauma center—which the authors classified as “under-triage” (Lale et al. 2017). This research suggested that lack of access to appropriate care could lead to worse outcomes among victims.
A limited number of other analyses have examined the effect of distance to trauma centers on gunshot wound mortality. Among two studies in Detroit, one found that much of the variation in trauma patient outcomes was related to the hospital at which the victim was treated, and not neighborhood-level risk factors (Sall et al. 2018). Here, the authors highlighted the geographical differences in treatment outcomes based on access to hospital care. Another study by Circo (2019) examined the distribution of gunshot wound mortality among neighborhoods in Detroit. This study found that clusters of census blocks nearest to trauma centers had significantly lower rates of deaths from gunshot wounds. However, the data in this study was not sufficient to disaggregate to the individual-level. A Philadelphia-based study examining firearm injury intake at trauma centers found that clustered arrivals (gunshot wound victims arriving within 15 min of each other) were relatively common (Beard et al. 2019). While mass shootings gain significant notoriety in the media, this study highlighted the victim burden which trauma centers routinely face. In general, this small collection of studies highlight two concerns: the volume of gun violence in some urban areas, and the challenges of providing adequate treatment.
At the incident level, several studies have elaborated covariates regarding victim survival in shootings. Variables such as age and incident location are important – with older victims and victims shot indoors more likely to die of their injuries, or suffer more serious injuries (Grommon and Rydberg 2015; Braga and Cook 2018). For obvious reasons, victims who are struck in less critical body areas (such as the arms, legs, or other extremities) are less likely to die of their injuries than those who are struck in the torso or head. While trauma care for gunshot wound injuries has improved, victims who are struck in the head die upwards of 50—80% of the time (Joseph et al. 2014). Because shootings that take place outdoors often involve victims and offenders who are farther apart, the probability of a fatal wound is lessened somewhat (Braga and Cook 2018). Therefore, the characteristics of the incident (such as a drive-by shooting versus a domestic violence shooting) are likely to affect the victim’s outcome. These differences may greatly sway the probability of survival, so adjusting for these covariates is important when isolating the impact of other effects – such as hospital transport time. A number of municipalities (including Philadelphia) maintain open-source databases containing individual-level data on shooting victims, including the circumstances of the incident, and the victims’ characteristics. Applying this type of data stands to improve what is known about gun violence and factors which lead to victim survival or death –both at the incident and neighborhood-level.
Data and Methods
The primary data for analysis are open-data reports of criminal shooting victims in Philadelphia from 1/1/2015 through 6/20/2019.Footnote 1 This data is compiled and maintained by the Philadelphia Police Department (PPD) and contains basic victim (age, sex, race) and incident-level information (such as the time and date the incident occurred). From this dataset we obtain whether the shooting victim ultimately died based on the incident report, as well as the geographic location of the incident (aggregated to the center of the street segment to provide some anonymity). Because these data reflect criminal shootings, they do not contain suicides or self-inflicted injuries. We also omit from analysis all officer-involved shootings. One limitation of this data is that it does not allow us to distinguish shootings where the victim was immediately killed, or ultimately died en-route or at the hospital. However, given the injury location data we are able to distinguish injuries that are much more likely to be fatal, regardless of transport time.
The main independent variables of interest are estimates of distances to the nearest level 1 trauma center. These are calculated, and models are compared for three different measures: Euclidean 'as the crow flies' distance between shootings and hospitals, street road network distance, and average estimated drive times over the street network. Euclidean distances based on the spherical coordinates of the shooting location and the traumacenter are calculated using the Vincenty formula. The street network distances and drive times are calculated via the Google distance matrix API.Footnote 2 In particular, the average estimated drive times are times based on long term averages of actual drive times over those road network segments. This method is similar to other approaches used to measure drive-time distances to trauma centers. For instance, Tansley et al. (2019) estimate a cost-distance raster surface relying on the street’s posted speed limit. The Google distance matrix API instead relies on aggregated historical drive-time distances along the road networks – providing a highly plausible estimate of drive-time distance from shooting incident to trauma center. This is the same system that powers many GPS devices that millions of drivers use daily for travel (Google Maps Platform 2020). In any case, these methods rely on a more direct estimate of drive-time distance, rather than using Euclidean or street network distance as a proxy.
We suspect that drive times based on the road network are more directly pertinent to estimating the probability of death, relative to simple Euclidean metrics (Crandall et al. 2013; Circo 2019). In many cases hospitals have closer drive times but further away Euclidean or street network distances. We calculate all three metrics in reference from each shooting to each hospital, and then model the closest of each measure for an individual model. Hence, we estimate three separate models using either Euclidean distance, street network distance, or drive time as an independent variable. After fitting the models, we compare them using measures of overall model fit and out-of-sample performance (AIC, BIC, and leave-one-out cross validation).
Although it would be preferable to directly have ambulance response times (e.g. Crandall et al. 2013), we suspect that the drive times should provide similar marginal effect estimates (e.g. the effect of being 1 min further away on the road network should closely translate to 1 min longer total response-to-hospital times for ambulances). But ambulances can be dispatched from a wide variety of locations (not just hospitals, but also private locations), and potentially have delays in dispatch (e.g. due to all ambulances being busy). Additionally, further factors on the scene of the shooting may prevent a speedy transport (e.g. an active shooting situation could prevent medical personnel from accessing the victim). While we cannot be certain, our estimates are largely consistent with other studies estimating travel time to trauma centers (Amram et al. 2011; Tansley et. al. 2019), suggesting our estimates are not biased by this omitted variable. There are a total of five non-pediatric level 1 trauma centers within Philadelphia. While victims may be sent to pediatric trauma centers or to other hospitals without trauma centers, it appears to be a much lower frequency than the non-pediatric centers in Philadelphia (Beard et al. 2019). Figure 1 displays the locations of those trauma centers relative to major streets and avenues in Philadelphia, while Fig. 2 displays map illustrating the spatial distribution of shootings with a victim. Temple hospital is closest to the densest area of shootings, with a hexagon grid of over 200 victimizations over the three and a half year period—around 3 km away.
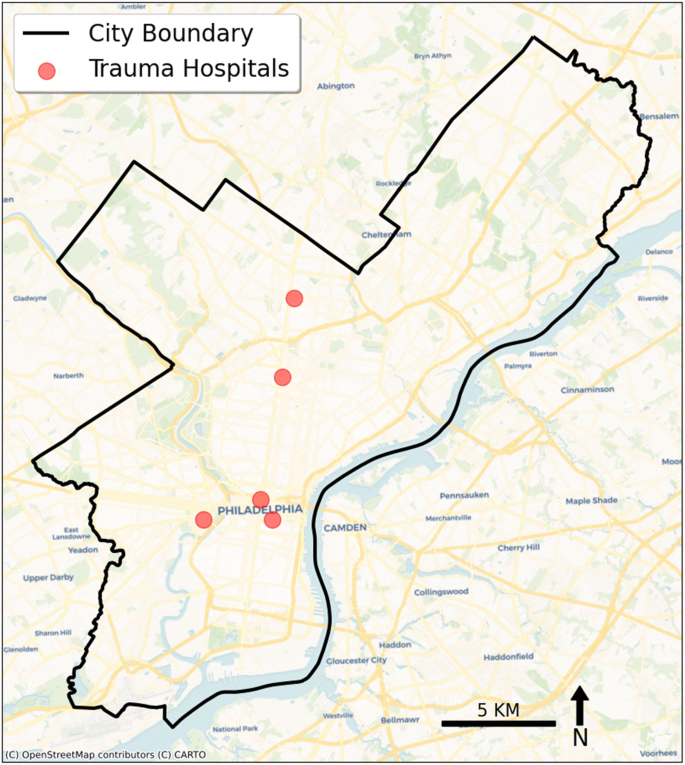
Location of Level 1 Trauma Centers, Philadelphia
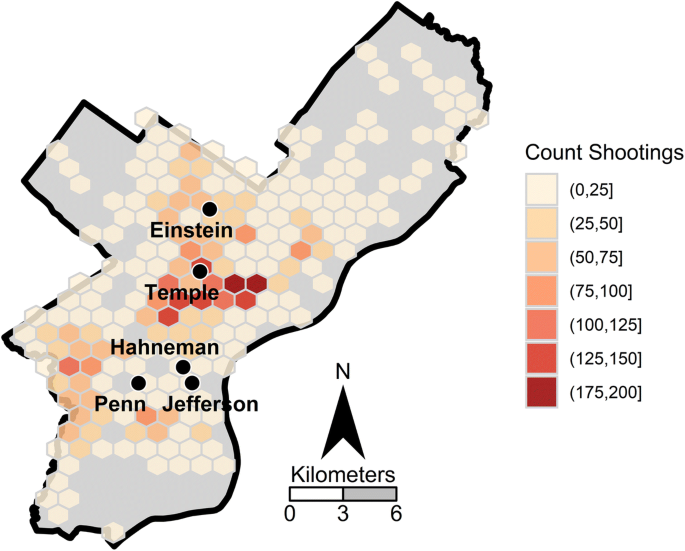
Count of Shooting Victims and Trauma Centers (1/1/2015 - 6/20/2019)
Another important factor included in the model are the locations of where an individual was shot on their body. Wound locations are recorded as a plain text field in the Philadelphia shooting victim dataset, and we recoded those fields into the final wound locations of head, torso, extremities, or multiple wound locations (Grommon and Rydberg 2015). The other independent variables of interest that are available in the model include the age of the victim, the sex of the victim, the race of the victim, and whether the shooting occurred outdoors. The age of the victim has obvious implications for the probability of survival, but the other demographic factors may also be associated with the nature of the shooting incident (Hipple and Magee 2017). Subsequently they are potentially important to control for to prevent confounds when examining other factors (Wiebe 2003). Finally, we calculated the number of clustered arrivals as the number of shootings within the prior 15 min and being closest to the same hospital based on drive time distances (Beard et al. 2019).
Table 1 displays descriptive statistics for the variables used in the analysis. The original shooting dataset contained 5,740 cases, of which we eliminated 160 for analysis (less than 3% of the total sample). These were mostly due to missing spatial locations where the shootings took place (n = 73), as well as cases that were missing data on wound location (n = 56), age (n = 30), sex (n = 4), or race (n = 4). Our final dataset contained 5,580 cases.
The model we estimate is a logistic regression model, predicting the probability of a death subsequent to the shooting based on the distance to the nearest level 1 trauma center, along with the other independent variables previously listed. Our equation predicting the probability of death, p, can be written as:
{\beta }_{1} is then the main effect of interest, and we estimate this same model using three different distance metrics (drive time, street network distance, and Euclidean distance). We subsequently evaluate the fit of those three different measures using the AIC and BIC statistics, as well as leave-one-out cross validation error estimates (Harrell 2001). We use the deviance residuals from each model to estimate measures of spatial autocorrelation. Evidence of moderate to high correlation would indicate possible omitted variable bias and suggest the inclusion of additional variables.
Additional control variables are coefficients {\beta }_{2} through {\beta }_{9}, adjusting for wound location, shooting location, clustered hospital arrivals, and victims’ race, sex, and age. For the categorical variable of wound location, we use wounds to the head as the referent category, with dummy variables representing wounds to the torso, extremities, or multiple locations. We also include dummy variables for being a male, being white, and a linear effect for age. The continuous variables of age and distance are mean centered before being estimated, which only impacts the interpretation of the intercept term, {\beta }_{0}. We also test for possible interactions by including a term for injury location on distance to nearest trauma center for each model. In respect to model parsimony, we only include interactions if they yield an improvement in overall model fit.
Results
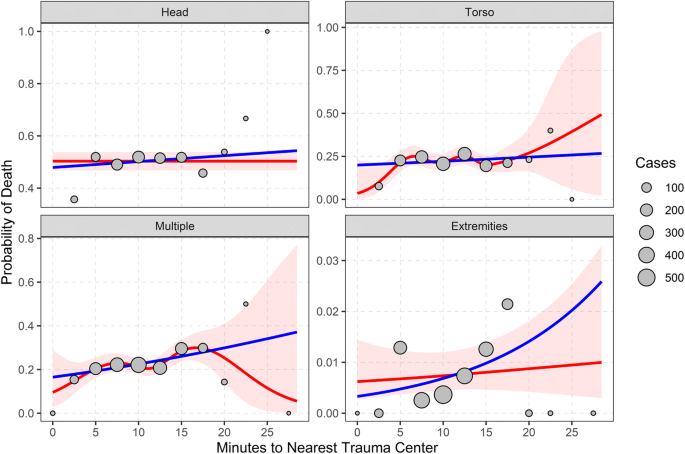
Figure 2 displays the marginal effects of distance to the nearest level 1 trauma center (in terms of estimated travel time on the road network), broken down by individual wound locations. The blue line shows the fit of the simple logistic model, and the red line (and pink 95% confidence interval error bars around the mean), show the non-linear fit based on a generalized additive model (GAM). Here, the value of a GAM is the ability to model the relationship as a smoothed, potentially non-linear fit. GAMs allow for the estimation of non-linear relationships using a variety of smoothing techniques (such as thin-plate regression or B-splines). Commonly these are modeled as piecewise polynomials where “kinks”, or changes in the relationship, meet in knots (Wood 2017). Estimates from a non-linear GAM can be compared to a more conventional linear fit to determine the tradeoff of increasing model complexity. In this case we might suspect that drive-time distances have a leveling-off effect (where the probability of death increases up to a certain point, then remains stable), rather than a linear relationship. The grey circles show the actual data, binned to every 2.5 min and plotted at the mean number of fatalities, with bigger circles illustrating a larger number of cases. The motivation for this plot was to determine if travel time had a non-linear effect on the probability of death (Harrell 2001), as well as potential interactions depending on the severity of the wound. For example, the probability of death may increase up to 5 min away, and then flatten off. Such a pattern could occur if cases had a polarized distribution, with a proportion of cases where time does not matter at all, and others where only a very short response would have prevented a fatality.
While the non-linear red line fluctuates in several of the sub-panels, the error bars around the non-linear effect always contain the linear fit estimate. Based on this exploratory data analysis, there is little evidence of non-linear effects based on the travel time to the nearest level 1 trauma center (plots based on the other distances yielded similar conclusions). Therefore, subsequent logistic regression models predicting the probability of death include only linear terms.
Table 2 displays the results of the logistic regression equations, showing models that swap the ultimate distance term of interest. Model 1 uses the drive time estimates, Model 2 uses street network distances, and Model 3 uses Euclidean 'as the crow flies' distance. All three models produce a similar interpretation, with those shootings further away resulting in an increased probability of death. Additionally the models show that having a wound location in the torso, extremities, or multiple locations have a much lower probability of death, relative to the referent category of being shot in the head. Additionally being older results in a higher probability of death, and being shot outside results in a lower probability of death. Although these effects are smaller in magnitude relative to the wound location. The effect of clustered events has a negative coefficient, replicating the finding of decreased mortality in Beard et al. (2019), but is not significant (p = 0.114). Being male also results in a marginally significant increase in mortality (p = 0.049). Race does not have a significant effect on the probability of death (p = 0.25).
Based on the large direct effects of wound location, we also examined the interactions between the wound location and the drive time distance. Those interaction effects were not individually statistically significant, and they produced overall a worse fit compared to the model without interactions. As such we only report the models without those interaction effects. For the drive time distance model, we also examined the spatial autocorrelation of the deviance residuals. Using a row normalized inverse distance weighted matrix, with events at the same location calculated as a distance of 1, we calculated global Moran's I (Anselin 1995). The overall estimate of the spatial auto-correlation was less than 0.01, with a p-value of 0.022 based on 999 permutations (Anselin 1995). While the p-value indicated a statistically significant difference from 0, the very low level of auto-correlation suggests it is unlikely to greatly impact the results. Subsequently there is no reason to believe the model results are biased due to other unaccounted for spatial factors.
A key question of our study was the comparison of three different distance measures. As stated before, most prior research relies on straight-line Euclidean distance from the incident location to the hospital. Our aim was to determine whether estimating distances along the street network (network distance) or using historical estimates of drive time (network time) was superior to straight line distances. Conceptually, network distance or network time is a more internally valid measure because it reflects real-world limitations of travel (i.e. based on roads, natural barriers, etc.). We used three estimates of approximate out-of-sample performance: Akaike information criterion (AIC), Bayesian information criterion (BIC), and leave-one-out cross validated error (CVE). AIC is an information criterion which provides an estimate of out-of-sample deviance, while BIC attempts to identify the “true” model using the model’s average likelihood (Burnham and Anderson 2004). In practice, both AIC and BIC tend to come to similar results when the sample size n is much larger than the number of parameters k. Leave-one-out CVE is a common method used to estimate out-of-sample performance by iteratively dropping one observation, then using the remaining data to make a prediction for that single point. This process is repeated n times yielding an estimate of out-of-sample predictive error for the model (Harrell 2001).
Using these model comparison criterion we identified that Model 1, using network time, provided a marginally better fit than both network distance or Euclidean distance for all three model fit statistics (AIC = 4071.4, BIC = 4137.6, CVE = 0.11979). This provides evidence that modeling the spatial dynamics of urban street networks is an improvement over more simple straight-line distances. The estimated effect of one minute of travel along the street network was an increased likelihood of death by approximately 2% (β = 0.022, p = 0.026). In contrast, the estimated effect for one kilometer of travel along the street network was 3% (β = 0.030, p = 0.067) and 4% for Euclidean distance (β = 0.042, p = 0.046). Based on model fit statistics we focus the remainder of our results derived from Model 1.
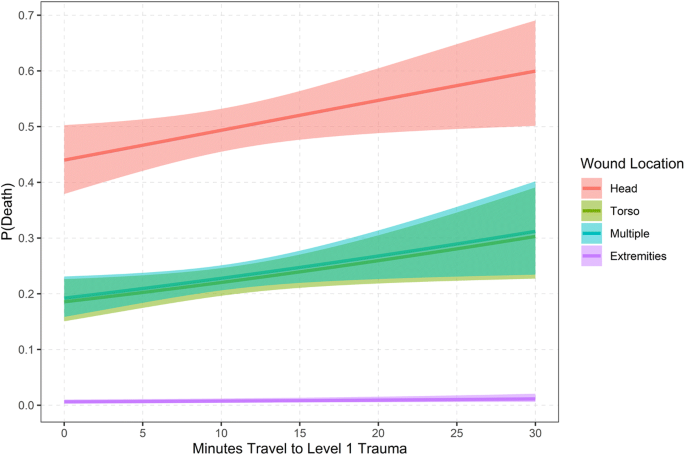
Figure 3 displays the marginal effects of being further away in drive time distance, broken down by each wound location type. The bands around each prediction plot the pairwise 95% confidence interval of those mean predictions. These predictions are also generated by setting the sex to male, age to 28.7, the location to outside, and the race to Black (either the modal categories or the means). Being shot in the extremities always produces a low probability of death, while being shot in the head is the highest. In cases of more serious wounds, the marginal effects of being near a level 1 trauma center matter more. For example, the probability of death when being shot in the head is just 0.49 when the travel time distance is 10 min, whereas it is 0.54 when the travel time is 20 min. Constructing the same contrast for wounds in the torso, one goes from a probability of 0.22 to 0.26. Wounds to multiple locations result in very similar predicted probabilities of deaths to those in the torso.
Marginal Effects of Travel Time on Probability of Death
Figure 4 displays a map showing the predicted probability changes based on estimated travel time distances on a regular grid over the city for wounds to the torso. (Other variables are held at the same constants as those in Fig. 3) The brighter areas indicate bands very nearby the hospital in terms of drive times. Cross referencing this with the prior map showing the distribution of shootings, it appears those being shot in the west and southwest Philadelphia neighborhoods are not as well situated in terms of drive times to level 1 centers, compared to the hot spot of shootings in the more eastern/central areas of the city (closer to the Kensington neighborhood). Depending on the where you are located when you are shot, it can sway the predicted probability of death by 14 percentage points in this example. For instance, as shown in Fig. 5, in some of the northern parts of Philadelphia the predicted probability of a fatality is over 32%, whereas the same incident nearby a hospital in central Philadelphia only has an 18% probability of fatality.
Predicted Probability of Death, by Travel Time and Wound Location
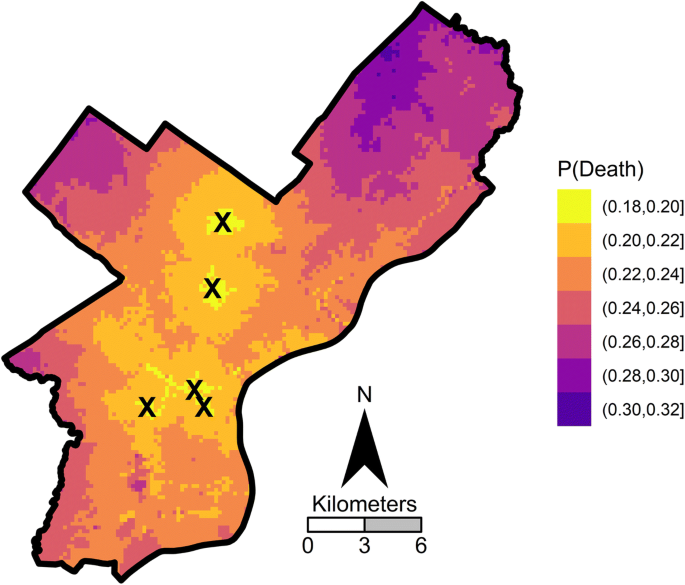
Isochrone Map Surface, Predicted Probability of Death by Estimated Drive Time
Conclusion
Based on prior research we expected to find some evidence linking the distance to a trauma center with victim survival (Crandall et al. 2013; Sall et al. 2018; Circo 2019). Indeed, a wealth of studies have illustrated the importance that specialized trauma care plays for critically injured individuals (Lale et al. 2017). With improvements in medicine, surgery, and trauma care, gunshot wound victims have increasingly better outcomes (Manley et al. 2018). However, a key link in this chain is improving victim access to care. Our study and others find that geographic disparities in access to trauma centers is likely to cause an excess number of deaths among victims who might have otherwise survived. Because addressing gun violence is a multi-faceted issue, treating victims remains one of many important issues.
We believe this study has practical policy considerations for both the city of Philadelphia and other urban centers struggling with high rates of gun-related injuries and deaths. Specifically, the results of our findings can be used in two particular ways. One is that the results can be used to inform strategies that attempt to reduce the drive time of ambulances (Chanta et al. 2011). The estimates we provide can help siting decisions for ambulances in conjunction with real-time predictions based on where shootings are likely to occur (Hosler et al. 2019). City planners may consider the cost–benefit ratio of opening an additional hospital, given the number of lives which might plausibly be saved. Aside from creating new hospitals, focusing additional resources on areas where victims are more likely to die of injuries may be an effective intermediate measure. For instance, training officers to transport victims to the hospital when emergency medical services are not available may improve victim outcomes. In fact, this “scoop-and-run” strategy has already been evaluated in Philadelphia before (Seamon et al. 2007).
Our results can also be used in model parameters if one is aiming to improve survivability among gunshot wound victims (Chanta et al. 2014). One strength of our estimates is that they can also provide counterfactual evidence for siting decisions for trauma centers themselves, such as the likely effects for either adding or subtracting a level 1 trauma center on subsequent survivability (Crandall et al. 2016). When conducting either type of siting decision, either allocating ambulances or opening or closing a level 1 trauma center, to estimate the subsequent effects one needs to have model-based estimates of how increased/decreased travel times will impact the subsequent survivability of gunshot patients. Using actual drive time estimates we believe is likely to provide more realistic estimates than those based simply on Euclidean distances. But when extrapolating in what-if type scenarios, network-based measures of drive time estimates likely provide a reasonable estimate of survivability in making future decisions about the spatial provision of emergency services.
A noted limitation is that our model estimates can only indirectly inform such an intervention, as we do not directly calculate ambulance response times, but only estimated response times based on average street network times. The Google distance matrix API currently does not allow for hourly estimates of past drive time distances, which we note as a current technological restriction. We also note that our estimates also assume rational behavior – namely, that injured victims are sent to the nearest level 1 trauma center. Limitations of this data preclude estimates of travel based on transport type (i.e. ambulance vs personal vehicle) or wait times on-scene. Similarly, because the data come from police incident reports, we are unable analyze hospital-specific variables (such as the treatment type given, or which specific hospital the victim was treated at). The data also do not permit us to determine if the victim died immediately at the scene or died later as a result of their injuries. Despite these limitations, our study provides a unique analysis of factors leading to victim survival in serious violent incidents. We should note that these estimates were produced using free, publicly-available data. Applying these research principles to open-source data allow researchers to address these questions in a timely manner. While the police incident data leave some questions unanswered, we find strong support that reducing travel time from incident location to trauma center results in decreased victim mortality. Future research should gather detailed police and medical data to address the gaps in our data, as well as in other similar studies. We believe this study, in concert with other studies, should inform decisions for trauma center siting, policies for emergency transport, and other strategies that reduce the time between injury and trauma treatment. Given the destructive nature of gun violence in many urban areas, these polices stand to both save lives, as well as money.
References
American Trauma Society. (2019). Trauma Center Levels Explained. Retrieved from: https://www.amtrauma.org/page/traumalevels?
Amram, O., Schuurman, N., & Hameed, S. M. (2011). Mass casualty modelling: a spatial tool to support triage decision making. International Journal of Health Geographics, 10(1), 40.
Anselin, L. (1995). Local indicators of spatial association—LISA. Geographical Analysis, 27(2), 93–115.
Bartlett, C. S. (2003). Clinical update: gunshot wound ballistics. Clinical Orthopaedics and Related Research®, 408, 28–57.
Beard, J. H., Resnick, S., Maher, Z., Seamon, M. J., Morrison, C. N., Sims, C. A., ... Goldberg, A. J. (2019). Clustered arrivals of firearm-injured patients in an urban trauma system: a silent epidemic. Journal of the American College of Surgeons.
Braga, A. A., Pierce, G. L., McDevitt, J., Bond, B. J., & Cronin, S. (2008). The strategic prevention of gun violence among gang‐involved offenders. Justice Quarterly, 25(1), 132–162.
Braga, A. A., Papachristos, A. V., & Hureau, D. M. (2010). The concentration and stability of gun violence at micro places in Boston, 1980–2008. Journal of Quantitative Criminology, 26(1), 33–53.
Braga, A. A., & Cook, P. J. (2018). The association of firearm caliber with likelihood of death from gunshot injury in criminal assaults. JAMA network open, 1(3), e180833–e180833.
Burnham, K. P., & Anderson, D. R. (2004). Multimodel inference: understanding AIC and BIC in model selection. Sociological methods & research, 33(2), 261–304.
Caniglia, E. C., Zash, R., Swanson, S. A., Wirth, K. E., Diseko, M., Mayondi, G., ... Kponee-Shovein, K. Z. (2019). Methodological Challenges When Studying Distance to Care as an Exposure in Health Research. American Journal of Epidemiology.
Chanta, S., Mayorga, M. E., & McLay, L. A. (2014). The minimum p-envy location problem with requirement on minimum survival rate. Computers & Industrial Engineering, 74, 228–239.
Chanta, S., Mayorga, M. E., Kurz, M. E., & McLay, L. A. (2011). The minimum p-envy location problem: a new model for equitable distribution of emergency resources. IIE Transactions on Healthcare Systems Engineering, 1(2), 101–115.
Circo, G. M. (2019). Distance to trauma centres among gunshot wound victims: identifying trauma ‘deserts’ and ‘oases’ in Detroit. Injury prevention, injuryprev-2019.
Cook, P. J., & Ludwig, J. (2000). Gun violence: The real costs. Oxford University Press on Demand.
Crandall, M., Sharp, D., Unger, E., Straus, D., Brasel, K., Hsia, R., & Esposito, T. (2013). Trauma deserts: distance from a trauma center, transport times, and mortality from gunshot wounds in Chicago. American Journal of Public Health, 103(6), 1103–1109.
Crandall, M., Sharp, D., Wei, X., Nathens, A., & Hsia, R. Y. (2016). Effects of closure of an urban level 1 trauma centre on adjacent hospitals and local injury mortality: a retrospective, observational study. British Medical Journal Open, 6(5), e011700.
Friedson, M., & Sharkey, P. (2015). Violence and neighborhood disadvantage after the crime decline. The Annals of the American Academy of Political and Social Science, 660(1), 341–358.
Google Maps Platform. (2020). Retrieved from: https://cloud.google.com/maps-platform
Grommon, E., & Rydberg, J. (2015). Elaborating the correlates of firearm injury severity: combining criminological and public health concerns. Victims & Offenders, 10(3), 318–340.
Harrell, F., Jr. (2001). Regression modelling strategies: With applications to linear models, logistic regression, and survival analysis. New York: Springer-Verlag.
Hameed, S. M., Schuurman, N., Razek, T., Boone, D., Van Heest, R., Taulu, T., ... Stelfox, H. T. (2010). Access to trauma systems in Canada. Journal of Trauma and Acute Care Surgery, 69(6), 1350–1361.
Hipple, N., & Magee, L. (2017). The difference between living and dying: victim characteristics and motive among nonfatal shootings and gun homicides. Violence and Victims, 32(6), 977–997.
Hosler, R., Liu, X., Carter, J., & Saper, M. (2019).RaspBary: Hawkes Point Process Wasserstein Barycenters as a Service. Available at https://www.researchgate.net/profile/George_Mohler/publication/327212089_Raspbary_Hawkes_Point_Process_Wasserstein_Barycenters_as_a_Service/links/5b805ab192851c1e122f57a4/Raspbary-Hawkes-Point-Process-Wasserstein-Barycenters-as-a-Service.pdf.
Joseph, B., Aziz, H., Pandit, V., Kulvatunyou, N., O’Keeffe, T., Wynne, J., ... Rhee, P. (2014). Improving survival rates after civilian gunshot wounds to the brain. Journal of the American College of Surgeons, 218(1), 58–65.
Kellermann, A. L. (2004). Treating gun violence before the 911 call. Annals of Emergency Medicine, 43(6), 743–745.
Lale, A., Krajewski, A., & Friedman, L. S. (2017). Undertriage of firearm-related injuries in a major metropolitan area. JAMA surgery, 152(5), 467–474.
MacKenzie, E. J., Rivara, F. P., Jurkovich, G. J., Nathens, A. B., Frey, K. P., Egleston, B. L., ... Scharfstein, D. O. (2006). A national evaluation of the effect of trauma-center care on mortality. New England Journal of Medicine, 354(4), 366–378.
Manley, N. R., Fabian, T. C., Sharpe, J. P., Magnotti, L. J., & Croce, M. A. (2018). Good news, bad news: an analysis of 11,294 gunshot wounds (GSWs) over two decades in a single center. Journal of Trauma and Acute Care Surgery, 84(1), 58–65.
Nicholl, J. P. (1999). Optimal use of resources for the treatment and prevention of injuries. British Medical Bulletin, 55(4), 713–725.
Roberto, E., Braga, A. A., & Papachristos, A. V. (2018). Closer to guns: the role of street gangs in facilitating access to illegal firearms. Journal of Urban Health, 95(3), 372–382.
Sall, L., Hayward, R. D., Fessler, M. M., & Edhayan, E. (2018). Between-hospital and between-neighbourhood variance in trauma outcomes: cross-sectional observational evidence from the Detroit metropolitan area. British Medical Journal Open, 8(11), e022090.
Seamon, M. J., Fisher, C. A., Gaughan, J., Lloyd, M., Bradley, K. M., Santora, T. A., ... Goldberg, A. J. (2007). Prehospital procedures before emergency department thoracotomy:“scoop and run” saves lives. Journal of Trauma and Acute Care Surgery, 63(1), 113–120.
Tansley, G., Schuurman, N., Bowes, M., Erdogan, M., Green, R., Asbridge, M., & Yanchar, N. (2019). Effect of predicted travel time to trauma care on mortality in major trauma patients in Nova Scotia. Canadian journal of surgery, 62(2), 123.
Wandling, M., Behrens, J., Hsia, R., & Crandall, M. (2016). Geographic disparities in access to urban trauma care: defining the problem and identifying a solution for gunshot wound victims in Chicago. The American Journal of Surgery, 212(4), 587–591.
Wiebe, D. J. (2003). Homicide and suicide risks associated with firearms in the home: a national case-control study. Annals of emergency medicine, 41(6), 771–782.
Wood, S. N. (2017). Generalized additive models: an introduction with R. CRC press.
Vlahov, D. (2018). Building the evidence base to prevent firearm deaths and injuries. Journal of Urban Health, 95(3), 293–294.
Author information
Affiliations
School of Criminal Justice, University of New Haven, 300 Boston Post Rd, West Haven, CT, 06516, USA
Giovanni M. Circo
School of Economic, Political, and Policy Sciences, University of Texas At Dallas, 800 West Campbell Road, GR 31, Richardson, TX, 75080-3021, USA
Andrew P. Wheeler
Corresponding author
Correspondence to Giovanni M. Circo.
Ethics declarations
Conflict of Interest
The authors declare that they have no conflict of interest.
Additional information
Publisher’s Note
Springer Nature remains neutral with regard to jurisdictional claims in published maps and institutional affiliations.
Rights and permissions
About this article
Cite this article
Circo, G.M., Wheeler, A.P. Trauma Center Drive Time Distances and Fatal Outcomes among Gunshot Wound Victims. Appl. Spatial Analysis (2020). https://doi.org/10.1007/s12061-020-09362-3
Received06 January 2020
Accepted13 September 2020
Published21 September 2020
Share this article
Anyone you share the following link with will be able to read this content:
Provided by the Springer Nature SharedIt content-sharing initiative
Keywords
- Gun-violence
- Street-network
- Emergency-response
- Fatality
Recommend
About Joyk
Aggregate valuable and interesting links.
Joyk means Joy of geeK