

【Kmeans】理论与实现
source link: https://www.guofei.site/2017/06/09/kmeans.html
Go to the source link to view the article. You can view the picture content, updated content and better typesetting reading experience. If the link is broken, please click the button below to view the snapshot at that time.
【Kmeans】理论与实现
2017年06月09日Author: Guofei
文章归类: 3-2-聚类 ,文章编号: 302
版权声明:本文作者是郭飞。转载随意,但需要标明原文链接,并通知本人
原文链接:https://www.guofei.site/2017/06/09/kmeans.html
Kmeans算法原理
Kmeans的算法原理简单但很巧妙。
算法
要把N个点分为k个类,算法过程如下:
- N个点中,随机选取k个点作为中心
- 检查所有点与这k个点之间的距离,每个点归类到最近的中心
- 计算每个新类的中心,共k个
- 如果新中心与原中心的距离之和大于某个阈值,回到2。否则算法结束
评价
优点:
复杂度为O(nkt)O(nkt),n是数据点个数,k是要分类数,t是总共的迭代次数。
因此,可以处理大量数据。
- 只能处理凸状分布的数据
- 容易局部最优
- 用户要先给出k值
- 对离群值非常敏感
Kmeans的Python实现
step1:生成模拟数据
import pandas as pd
import numpy as np
import matplotlib.pyplot as plt
data1=pd.DataFrame({'x':np.random.normal(0,1,size=50),'y':np.random.normal(0,1,size=50)})
data2=pd.DataFrame({'x':np.random.normal(0,1,size=50),'y':np.random.normal(8,1,size=50)})
data3=pd.DataFrame({'x':np.random.normal(4,1,size=50),'y':np.random.normal(4,1,size=50)})
data=pd.concat([data1,data2,data3])
step2:画图
plt.plot(data.x,data.y,'r.')
plt.show()
模拟数据是这样的: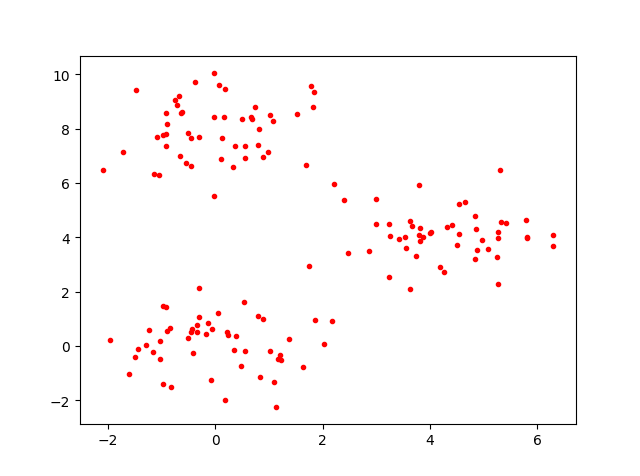
step3:聚类
from sklearn.cluster import KMeans
kmeans=KMeans(n_clusters=3)
kmeans.fit(data)
参数 解释 n_clusters 聚类的个数 max_iter 最大循环次数 n_jobs 并行计算
step4:输出聚类结果并画图
labels = kmeans.labels_#原样本所在的类
cen=kmeans.cluster_centers_#中心点
plt.plot(data.x,data.y,'r.')
plt.plot(cen[:,0],cen[:,1],'b^')
plt.show()
得到中心点的位置图: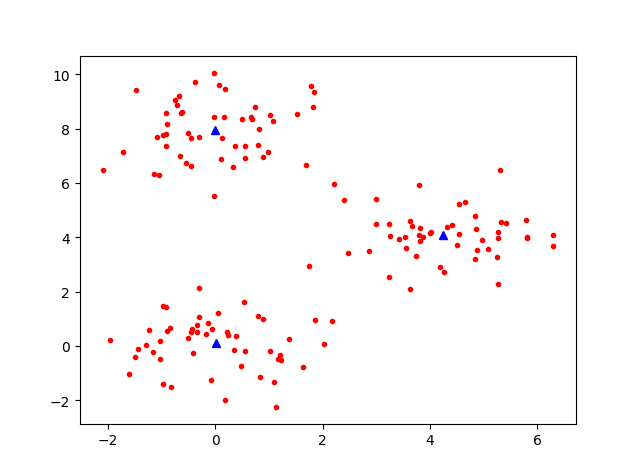
结果 解释 kmeans.cluster_centers_ 聚类的中心点 kmeans.labels_ 原样本被分配到哪个类
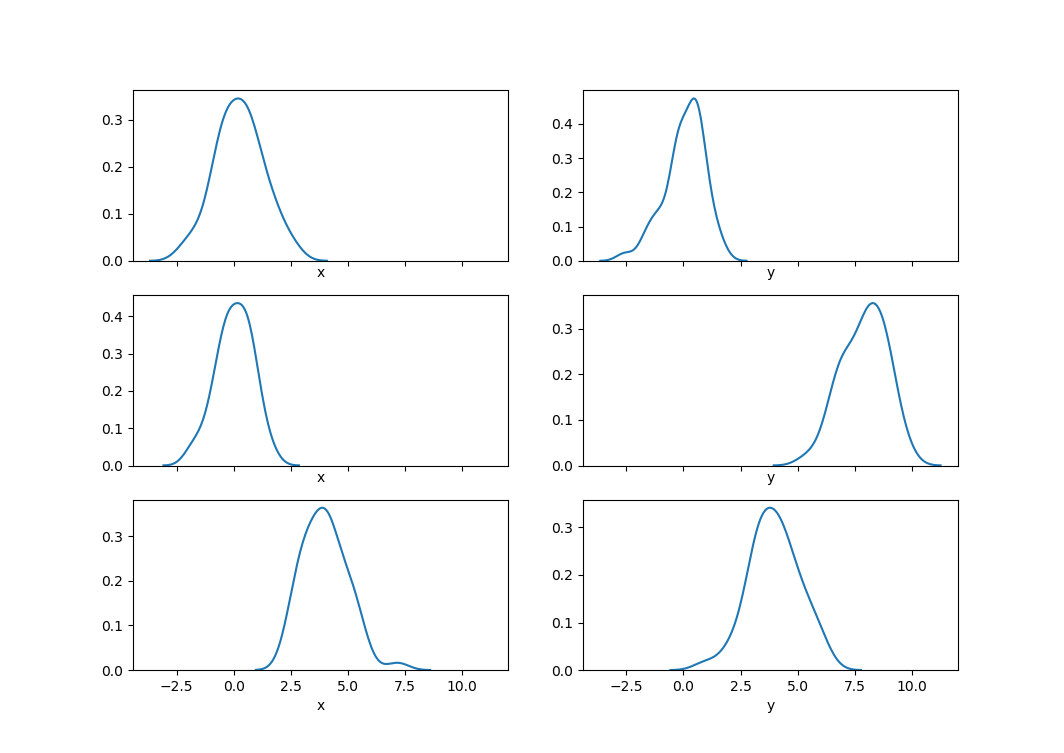
step5:画概率密度估计图
import seaborn as sns
fig,ax=plt.subplots(3,2,sharex=True)#共享x坐标的范围
sns.distplot(data.loc[labels == 0,'x'],hist=False,ax=ax[0,0])
sns.distplot(data.loc[labels == 0,'y'],hist=False,ax=ax[0,1])
sns.distplot(data.loc[labels == 1,'x'],hist=False,ax=ax[1,0])
sns.distplot(data.loc[labels == 1,'y'],hist=False,ax=ax[1,1])
sns.distplot(data.loc[labels == 2,'x'],hist=False,ax=ax[2,0])
sns.distplot(data.loc[labels == 2,'y'],hist=False,ax=ax[2,1])

plt.show()
step6:
fig2, ax2 = plt.subplots(k, 1)
for i in range(k):
    data_temp = data.loc[labels == i]
    m_temp, n_temp = data_temp.shape
    for j in range(m_temp):
        ax2[i].plot(list(data_temp.loc[i, :]))
        plt.xticks(range(n_temp), data_temp.columns)
plt.show()
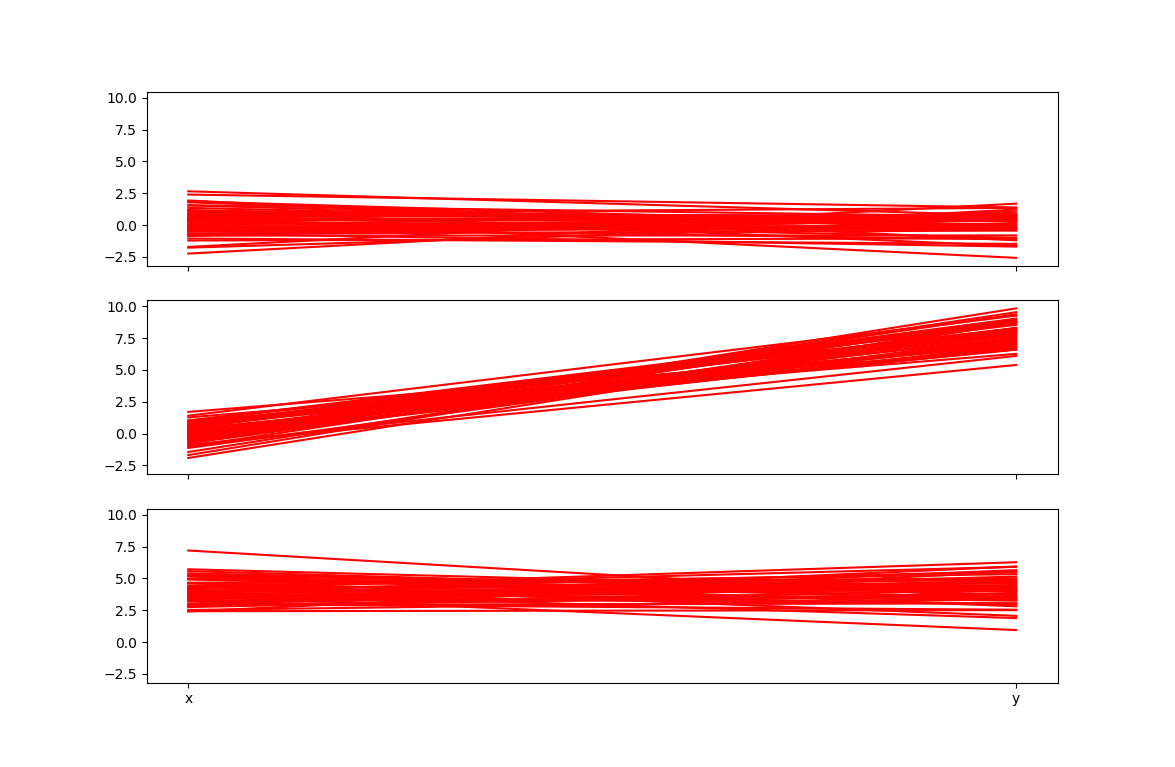
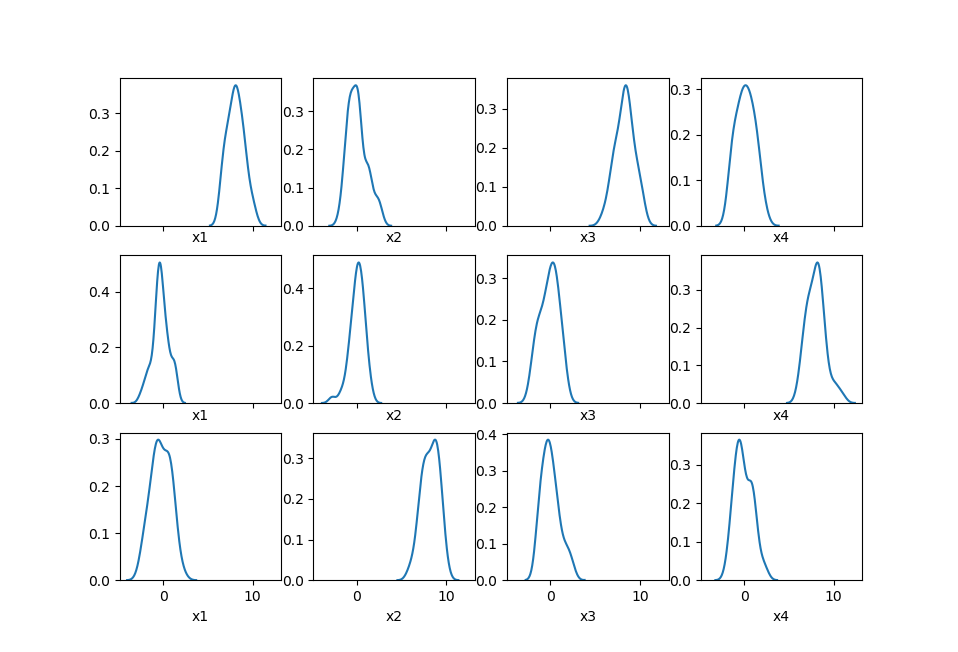
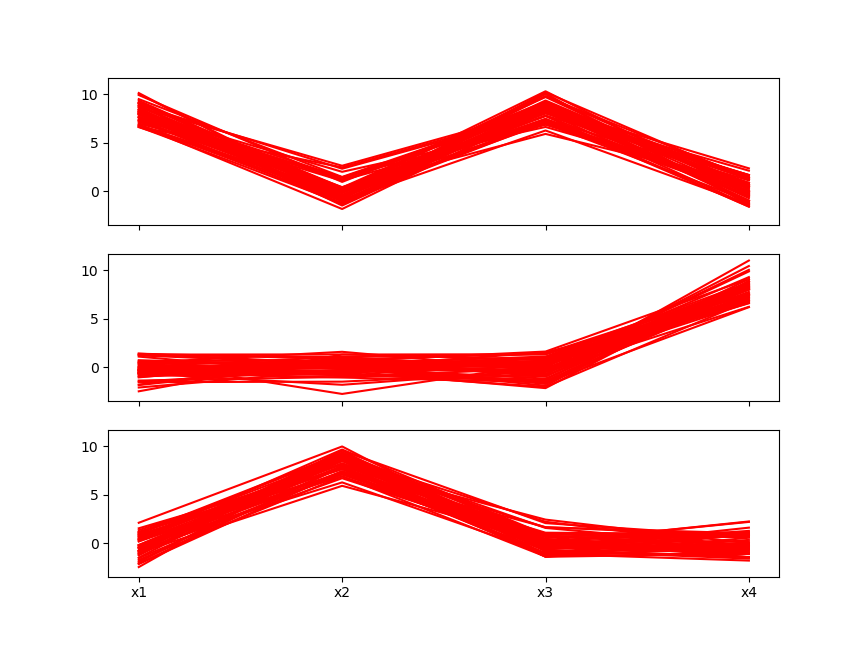
注意:对于多维的数据,散点图就不好用了,后两个图才好用
多维的kmeans案例
import pandas as pd
import numpy as np
import matplotlib.pyplot as plt

centers = [[0, 0, 0, 8], [8, 0, 8, 0], [0, 8, 0, 0]]
columns_name = ['x1', 'x2', 'x3', 'x4']
data = pd.DataFrame()
for center in centers:
    data_temp = pd.DataFrame()
    for idx, j in enumerate(center):
        data_temp = pd.concat([data_temp, pd.DataFrame({columns_name[idx]: np.random.normal(j, size=50)})], axis=1)
    data = pd.concat([data, data_temp], ignore_index=True)

m, n = data.shape
k = 3  # 要聚成这么多类

from sklearn.cluster import KMeans

kmeans = KMeans(n_clusters=k)
kmeans.fit(data)

labels = kmeans.labels_  # 原样本所在的类
center_predict = kmeans.cluster_centers_  # 中心点
print('center_predict:', center_predict)
import seaborn as sns

fig, ax = plt.subplots(k, n, sharex=True)  # 共享x坐标的范围
for i in range(k):
    for j in range(n):
        sns.distplot(data.loc[labels == i, data.columns[j]], hist=False, ax=ax[i, j])

fig2, ax2 = plt.subplots(3, 1, sharex=True,sharey=True)
for i in range(3):
    data_temp = data.loc[labels == i, :]
    m_temp, n_temp = data_temp.shape
    for j in range(m_temp):
        ax2[i].plot(list(data_temp.iloc[j, :]), color='r')
        plt.xticks(range(n_temp), data_temp.columns)
plt.show()
Kmeans的改进:二分Kmeans算法
二分Kmeans算法(Bisecting Kmeans)是在Kmeans的基础上改进的。
为介绍算法,首先引入聚类结果的一个评价指标:误差平方和
误差平方和是每个点到对应中心点的距离的平方和
SSE=∑m=1k∑pm∈Cm∑nCij=1(pij−cij)2SSE=∑m=1k∑pm∈Cm∑j=1nCi(pij−cij)2
其中,模型把数据分为k类,每个类的集合为CiCi
Bisecting Kmeans算法流程:
- 把所有点分为1个类
- 对这个类进行二分类。用Kmeans方法,k=2,进行m次二分类,选取其中SSE最小者作为正确的分类。
- 在已经分开的所有的集合中,选取SSE最大的集合。把这个集合分为2个集合,同样用Kmeans方法,k=2,m次Kmeans,选取SSE最小者作为正确的分类。
- 重复3,直到分为k类为止。
参考文献
您的支持将鼓励我继续创作!
Recommend
About Joyk
Aggregate valuable and interesting links.
Joyk means Joy of geeK