

How to make the best product decisions based on thousands of user inputs
source link: https://uxdesign.cc/how-to-make-the-best-product-decisions-based-on-thousands-of-user-inputs-7fc0d7658a12
Go to the source link to view the article. You can view the picture content, updated content and better typesetting reading experience. If the link is broken, please click the button below to view the snapshot at that time.

How to make the best product decisions based on thousands of user inputs
TL;DR
These days everyone has a lot of qualitative and quantitative data about their product. Data is coming from everywhere. You have lots of user interviews, feedback from surveys and other tools, also users send lots of feature requests and have issues with multiple parts of the software you are working on, and boy oh boy, they do let you know about their ideas and struggles. In the end, you end up having a huge amount of unstructured data waiting to be used.
User insights are important, data-driven decision making is essential.
We all know that user insights are one of the cornerstones of the product decision-making process. They can be extremely valuable — you can make roadmap decisions based on them and determine the biggest impacts. However, you need to use them carefully, otherwise, you will get to the wrong conclusion or end up not using them at all. But that would be a huge missed opportunity, don’t you think? Don’t you?

Want to analyze a lot of data? First, you need to structure it…
But seriously, somehow you need to make sense out of this big pile of user insights and make use of it!
My team has realized that the key here is how you structure your data. In order to make data-driven decisions, you have to be able to browse your data, and quickly determine which area you should focus on.
Can any structure work?
No! We tried to use the recommended structure for a year. We ended up making decisions without considering these insights.
Usually, the recommended structure is the following:

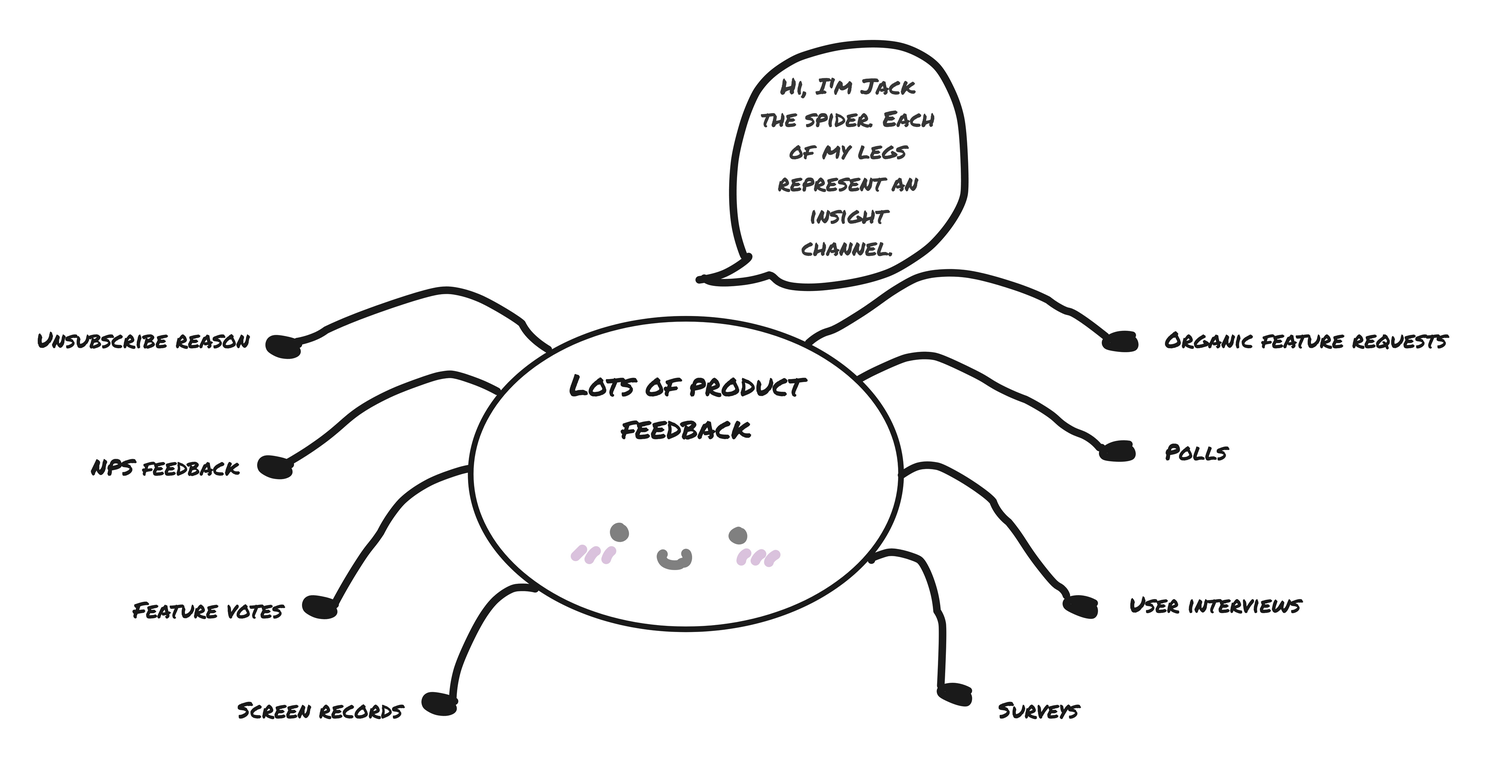
You divide your product into components (e.g. registration, dashboard), assign bigger features and smaller features to the components based on the insights coming from multiple insight channels that Jack the spider was so kind to represent to us above. By following this structure, you will collect your feature requests and plan your product roadmap based on which feature got the most “votes” (of course scoring can be a lot more complex than just counting how many users asked for that feature).
But this doesn’t work. It is misleading and confusing for several reasons.
The problems
The faster horse problem
There is a famous quote (allegedly) from Henry Ford, saying that
“If I had asked people what they wanted, they would have said faster horses.”
This means users can’t always tell you the best solution to implement, in this case giving them cars was far more ideal. But you can understand the user’s need and you can come up with a better solution.
The faster horse problem was one issue we faced when using the suggested structure. Let me show you an example to demonstrate it.
This is Jimmy, and he is using a video conferencing app. He wants us to add an audio troubleshoot feature.

This is a solution, but the problem is that poor Jimmy has too many issues with his audio connection. Fixing this issue on our side, instead of making him troubleshoot the problems manually is a way better solution. Jimmy, unfortunately, didn’t suggest the best solution, but we cannot blame him, he is no expert.
So imagine creating a feature like this, putting it in our structure, getting more and more votes for it, and implementing it one day. It is not ideal, it is not the best solution.

Fragmented insights everywhere
This is Katie, she is also using the video conferencing app. She says that loading the app takes a lot of time.

Now let’s look at our structure. We have several features that aim to solve this issue (e.g. enhance loading indications, fix frontend loading issue, etc.). So where would you place it in the structure? To one of them, or both? Either way, you won’t see the full picture. We can’t see the original problem’s importance because it’s under different components and not adding up.

This doesn’t help in prioritizing problems.
How to solve this?
Let me show you one type of qualitative data structuring technique which is an example of how we ended up structuring our data. With the help of this new structure, we were able to focus on the areas that really matter from both product and research points of view.
I also linked the Workshop agenda so that you are able to create your own structure with your team. The solution that worked for our Product and UX team might not be the perfect one for you, so let’s create your own!
Our way to the ideal structure
First, let me show you the double diamond diagram that you almost certainly already know.

According to this process, first, you need to find your generic problem. Then as a UX researcher, you will most certainly dig deeper and find multiple problems. Afterward, you need to decide which specific problem you are going to work on.
Are we done here? Not quite yet! We still have to find a solution to that specific problem… So what do we do? We start to ideate about the best solution. We end up having “hundreds” of solution proposals from which we have to choose the best one (highest value, lowest effort, etc.).
This is a proper process that leads you to effective product development.
In the case of Jimmy’s insight, he gave a specific solution. Now, instead of collecting feature requests — and deciding what to implement based on which feature got the most “votes” — we are going to try another approach, that will follow the double diamond process.

According to that process, you need to trace the solution back to a specific problem. In this case, the problem is that the user is having audio connection issues. Now we’ve got the problem, what’s next? Now comes the ideation phase. We need to find the best working solutions to this problem. Perhaps you can give them an audio troubleshoot guide, or you can fix the connection issue itself. What have we got? We’ve got more and better solutions for the root problem that we can choose from. We also know that these solutions are tied to the same problem.

And now comes the exciting part… as your product grows, you are going to have a huge amount of user feedback, which will all lead to hundreds of problems. You need to carefully choose what to implement and what not to. Ideally, you choose to solve the most pressing problems and implement the biggest user needs to provide the biggest impact. Good news, now you can!
So here we are, having 100 problems. Based on the number and weight of the user insights and probably other factors (company goals, personas, etc.) you will choose which problem to work with. Then you will do the ideation part, and you end up with 100 solutions. Now comes the prioritization part. There are multiple ways to find the best and finest solution. This article does not cover this topic, but check this one out if you’re interested: https://plan.io/blog/feature-prioritization/
Hurraaaay! We have a solution to implement that is so important and so wonderful and so everything that we ever wished for, we really really love it thankyouverymuch! ?
The final structure
Now let’s visualize the cold facts ? about how our structure ended up!
As you can see, user insights are assigned to features, features are linked to problems, and problems are ordered under use cases (or they can be even user goals). We introduced the use case level because our product is becoming pretty big, so we want the problem spaces to be grouped in order to have easier navigation between the problems.

If we were part of the team for that video conferencing product, here’s an example of how we would have structured Katie’s and Jimmy’s feedback:

As you can see an insight does not have to be assigned to a feature. You will prioritize the problems first, not the features and you will ideate about more solutions, so it completely works.
I would like to emphasize that this is an ever-growing structure. The thing that worked today may not work tomorrow. This is what makes the whole structuring topic really hard. Besides, what worked for our company might not work for yours. That’s why I’m publishing the Workshop agenda that led us to this solution, so you will be able to come up with yours.
We tried to keep our structure flat for now, but you might experience the need for even more levels (e.g. if it is hard to navigate between problems because there are so many, that can be a sign). In that case, you can introduce another problem space level on top of the smaller problems or add broader use cases on top of lower-level use cases. It depends on what works for you.
Tip: In the beginning, if you are wondering whether it is better if you create one problem instead of two, or is it worth dividing them, go with the latter. You can always merge groups, but it is really hard to separate them.
How does this new structure help our job?
Advantage 1
From now on this structure does not only serve product management anymore. It is just as much for UX Research. The UXR will see which problems are the big ones and will be able to start to research that topic, dig deeper. Additionally, this way of thinking will encourage everyone to think about the whys and be less feature-request oriented.
Advantage 2
Product development just became a hell of a lot more efficient. Implementing something that is not worth it? No more! Implementing something that does not solve the issue? No more!
Advantage 3
This is the perfect tool for the Product — UX Research collaboration. The UXR can easily contribute to the roadmap planning and the Product Manager can choose the highest impact features from now on.
Advantage 4
UX designers and other colleagues (customer success, sales, etc.) who are not actively involved in insight processing will see a structure that is easy to navigate, gives a great overview, and allows bigger problems to be identified at a glance.
Tools
There is a lot of software on the market that can help you with managing this stuff (Productboard, User Voice, Aha!, ProductPlan, etc.)
I’d highly suggest thinking thoroughly about which tool will fit your needs the best. Once you committed yourself to one tool, started to collect your data there, and structured it, there is no going back. Migrating your data to another tool is a huge effort.
Quantitative data
So far, we mostly talked about qualitative data. But, surpriiiise, it works with quantitative data as well!!! ? How cool is that?
Whenever you see that for example, a feature request has 88 votes on your public feature request page, you just have to assign this insight to the feature itself and give a bigger impact score compared to what you give usually (when let’s say just one person requested it on a user interview).
It also works with surveys and other quantitative methodologies. You just have to be a bit creative sometimes, but it can work!
Acknowledgment
Many thanks to Linda Czinner (Principal Product Manager at
) who was part of this journey just as much as I was.Recommend
About Joyk
Aggregate valuable and interesting links.
Joyk means Joy of geeK