

Improving Presto Architectural Decisions - DZone Big Data
source link: https://dzone.com/articles/improving-presto-architectural-decisions-with-shad
Go to the source link to view the article. You can view the picture content, updated content and better typesetting reading experience. If the link is broken, please click the button below to view the snapshot at that time.
Motivation and Background
At Meta (Facebook), Presto is a distributed real-time query engine using SQL language as an interface to perform fast, interactive queries on petabytes of data. It supports standard ANSI SQL, including queries, aggregations, JOINs, and window functions.
Alluxio is the data orchestration platform as a critical technology supporting Presto and various other data analytics applications and use cases. Alluxio creates a virtual data layer that federates data from any file system or object store, provides a unified namespace across storage systems, and serves the data to the applications using industry-standard interfaces with fast data access.
To improve the performance of Presto, understanding the impact of cache size and cache hit ratio is essential. Presto needs to know certain caching information from Alluxio to determine whether expanding cache size can help improve cache hit ratio and performance when the cache storage is limited. This information is also helpful to optimize caching algorithms. We also want to optimize the routing algorithm for better balance and efficiency. As a result, how to better track and manage Alluxio cache data is key to presto optimization decisions.
Two key questions need to be addressed from Presto’s side:
1. How to size the cache for each tenant
2. What is the potential cache hit ratio improvement?
We propose “Shadow Cache,” a lightweight Alluxio component for tracking working set size and cache hit rate.
To answer the first question, Shadow Cache will tell the administrator how many non-duplicate bytes the cache has received in the past 24 hours to estimate the future cache demand. For the second question, Shadow Cache will tell the administrator how many requests hit the cache if the cache can keep all the requests over the last 24 hours, i.e., the unhit ones are the ones that never came up, so the maximum hit rate of the cache can be calculated.
This lightweight Alluxio component, Shadow Cache, can provide insights into the cache working set and what the cache hit rate would look like if there is infinite cache space. In order to monitor the cache state of the cluster, we define the following key metrics.
- C1: Real cache usage at a certain point in time
- C2: Shadow cache working set in a time window (1 day/1 week)
- H1: Real cache hit-rate
- H2: Shadow cache hit-rate
The Challenge
While we have attempted to provide the above metrics for Alluxio’s cache, we have encountered several challenges.
Low Memory and CPU Overhead
The Shadow Cache is a lightweight component that keeps track of the size of cached working sets. It is difficult to keep track of an “infinite” working set with limited memory. Shadow Cache must also have a low CPU overhead since it caches the data when processing each query. Otherwise, user requests will be blocked for a long time.
Accuracy
Shadow Cache must also guarantee accuracy. In Presto, Shadow Cache measures the cache status of a cluster, and if the estimated limit cache hit rate is too low, Presto may wrongly determine that this job is cache-unfriendly. In contrast, if the estimated limit cache hit rate is too high, Presto may believe that expanding the cache of the cluster at this point will significantly improve the overall performance.
Dynamic Update
Presto and other modern data applications are mainly used for discovering current or future trends. Therefore, Shadow Cache should also discard obsolete items in real-time. Otherwise, it is likely to bring noise interference to the decision. Sliding windows are one of the most common methods for storing the newest items, but creating the data structure for the sliding window model is not easy. When the window slides, we need to delete the items that were just moved out in real-time. It is important to find the item that needs to be deleted as fast as possible and delete it.
The Solution
In light of the two requirements of high accuracy and low overhead, we immediately think of the Bloom filter, which has gained popularity in various distributed databases. Shadow Cache estimates the working set size and limit hit rate based on the Bloom filter. Here is how Bloom filters solve the three challenges.
Bloom Filters: The Solution to Overhead and Accuracy Challenges
Bloom filter is a space-efficient probabilistic data structure membership testing. A Bloom filter is an array initialized with all zeros in bits, and each object is represented with only several bits, significantly saving space overhead and providing queries with excellent efficiency. Bloom filters can determine whether an item exists or not. The item must not exist if the Bloom filter returns that it does not exist. Note that false positives are possible, but false negatives are not.
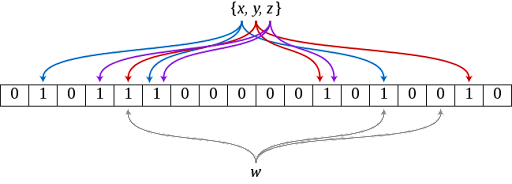
The Bloom filter has k hash functions. To add an element, apply each hash function and set the bit to 1. To query an element, apply each hash function and AND the bits. When all the bits on the k positions are 1, the item is considered to exist. Otherwise, the item is not considered to exist.
Bloom Filter Chain: The Solution to Dynamic Update
Bloom filters can provide both low overhead and high accuracy, so can we directly apply them to Shadow Cache?
The first issue we encounter is that Bloom filters do not support deletion. This is because we only care about the size of the working set of the user’s application over time, and Shadow Cache is required to do this. Shadow Cache does this by linking multiple filters together to create a Bloom filter chain.
Here is how the Bloom filter chain can be used to update the load size of the working set in real-time.
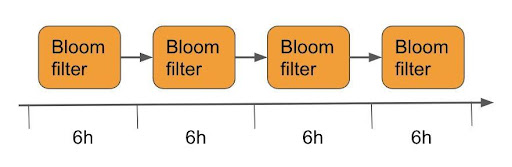
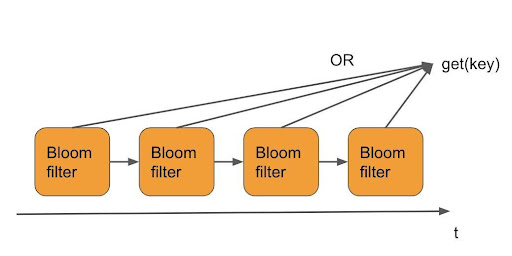
Query
As shown above, Shadow Cache is a chain composed of multiple Bloom filters. When tracking the size of a user’s working set in the past 24 hours, we can divide 24 hours into four periods. A Bloom filter tracks each period in Shadow Cache, and each Bloom filter tracks a period. Shadow Cache uses all the existing Bloom filters or creates a new Bloom filter for the query, as shown in the following figure.
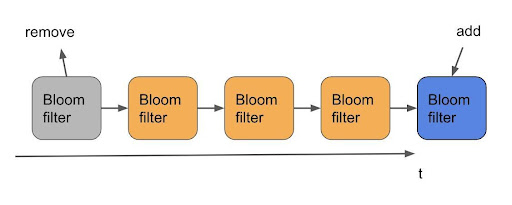
Live Update
To keep the data real-time, we need Shadow Cache to discard the data that has become obsolete when the time window is sliding. The Bloom filter values must be updated continuously with time t, and the Bloom filter items already outside the time window must be deleted. Since we are combining multiple Bloom filters, it is easy to determine where the outdated items are located at the very end of the Bloom filter, as shown in the figure below. Every time a new period begins, we delete the oldest filter from the chain and add a new all-empty filter to record the latest data.
Working Set Size
As bloom filters map an item to multiple bits, judging the working set size based solely on the number of bits to 1 would introduce an unacceptable error since a bit may represent multiple items and an item can be scattered among multiple bits. Therefore, we employ the formula derived by Swamidass & Baldi (2007). We leverage the approximation with the following equation to measure the working set size.
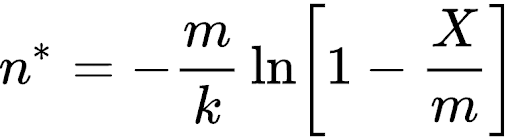
Where n* is an estimate of the number of items in the filter, m is the length (size) of the filter, k is the number of hash functions, and X is the number of bits set to one.
Infinite Size Hit Ratio
After providing the working set size metric, Shadow Cache also needs to provide the infinite size hit ratio. We can use Bloom filters as a cache with infinite space because they can track huge amounts of data with little memory usage. The number of user requests hitting a Bloom filter equals the number of hits in an infinite cache, denoted as a hit. The total number of “user requests” is denoted as queryNum. QueryNum is the total number of “user requests,” so the hit rate is equal to hit/queryNum.
Using Shadow Cache to Determine Presto Cluster Cache Status
After completing the Bloom filter chain, we can quickly learn the previously defined metrics H1, H2, C1, C2. In the next step, Presto can determine the cache status of the cluster by comparing the size relationship between them, as shown in the following figure.
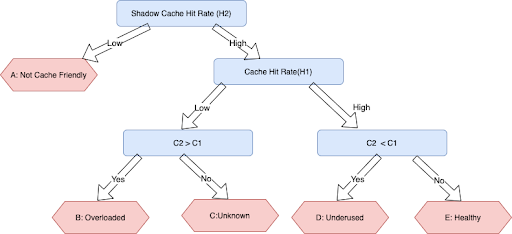
When H2 is low, it indicates that the cache hit rate of the application in this cluster cannot be reached even with unlimited cache space. This implies that this application is not cache-friendly. When H2 is high and H1 is low and C2 > C1, it indicates that the cluster is under-allocated cache space and the hit rate can be further improved if the cache capacity is expanded. When H2 is high and H1 is high and C2 < C1, the cluster cache is over-allocated and the resources are wasted. A cluster is in good shape if H2 > H1 and C2 > C1 and C2 > C1, meaning scaling the cache is not needed.
Implementation
Shadow Cache’s implementation of Bloom filters is based on the Guava BloomFilter lib and supports specific filter configurations based on user-defined memory overhead budget and shadow cache window. Currently, Shadow Cache supports working set size in terms of #pages and #byte, which represent how many pages and how many specific bytes the working set contains, respectively. For hit rate calculation, Shadow Cache supports infinite size byte hit ratio and object hit ratio
Below are the configurations:
- #The past window to define the working set:
alluxio.user.client.cache.shadow.window=24h - #The total memory overhead for bloom filters used for tracking:
alluxio.user.client.cache.shadow.memory.overhead=125MB - #The number of bloom filters used for tracking. Each tracks a segment of window:
alluxio.user.client.cache.shadow.bloomfilter.num=4
Test Results
We tested Shadow Cache and found that with only 125MB of space, Shadow Cache can track 27TB of working sets with an error rate of only 3%. Moreover, the error rate can be further reduced by using HyperLogLog, but the infinite size hit ratio estimation will not be supported if HyperLogLog is used.
Presto Routing Optimization
To improve the performance, Presto needs a way to adjust the cluster in time if it learns the specific cluster state from Shadow Cache. Our next step is to describe the current Presto routing algorithm and then provide several options for routing optimization after introducing Shadow Cache.
Presto Routing
Presto stores different tables in different clusters, sharing the cache across clusters by table name. Therefore, a query that accesses the same table will always go to the same target cluster to maximize its cache. The cluster cache would be filled with various disparate tables if this wasn’t done. Below is a diagram of the routing algorithm.
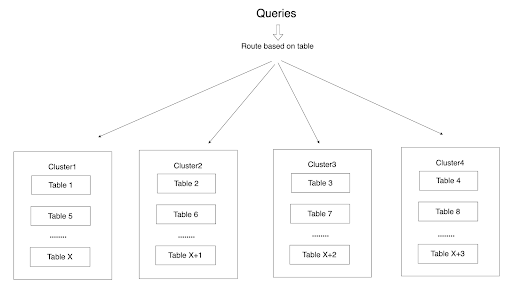
As shown in the figure above, table 1 to table 4 have different table names and are therefore assigned to different clusters. When requesting data from table1, the routing algorithm will send the request to cluster1, and when requesting data from table3, the routing algorithm will send the request to cluster3.
Routing Optimization Options
The response time of a cluster request is a simple way to determine if a cluster is working. When the cluster is slow to respond or takes too long to respond, we assume that the cluster is having a problem. With Shadow Cache, as mentioned above, combined with H1, H2, C1, and C2, we can quickly determine if a cluster is experiencing performance degradation due to cache stress.
Presto proposes the following three routing optimization options for such an underperforming cluster. Of course, each option has its tradeoff.
Option 1
When the primary cluster is busy, have a designated secondary cluster with the cache turned on for those queries. However, this approach requires storing additional tables cache on each cluster.
Option 2
Both clusters are treated asthe primary cluster for serving requests and load balancing is performed in both clusters. However, this option will multiply the cache disk space usage.
Option 3
Build the Map from tables to clusters and make the CPU utilization more even. However, it could make cache storage distribution not even and requires extra cache space.
Summary
The challenge of tracking and estimating the size of the working set in the cache is significant, so we developed a lightweight Alluxio component Shadow Cache using Bloom filters. Because we are only interested in the latest status of the working set, it is necessary to use a time window model to eliminate obsolete items. Shadow Cache divides the time window into four segments for this purpose. Each segment is tracked with a different Bloom filter. A new Bloom filter is created to track the latest data, replacing the earliest one in each elimination. Finally, when the working set size needs to be provided, we use the Swamidass & Baldi (2007) proposed formula for base estimation.
Overall, Shadow Cache provides Presto with four convenient metrics: H1, H2, C1, and C2, where H1 and C1 represent the real cache hit rate and usage, respectively, while H2 and C2 represent the limit hit rate of the cache and the size of the user’s working set over a period of time. Presto can quickly determine the relationship between cache capacity and application performance and optimize the routing algorithm for better balance and efficiency based on the above four metrics.
Check out the merged code on GitHub.
Recommend
About Joyk
Aggregate valuable and interesting links.
Joyk means Joy of geeK