

Golang profiling and optimizing
source link: http://yangxikun.com/golang/2017/12/24/golang-profiling-optimizing.html?
Go to the source link to view the article. You can view the picture content, updated content and better typesetting reading experience. If the link is broken, please click the button below to view the snapshot at that time.
Golang profiling and optimizing
本文总结自Profiling and Optimizing Go,对应的PPT,有梯子的可以直接看视频,没梯子的也可以看下这篇文章:) 。
Golang的runtime内建了强大的分析工具pprof,能帮助我们对程序运行时的CPU、内存进行分析。
首先,跟随视频,将作者提供的代码clone下来。在我们的工作区执行go get -v github.com/prashantv/go_profiling_talk即可。
进入src/github.com/prashantv/go_profiling_talk,master分支是优化过的最快的版本,slow分支是优化前的版本,执行go run main.go即可启动一个http服务。
代码说明:
- 以一个http服务运行,有两个请求路径
/hello和/simple /hello的请求会增加一些统计信息的记录,然后输出Hello world/simple的请求则是简单的输出Hello world!- 实践目的:通过pprof分析优化
/hello接口的性能,使其与/simple接口的性能差距尽量小。
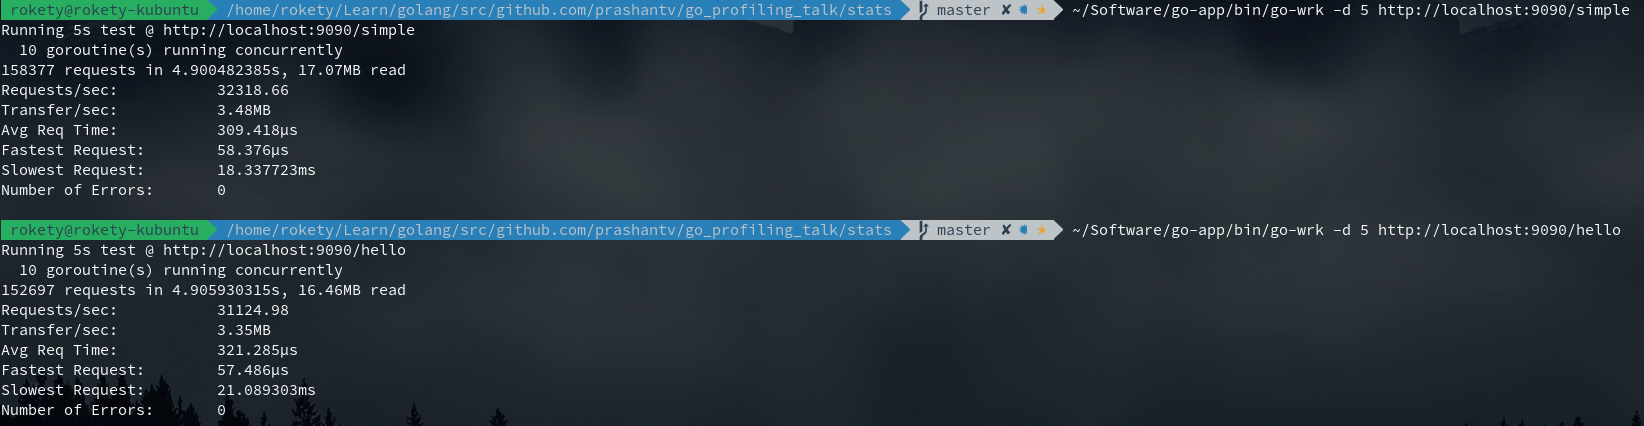
先来看看未优化前/hello和/simple的性能对比:
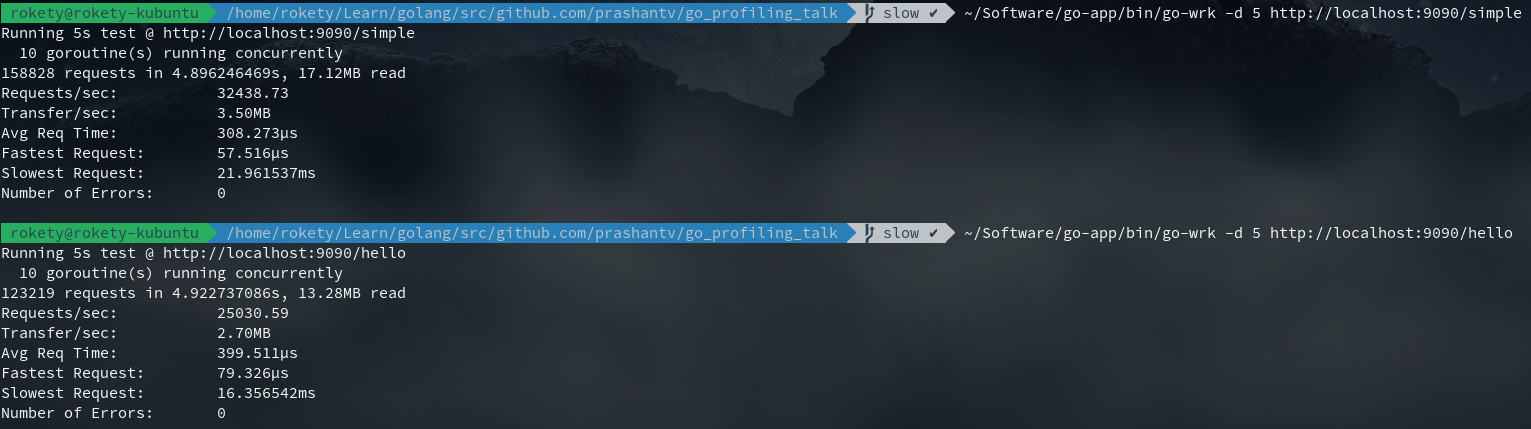
很明显/hello要比/simple慢很多,接下来就开始我们的性能分析之旅。首先需要保证/hello接口处于压测状态,因为这样才能进行性能分析的数据采样。
执行~/Software/go-app/bin/go-wrk -d 500 http://localhost:9090/hello进行500s的持续压测。
访问http://localhost:9090/debug/pprof/,能够看到:
- {当前协程数量} goroutine
- {当前堆上对象的数量} heap
goroutine 页面
展示了当前正在运行的所有协程的调用栈,每一块调用栈的开头表示pprof采样时有多少个协程处于这个调用栈,如下表示有4个协程:
4 @ 0x42ec9c 0x429daa 0x4293a7 0x491b9e 0x491c1d 0x4929ba 0x563772 0x575aad 0x65bef5 0x516a5a 0x51790c 0x517b74 0x5e9fd0 0x5e9ddb 0x656169 0x65d1fc 0x660ffe 0x45d5e1
#	0x4293a6	internal/poll.runtime_pollWait+0x56		/home/rokety/Software/go/src/runtime/netpoll.go:173
#	0x491b9d	internal/poll.(*pollDesc).wait+0xad		/home/rokety/Software/go/src/internal/poll/fd_poll_runtime.go:85
#	0x491c1c	internal/poll.(*pollDesc).waitRead+0x3c		/home/rokety/Software/go/src/internal/poll/fd_poll_runtime.go:90
#	0x4929b9	internal/poll.(*FD).Read+0x189			/home/rokety/Software/go/src/internal/poll/fd_unix.go:126
#	0x563771	net.(*netFD).Read+0x51				/home/rokety/Software/go/src/net/fd_unix.go:202
#	0x575aac	net.(*conn).Read+0x6c				/home/rokety/Software/go/src/net/net.go:176
#	0x65bef4	net/http.(*connReader).Read+0x104		/home/rokety/Software/go/src/net/http/server.go:753
#	0x516a59	bufio.(*Reader).fill+0x119			/home/rokety/Software/go/src/bufio/bufio.go:97
#	0x51790b	bufio.(*Reader).ReadSlice+0x2b			/home/rokety/Software/go/src/bufio/bufio.go:338
#	0x517b73	bufio.(*Reader).ReadLine+0x33			/home/rokety/Software/go/src/bufio/bufio.go:367
#	0x5e9fcf	net/textproto.(*Reader).readLineSlice+0x6f	/home/rokety/Software/go/src/net/textproto/reader.go:55
#	0x5e9dda	net/textproto.(*Reader).ReadLine+0x2a		/home/rokety/Software/go/src/net/textproto/reader.go:36
#	0x656168	net/http.readRequest+0x98			/home/rokety/Software/go/src/net/http/request.go:925
#	0x65d1fb	net/http.(*conn).readRequest+0x17b		/home/rokety/Software/go/src/net/http/server.go:933
#	0x660ffd	net/http.(*conn).serve+0x50d			/home/rokety/Software/go/src/net/http/server.go:1739
heap 页面
展示了堆内存的详细信息,页面底部部分信息字段说明:
- NumGC:程序运行到现在的gc执行次数
- PauseNs:是拥有256个元素的环形缓冲,用于记录最近的256次gc执行的停顿时间(一次gc执行可能会有多次停顿,这里记录的是一次gc执行中总的停顿时间)
- PauseEnd:也是拥有256个元素的环形缓冲,用于记录最近的256次gc执行时,停顿结束的时间戳(纳秒级)(一次gc执行可能会有多次停顿,这里记录的是最后的一次停顿的结束时间)
- 更多字段含义可以查看:runtime.MemStats
现在开始进行采样并分析,执行go tool pprof --seconds 5 http://localhost:9090/debug/pprof/profile,会将采样结果下载下来,并且打开一个交互界面:
Fetching profile over HTTP from http://localhost:9090/debug/pprof/profile?seconds=5
Please wait... (5s)
Saved profile in /home/rokety/pprof/pprof.main.samples.cpu.002.pb.gz
File: main
Type: cpu
Time: Dec 25, 2017 at 10:26pm (CST)
Duration: 5.12s, Total samples = 8.86s (173.15%)
Entering interactive mode (type "help" for commands, "o" for options)
(pprof) top
Showing nodes accounting for 3790ms, 42.78% of 8860ms total
Dropped 198 nodes (cum <= 44.30ms)
Showing top 10 nodes out of 182
      flat  flat%   sum%        cum   cum%
    2070ms 23.36% 23.36%     2170ms 24.49%  syscall.Syscall /home/rokety/Software/go/src/syscall/asm_linux_amd64.s
     550ms  6.21% 29.57%      560ms  6.32%  syscall.Syscall6 /home/rokety/Software/go/src/syscall/asm_linux_amd64.s
     200ms  2.26% 31.83%      380ms  4.29%  regexp.(*machine).tryBacktrack /home/rokety/Software/go/src/regexp/backtrack.go
     200ms  2.26% 34.09%      200ms  2.26%  runtime.epollctl /home/rokety/Software/go/src/runtime/sys_linux_amd64.s
     150ms  1.69% 35.78%      150ms  1.69%  runtime._ExternalCode /home/rokety/Software/go/src/runtime/proc.go
     140ms  1.58% 37.36%      140ms  1.58%  runtime.memmove /home/rokety/Software/go/src/runtime/memmove_amd64.s
     130ms  1.47% 38.83%      620ms  7.00%  runtime.mallocgc /home/rokety/Software/go/src/runtime/malloc.go
     120ms  1.35% 40.18%      200ms  2.26%  runtime.mapassign_faststr /home/rokety/Software/go/src/runtime/hashmap_fast.go
     120ms  1.35% 41.53%      120ms  1.35%  runtime.usleep /home/rokety/Software/go/src/runtime/sys_linux_amd64.s
     110ms  1.24% 42.78%      110ms  1.24%  runtime.heapBitsSetType /home/rokety/Software/go/src/runtime/mbitmap.go
(pprof) top -cum
Showing nodes accounting for 2.16s, 24.38% of 8.86s total
Dropped 198 nodes (cum <= 0.04s)
Showing top 10 nodes out of 182
      flat  flat%   sum%        cum   cum%
         0     0%     0%      8.02s 90.52%  net/http.(*conn).serve /home/rokety/Software/go/src/net/http/server.go
     0.03s  0.34%  0.34%      3.53s 39.84%  net/http.(*ServeMux).ServeHTTP /home/rokety/Software/go/src/net/http/server.go
         0     0%  0.34%      3.53s 39.84%  net/http.serverHandler.ServeHTTP /home/rokety/Software/go/src/net/http/server.go
         0     0%  0.34%      3.35s 37.81%  github.com/prashantv/go_profiling_talk/handlers.WithStats.func1 /home/rokety/Learn/golang/src/github.com/prashantv/go_profiling_talk/handlers/stats_handler.go
         0     0%  0.34%      3.35s 37.81%  net/http.HandlerFunc.ServeHTTP /home/rokety/Software/go/src/net/http/server.go
     0.01s  0.11%  0.45%      2.38s 26.86%  net/http.(*response).finishRequest /home/rokety/Software/go/src/net/http/server.go
     2.07s 23.36% 23.81%      2.17s 24.49%  syscall.Syscall /home/rokety/Software/go/src/syscall/asm_linux_amd64.s
     0.02s  0.23% 24.04%      2.07s 23.36%  bufio.(*Writer).Flush /home/rokety/Software/go/src/bufio/bufio.go
     0.01s  0.11% 24.15%      1.86s 20.99%  github.com/prashantv/go_profiling_talk/handlers.getStatsTags /home/rokety/Learn/golang/src/github.com/prashantv/go_profiling_talk/handlers/stats_handler.go
     0.02s  0.23% 24.38%      1.80s 20.32%  net/http.(*conn).readRequest /home/rokety/Software/go/src/net/http/server.go
top默认显示10个占用CPU时间最多的函数,top -cum则显示10个占用CPU时间(包括其调用的子函数)最多的函数。
使用web命令可以在浏览器打开一张SVG图,能够更好地看到函数调用CPU占用情况(web依赖Graphviz,没有的话安装下sudo apt-get install graphviz ):

图有点大(点击上图可打开svg图片),以如下方块为例:
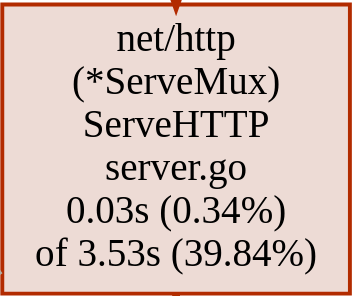
net/http(*ServeMux)ServeHTTP server.go:调用的函数0.03s(0.34%):表示函数本身执行了0.03s,占总采样时间8.86s的0.34%3.53(39.84%):表示函数本身执行时间+调用的子函数的执行时间用了3.53s,占总采样时间的39.84%
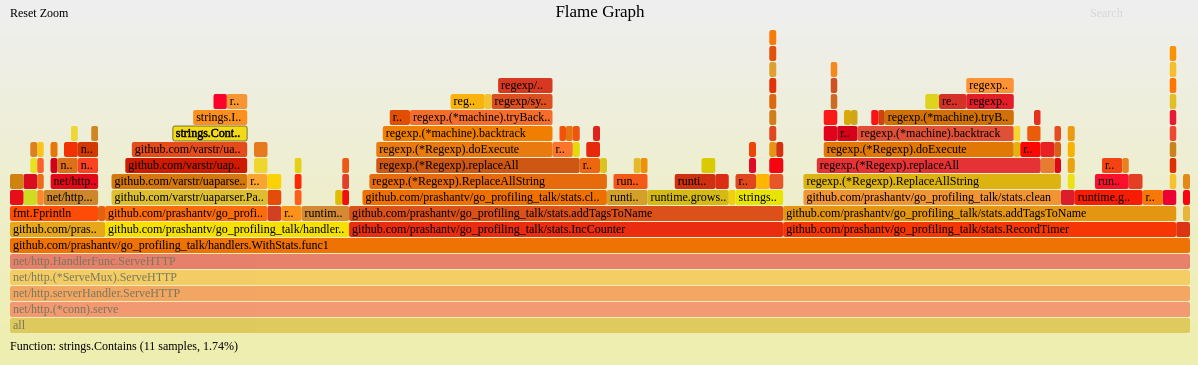
还可以使用另外一个工具,来生成火焰图,~/Software/go-app/bin/go-torch --seconds 5 http://localhost:9090/debug/pprof/profile:

(点击上图可打开svg图片),火焰图怎么看?首先找与业务逻辑代码相关的且占用CPU时间最多的函数,可以看到github.com/prashantv/go_profiling_talk/handlers.WithStats.func1用于获取统计信息的函数占用了不少CPU时间,点击该函数可以看到其调用栈的更详细信息:
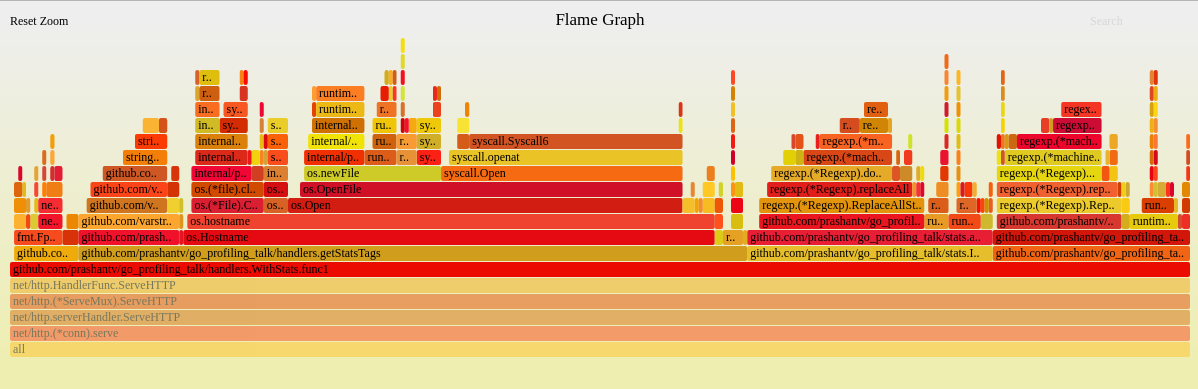
现在可以看到github.com/prashantv/go_profiling_talk/handlers.getStatsTags->os.Hostname的调用是占最多CPU时间的,看下对应的代码:
func getStatsTags(r *http.Request) map[string]string {
	userBrowser, userOS := parseUserAgent(r.UserAgent())
	stats := map[string]string{
		"browser":  userBrowser,
		"os":       userOS,
		"endpoint": filepath.Base(r.URL.Path),
	}
	host, err := os.Hostname()
	if err == nil {
		if idx := strings.IndexByte(host, '.'); idx > 0 {
			host = host[:idx]
		}
		stats["host"] = host
	}
	return stats
}
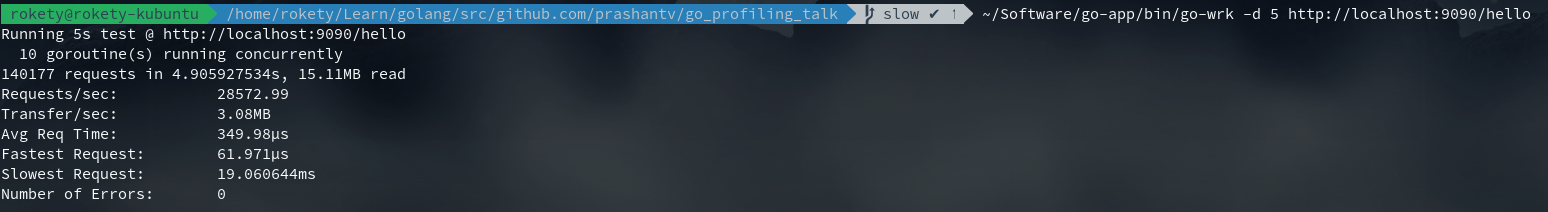
os.Hostname在每次请求都会被调用,然而hostname不会变化得很频繁,所以我们可以改下代码,对应的commit。
看下修改后的性能如何,增加了3000+qps:
现在,重新生成火焰图看下,继续找与业务逻辑代码相关的且占用CPU时间最多的函数:
这次我们可以看到github.com/prashantv/go_profiling_talk/stats.addTagsToName->github.com/prashantv/go_profiling_talk/stats.clean占用许多CPU时间,看下对应的代码:
func addTagsToName(name string, tags map[string]string) string {
	// The format we want is: host.endpoint.os.browser
	// if there's no host tag, then we don't use it.
	var keyOrder []string
	if _, ok := tags["host"]; ok {
		keyOrder = append(keyOrder, "host")
	}
	keyOrder = append(keyOrder, "endpoint", "os", "browser")

	parts := []string{name}
	for _, k := range keyOrder {
		v, ok := tags[k]
		if !ok || v == "" {
			parts = append(parts, "no-"+k)
			continue
		}
		parts = append(parts, clean(v))
	}

	return strings.Join(parts, ".")
}

var specialChars = regexp.MustCompile(`[{}/\\:\s.]`)

// clean takes a string that may contain special characters, and replaces these
// characters with a '-'.
func clean(value string) string {
	return specialChars.ReplaceAllString(value, "-")
}
在clean函数中使用了正则替换,将{}/\\:\s.字符替换为-。
我们还可以通过go pprof查看上面两个函数的执行情况,首先写好Benchmark测试用例,对应的commit,然后执行go test -bench . -benchmem -cpuprofile prof.cpu,该命令会产生CPU的分析文件prof.cpu。

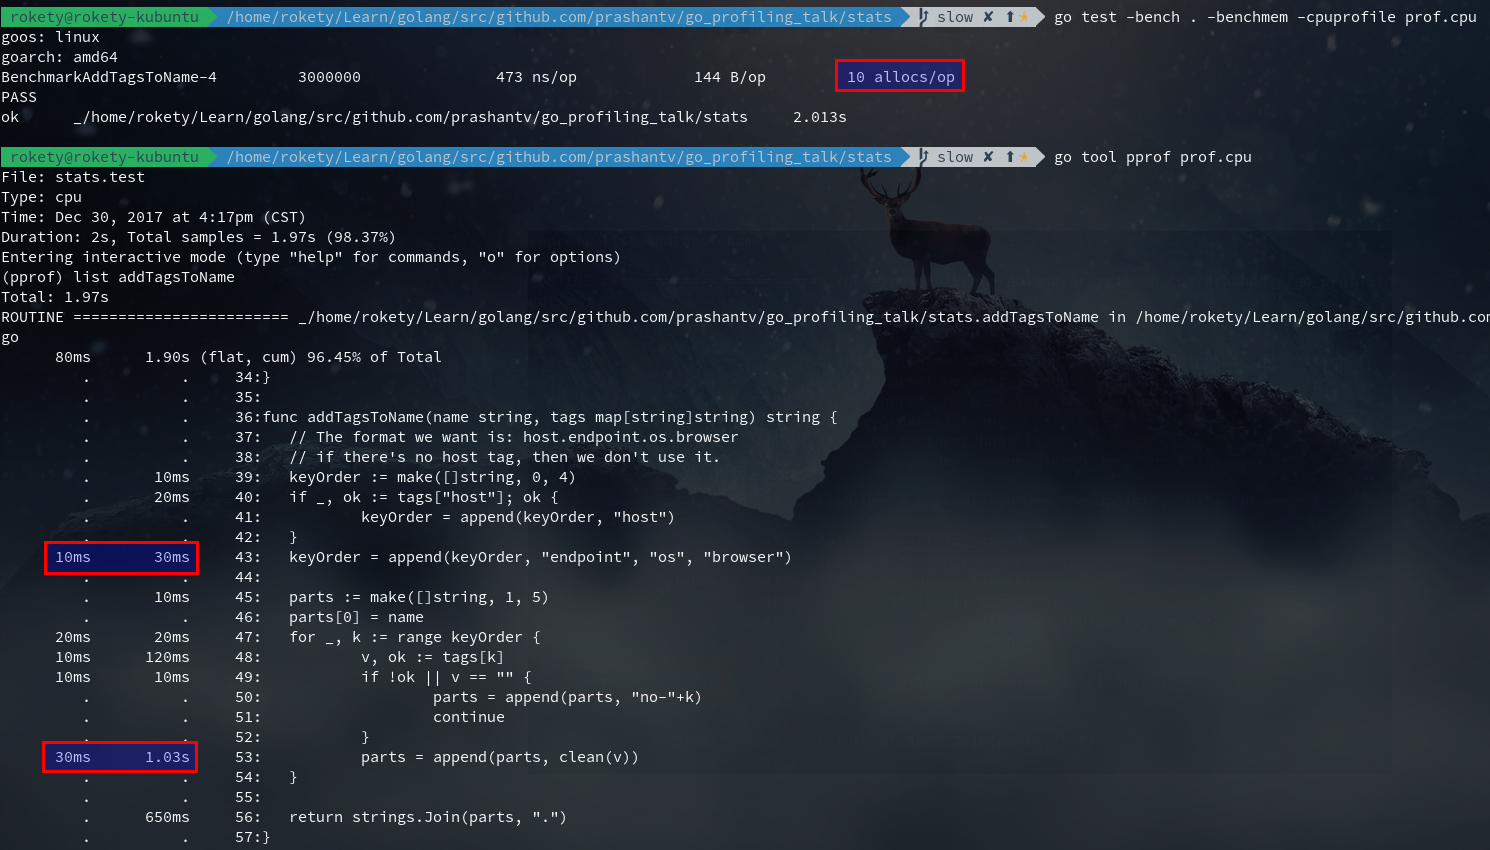
执行go tool pprof prof.cpu,然后看下addTagsToName函数的执行情况:
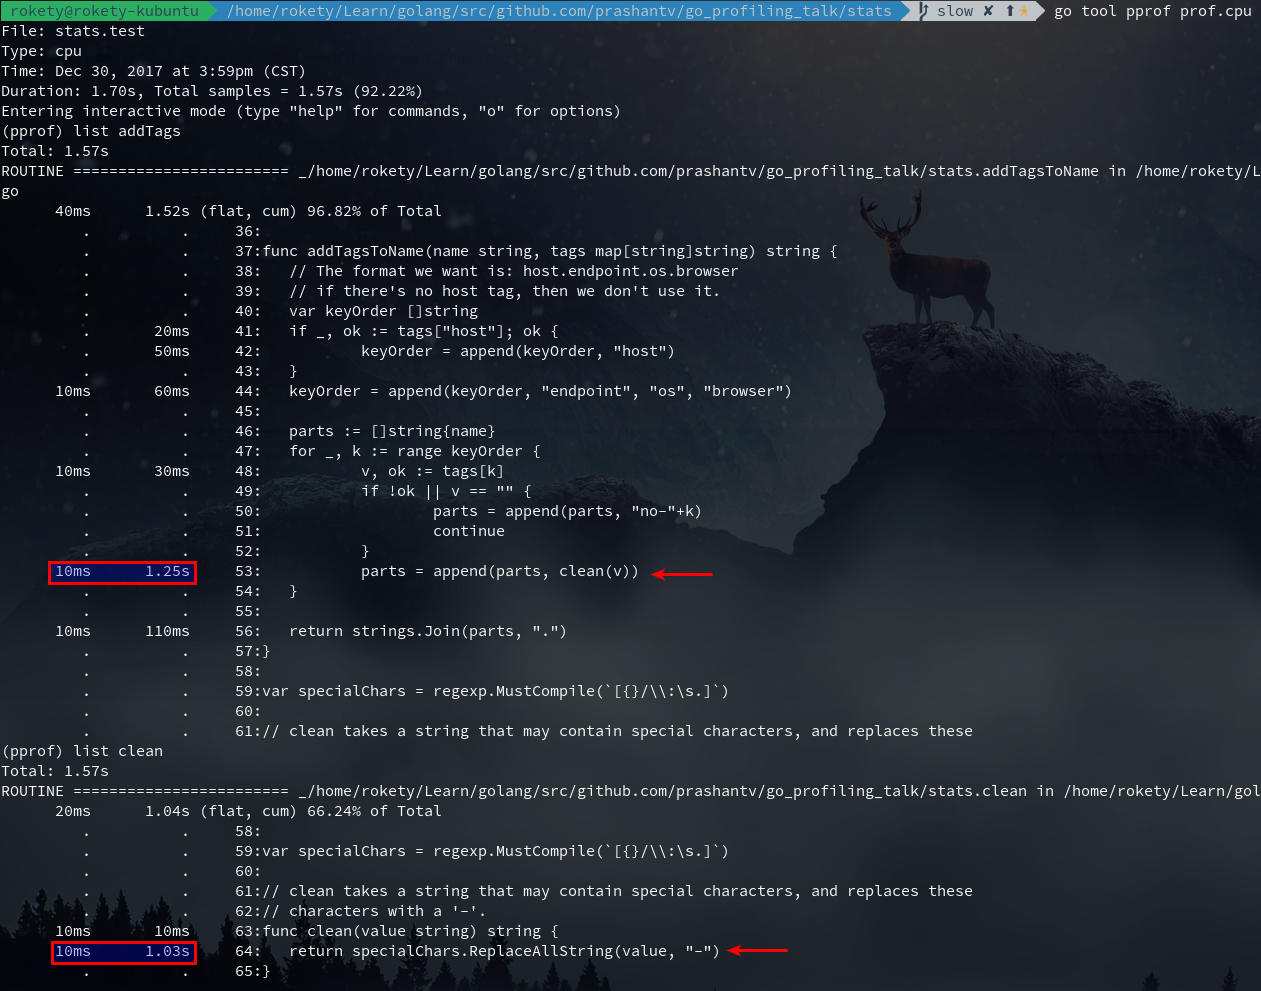
上图红框中的10ms是指某一次采样时,addTagsToName正好处于调用栈顶,每采样一次的时间间隔是10ms。(When CPU profiling is enabled, the Go program stops about 100 times per second and records a sample consisting of the program counters on the currently executing goroutine’s stack.——Profiling Go Programs)你可以发现列出来的时间全都是10ms的整数倍。现在我们可以看出占用CPU时间最多的就是clean函数里的正则替换。
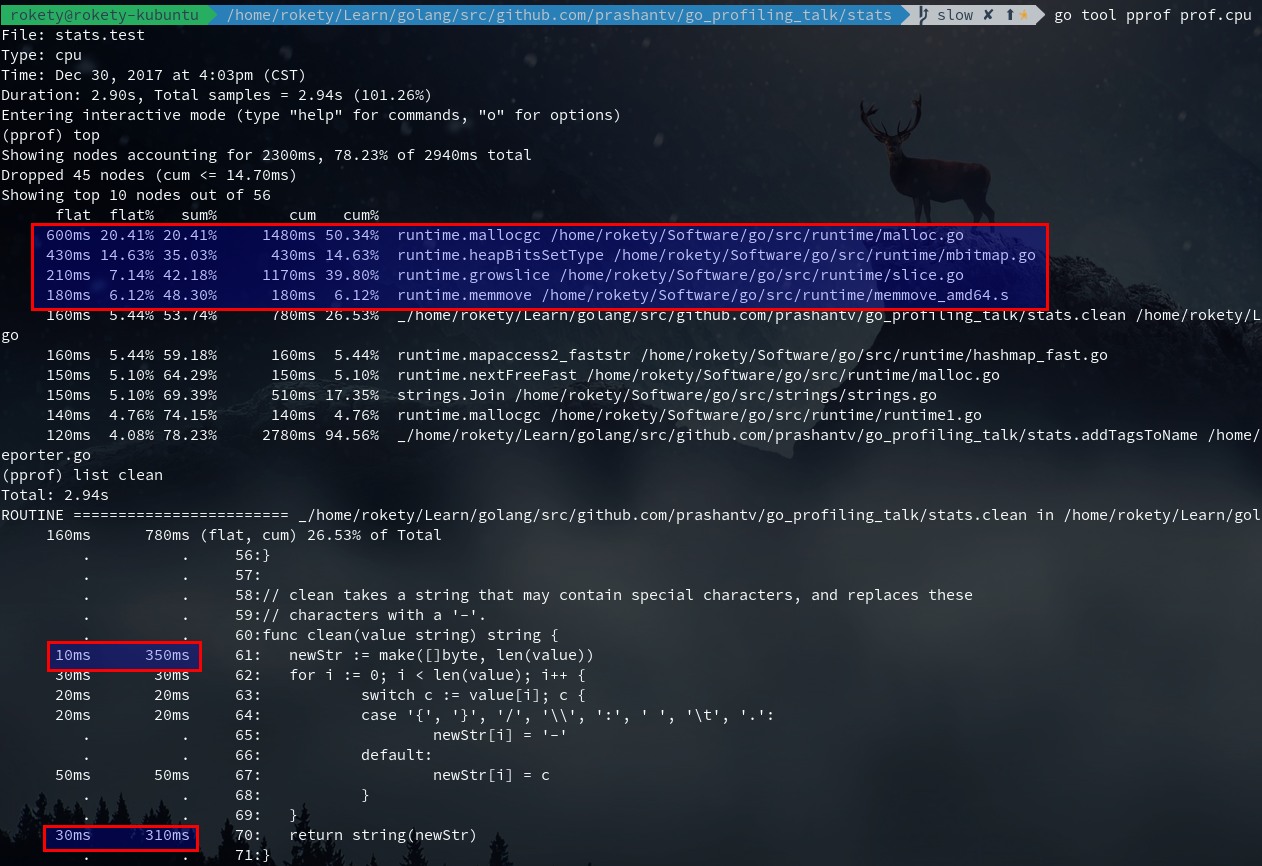
将正则替换改为字符替换,对应的commit,再次执行benchmark:

如下图,从top可以看出红框中的runtime.*的调用占用最多CPU,从list clean也可以看出make()和string()占用了许多CPU:
我们还可以看下clean的汇编结果:
(pprof) disasm clean
Total: 2.94s
ROUTINE ======================== _/home/rokety/Learn/golang/src/github.com/prashantv/go_profiling_talk/stats.clean
     160ms      780ms (flat, cum) 26.53% of Total
                                ……
         .      340ms     4ee07b: CALL runtime.makeslice(SB)                 ;_/home/rokety/Learn/golang/src/github.com/prashantv/go_profiling_talk/stats.clean reporter.go:61
                                ……
         .      280ms     4ee119: CALL runtime.slicebytetostring(SB)         ;_/home/rokety/Learn/golang/src/github.com/prashantv/go_profiling_talk/stats.clean reporter.go:70
                                ……
(……表示省略了部分输出结果)从汇编结果中可以看出runtime.makeslice和runtime.slicebytetostring占用的CPU时间多,然而这里并没有我们能优化的,我们再看下addTagsToName:
append占用了不少CPU时间的,主要由于slice的扩容,我们可以看下addTagsToName的汇编确认下:
(pprof) disasm addTagsToName
Total: 2.94s
ROUTINE ======================== _/home/rokety/Learn/golang/src/github.com/prashantv/go_profiling_talk/stats.addTagsToName
     120ms      2.78s (flat, cum) 94.56% of Total
                                ……
         .      870ms     4ede3b: CALL runtime.growslice(SB)                 ;_/home/rokety/Learn/golang/src/github.com/prashantv/go_profiling_talk/stats.addTagsToName reporter.go:52
                                ……
         .      200ms     4edf65: CALL runtime.growslice(SB)                 ;_/home/rokety/Learn/golang/src/github.com/prashantv/go_profiling_talk/stats.addTagsToName reporter.go:43
                                ……
         .      130ms     4edfb1: CALL runtime.growslice(SB)                 ;_/home/rokety/Learn/golang/src/github.com/prashantv/go_profiling_talk/stats.addTagsToName reporter.go:41
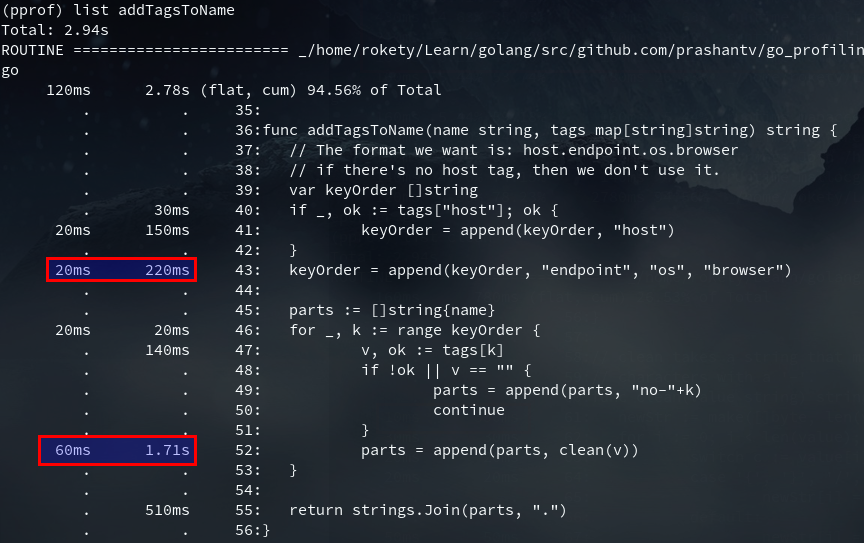
从addTagsToName的代码逻辑中可以分析出,我们可以通过make创建好需要的slice容量,此优化对应的commit,优化后append操作占用的CPU时间下降了不少:

addTagsToName返回值是将一个slice通过join后得到的string,那么这里可以考虑使用bytes.Buffer来代替slice,看看是否能带来一些性能提升,此优化对应的commit:
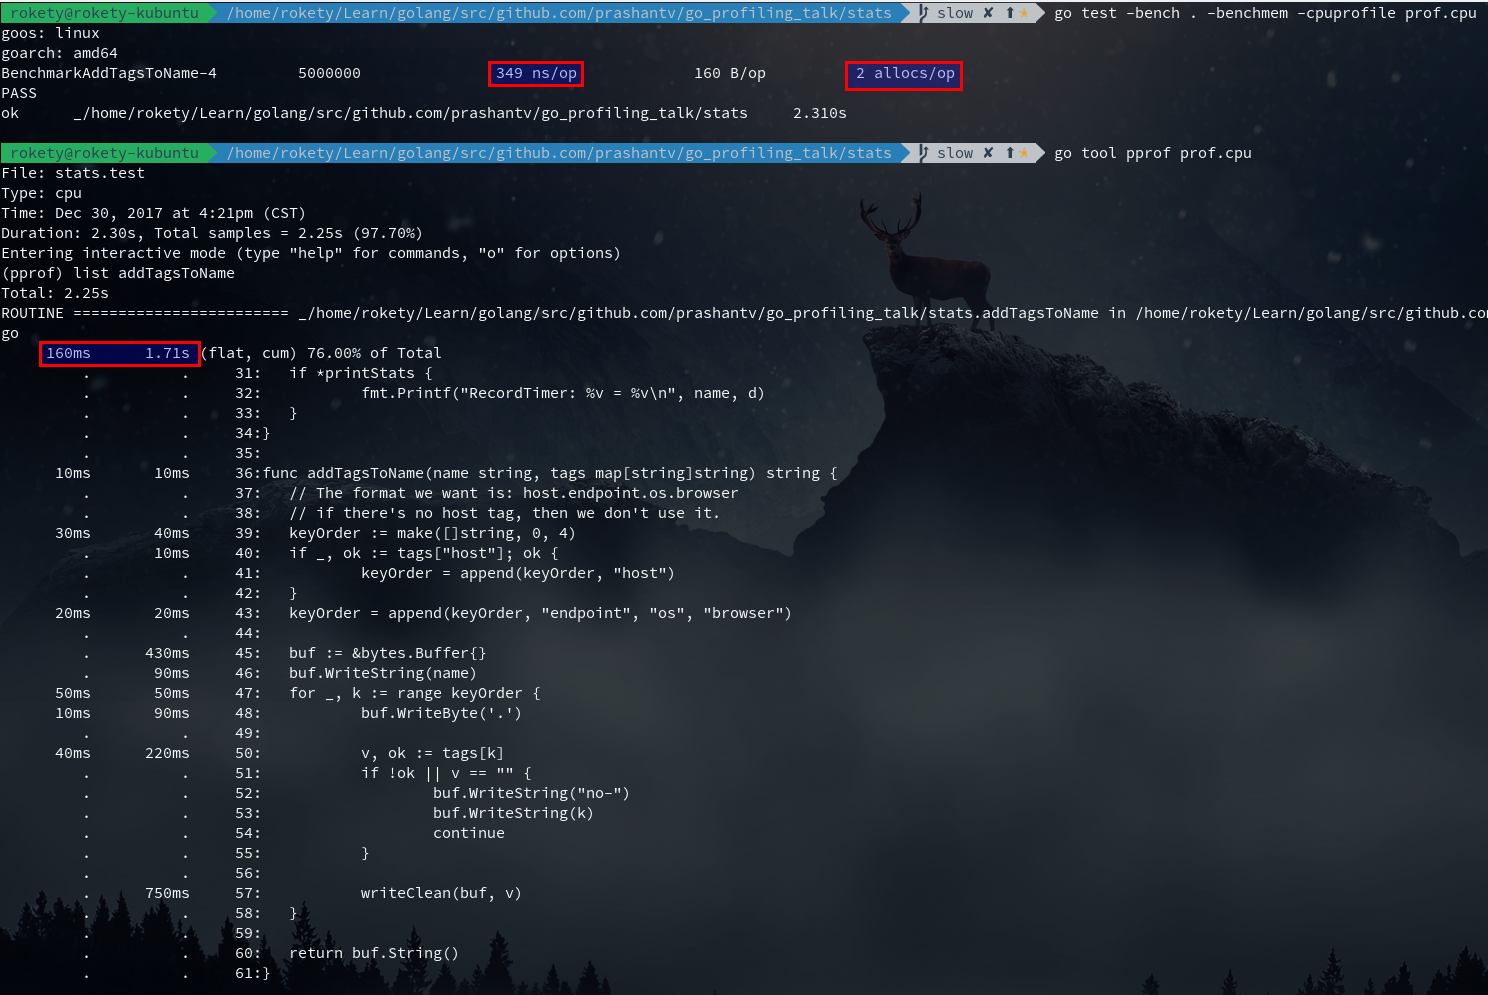
从上图看出,list addTagsToName性能提升并不明显,但Benchmark的结果可以发现ns/op和allocs/op,以及执行的次数都有所提升,在Benchmark这种大压力执行下,整体性能提升不少。
现在来看还有2个allocs,执行go test -bench . -benchmem -memprofile prof.mem看下内存分析结果:
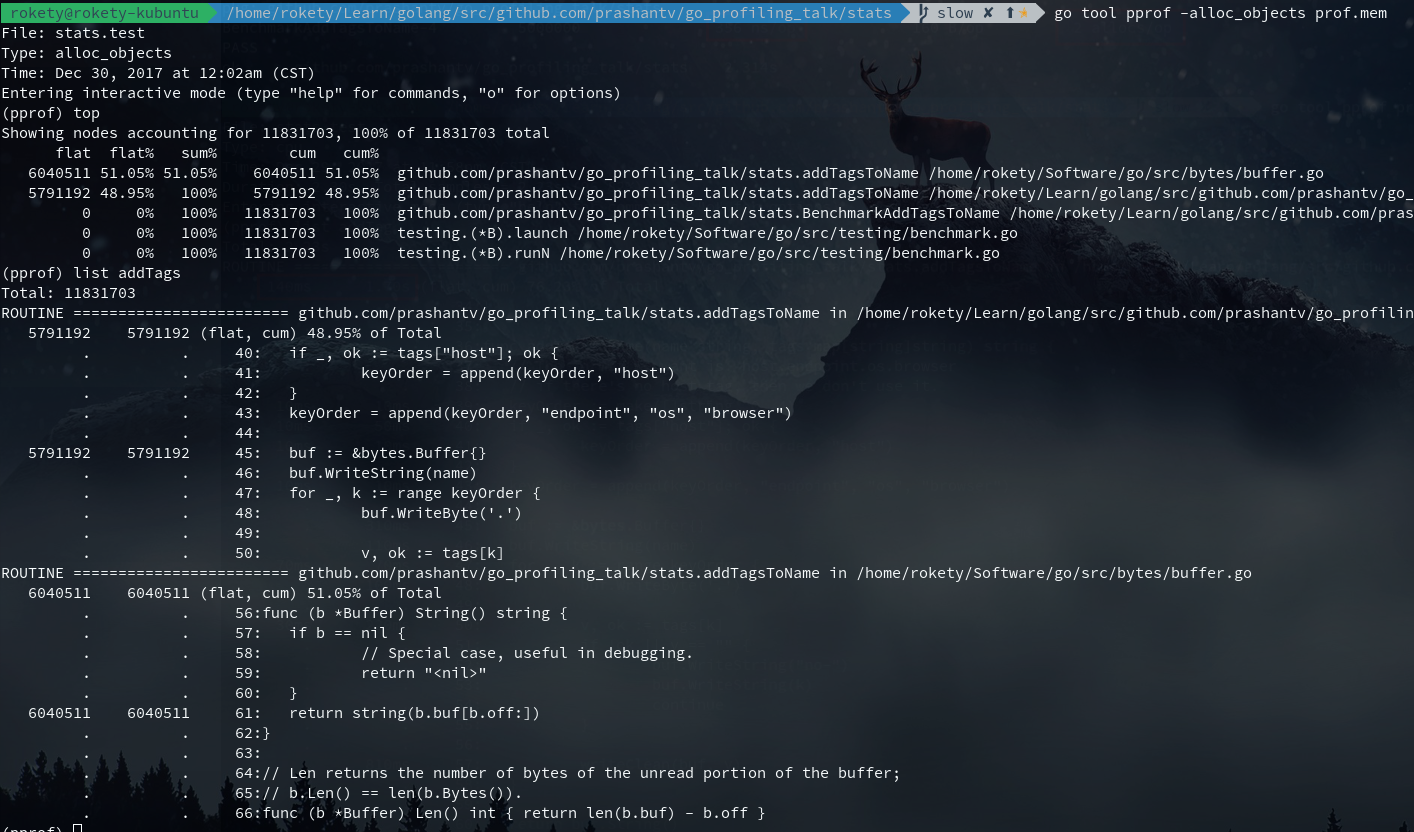
从上图可以看到2个allocs,一个在buffer.go中,这个我们没法优化掉,一个在addTagsToName中,是给bytes.Buffer分配内存,这个是否可以优化掉呢?Golang提供了sync.Pool可以用来缓存对象,尝试下是否能够得到性能提升,对应的代码修改如下:
var bufPool = sync.Pool{
	New: func() interface{} {
		return &bytes.Buffer{}
	},
}

func addTagsToName(name string, tags map[string]string) string {
	// The format we want is: host.endpoint.os.browser
	// if there's no host tag, then we don't use it.
	keyOrder := make([]string, 0, 4)
	if _, ok := tags["host"]; ok {
		keyOrder = append(keyOrder, "host")
	}
	keyOrder = append(keyOrder, "endpoint", "os", "browser")

	 buf := bufPool.Get().(*bytes.Buffer)
	 defer bufPool.Put(buf)
	 buf.Reset()
	//buf := &bytes.Buffer{}
	buf.WriteString(name)
	for _, k := range keyOrder {
		buf.WriteByte('.')

		v, ok := tags[k]
		if !ok || v == "" {
			buf.WriteString("no-")
			buf.WriteString(k)
			continue
		}

		writeClean(buf, v)
	}

	return buf.String()
}
执行下Benchmark,可以发现ns/op增加了一点,这个其实主要是因为defer的执行也会占用不少CPU,改为不使用defer,对比Benchmark结果,ns/op下降了一些:
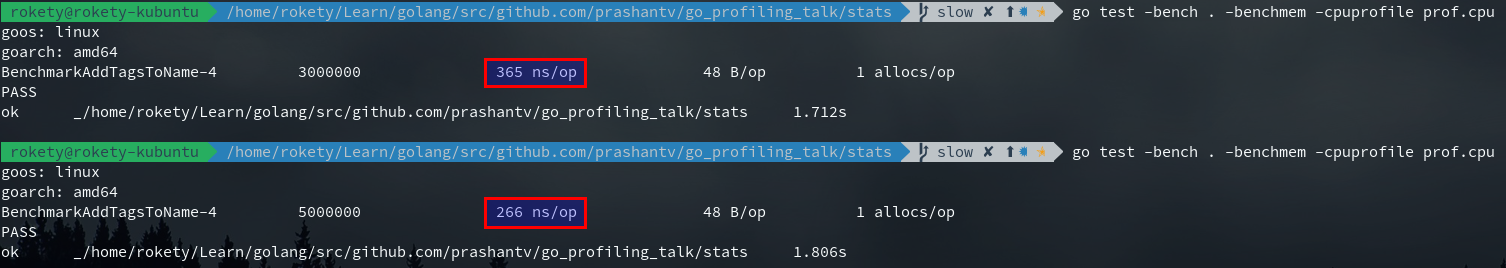
然而,上面的优化(使用sync.Pool和不使用defer)所带来的性能提升并不明显,反而增加了代码的维护成本,所以最终实现的代码是这样子的commit。
目前优化就到此结束了,来看下优化后的性能表现如何:
1、进行5秒钟的CPU性能采样并打开一个交互界面:go tool pprof -seconds 5 http://localhost:9090/debug/pprof/profile
下载 CPU 性能采样文件:curl http://localhost:9090/debug/pprof/profile?seconds=5 -o profile.prof
- topN:显示N个占用CPU时间最多的函数
- topN -cum:显示N个占用CPU时间(包括其调用的子函数)最多的函数
- list regex:显示与正则regex匹配的函数的代码
- disasm regex:显示与正则regex匹配的函数的汇编代码
Type: cpu
Time: Feb 21, 2021 at 11:02pm (CST)
Duration: 10.10s, Total samples = 28.41s (281.20%)
Entering interactive mode (type "help" for commands, "o" for options)
(pprof) top
Showing nodes accounting for 25200ms, 88.70% of 28410ms total
Dropped 266 nodes (cum <= 142.05ms)
Showing top 10 nodes out of 67
      flat  flat%   sum%        cum   cum%
   12490ms 43.96% 43.96%    12570ms 44.24%  syscall.syscall
    3990ms 14.04% 58.01%     4000ms 14.08%  runtime.kevent
    1980ms  6.97% 64.98%     1990ms  7.00%  runtime.nanotime1
    1820ms  6.41% 71.38%     1820ms  6.41%  runtime.pthread_cond_wait
    1650ms  5.81% 77.19%     1650ms  5.81%  runtime.pthread_cond_signal
    1190ms  4.19% 81.38%     1190ms  4.19%  runtime.usleep
     770ms  2.71% 84.09%     4790ms 16.86%  runtime.netpoll
     500ms  1.76% 85.85%      500ms  1.76%  indexbytebody
     440ms  1.55% 87.40%     5760ms 20.27%  internal/poll.(*FD).Read
     370ms  1.30% 88.70%      890ms  3.13%  net/http.(*connReader).backgroundRead
- Type: 文件类型
- TIME: 采样时间点
- Duration: 采样持续时间
- Total samples: 所有函数执行时间之和
- flat: 函数自己执行了多少时间
- flat%: flat/Total samples
- sum%: 第 n 行的值等于第 1~n 行的 flat% 之和
- cum: 函数自己,以及调用的子函数执行时间之和
- cum%: cum/Total samples
- 采样粒度,通过 option.granularity 调整
2、进行压力测试并产生CPU和内存分析文件:go test -bench . -benchmem -cpuprofile prof.cpu -memprofile prof.mem
3、打开CPU分析文件:go tool pprof prof.cpu
4、打开内存分析文件:go tool pprof -alloc_objects stats.test prof.mem
5、进行5秒钟的CPU性能采样并生成火焰图:go-torch --seconds 5 http://localhost:9090/debug/pprof/profile
6、从CPU分析文件中生成火焰图:go-torch --binaryname stats.test -b prof.cpu
7、显示内联函数,逃逸分析情况:go build -gcflags=-m .
8、获取内存使用信息:go tool pprof http://127.0.0.1:6060/debug/pprof/heap
下载内存使用信息:curl ‘127.0.0.1:6060/debug/pprof/heap’ -o mem.prof options.sample_index 可以切换查看采样类型,执行 options 可以查看当前的选项值
9、获取跟踪文件:curl http://127.0.0.1:6060/debug/pprof/trace?seconds=10 > trace.out,打开 go tool trace trace.out
10、其他 pprof 数据下载:curl '127.0.0.1:6060/debug/pprof/[goroutine|block|mutex]' -o xxx.prof
11、以 web 交互式打开 go tool pprof -http 127.0.0.1:6661 cpu.prof
性能分析总结
- 不要过早的优化:Go 提供了非常便捷的方式帮助我们分析代码,无论是通过本地的压测还是在生产环境。go-torch能帮助你找到热点的函数。
- 减少在热点路径上的内存分配:为热点路径编写压测用例。使用-benchmem和内存分析找到在哪里发生了内存分配,并尽量优化掉。一个内存分配意味着一个可能的GC,GC会增加请求的延迟。
- 不要害怕查看汇编代码:有时内存分配和时间消耗不能清晰地从我们的代码里看出来,那就尝试看下汇编结果,通常你能从中找到导致内存分配和时间消耗的函数(例如runtime.convI2E)。
Recommend
About Joyk
Aggregate valuable and interesting links.
Joyk means Joy of geeK