

Power BI - How to add Reports to Dashboards?
source link: https://www.geeksforgeeks.org/power-bi-how-to-add-reports-to-dashboards/
Go to the source link to view the article. You can view the picture content, updated content and better typesetting reading experience. If the link is broken, please click the button below to view the snapshot at that time.

Reports can be transformed into dashboards, for viewing and explaining purposes. One can add a complete report, to the dashboard, or components of it can also be added. We could also add multiple reports and their components in a single dashboard. In this article, we will learn how to add reports to dashboards.
Creating a Dashboard in Power BI
One can create its own dashboard from the workspace itself. For example, we have a workspace name, geeks_for_geeks, and we want to create a dashboard, name, gfg_dashboard.
The following are the steps:
Step 1: Go to the required workspace. For example, geeks_for_geeks. Click on the +New button. A drop-down list appears. Click on the Dashboard, to create a new dashboard.

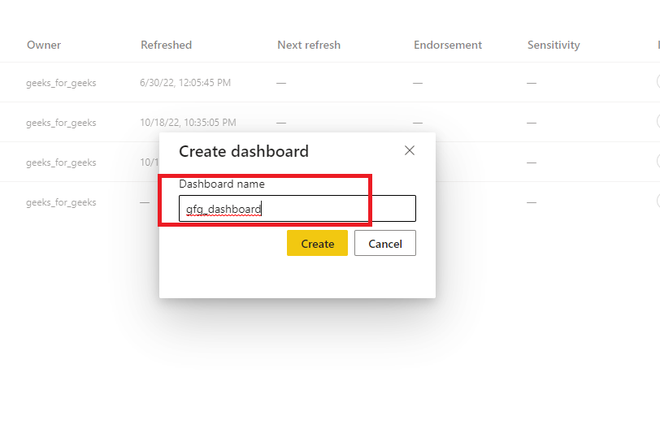
Step 2: A dialogue box name, Create dashboard appears. Write the name of the dashboard. For example, gfg_dashboard.
Step 3: An empty dashboard is created.
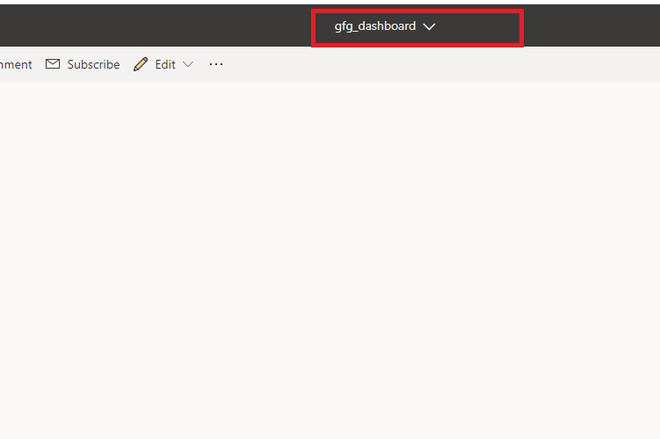
Step 4: One can also view that dashboard is added in the workspace also.

Adding a Complete Report to a Dashboard in Power BI
As we have created a dashboard successfully. Now, we can add an entire report to the dashboard. For example, you are given a report report1, and you want to add this report to a dashboard.
Following are the steps:
Step 1: Go to the required workspace. Click on the report for which you want to pin it to the dashboard. For example, report1.

Step 2: In the top navigation bar, we can see three dots. Click on it. A drop-down list appears. Click on the Pin to a dashboard.

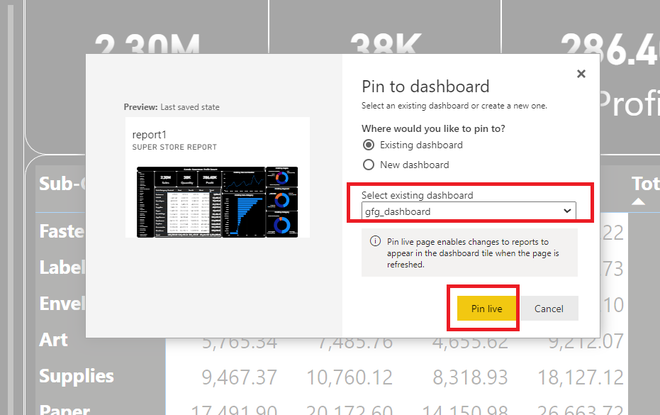
Step 3: A new dialogue box name, Pin to dashboard is opened. Click on the existing dashboard radio button. Select the dashboard. For example, gfg_dashboard. Click on the Pin live button.
Step 4: On the right side of the page, a new dialogue box name, Pinned to dashboard appears. Click on Go to dashboard.

Step 5: An entire report is added, in the gfg_dashboard successfully.

Adding components of multiple reports in a dashboard
We can also add multiple reports and their components in a single dashboard. For example, if we want to add a card from report1, and a graph from report2, in a dashboard name, gfg_dashboard.
Following are the steps:
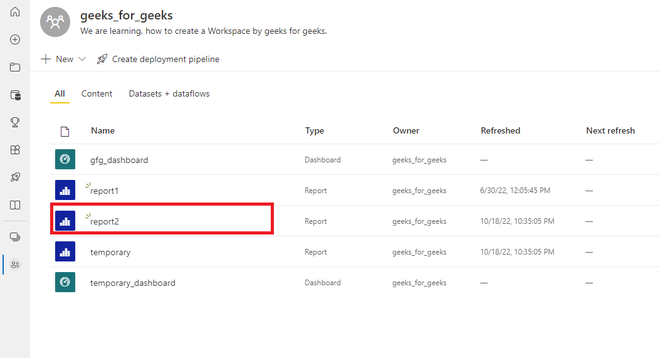
Step 1: Go to the required workspace. Now, we have 2 reports available. Click on the repor1.

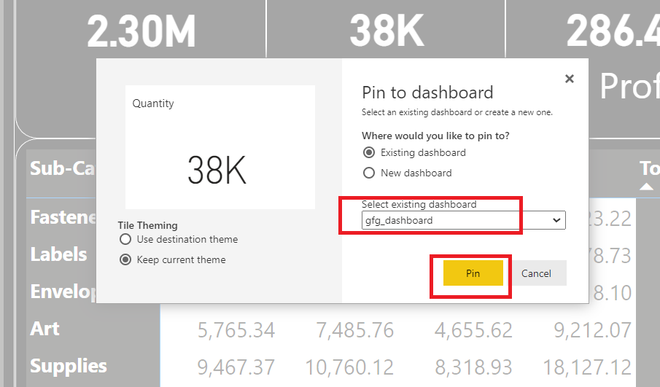
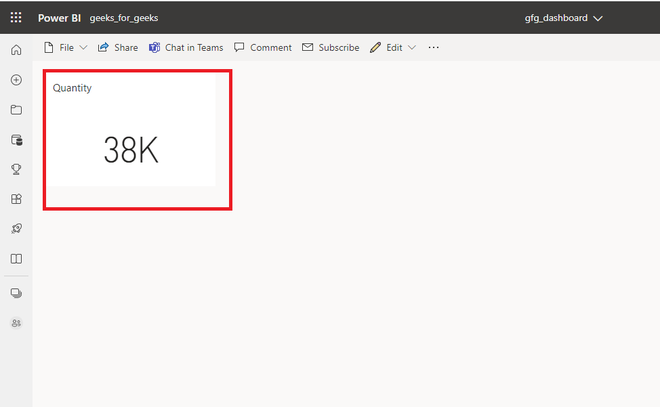
Step 2: Our, task is to add a card name, Quantity to the dashboard. Hover on the card. Now, click on the Pin visual button.

Step 3: A dialogue box name, Pin to dashboard appears. As we want to add this card in gfg_dashboard, so click on the Pin button.
Step 4: A card name, Quantity is successfully added to the dashboard.
Step 5: Revert back to your workspace. Select report2.
Step 6: Our task is to add, the below-shown graph to our dashboard. Hover over the graph. Click on the Pin visual button.
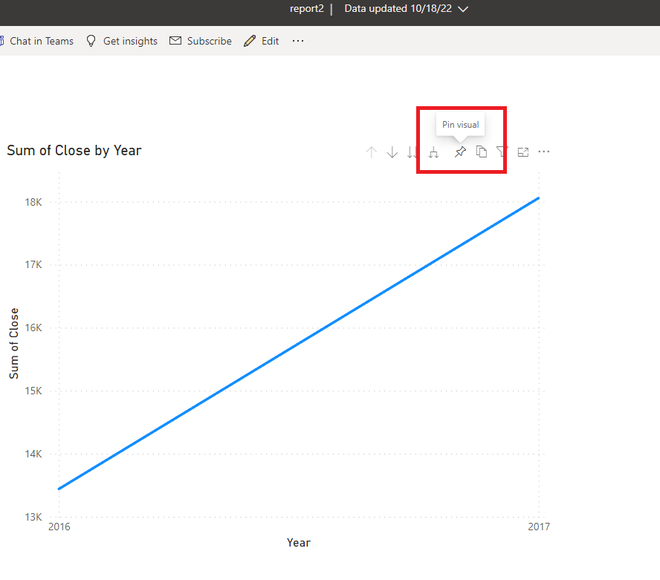
Step 7: A new dialogue box name, Pin to dashboard appears. As we want to add this graph in gfg_dashboard. Click on the Pin button.
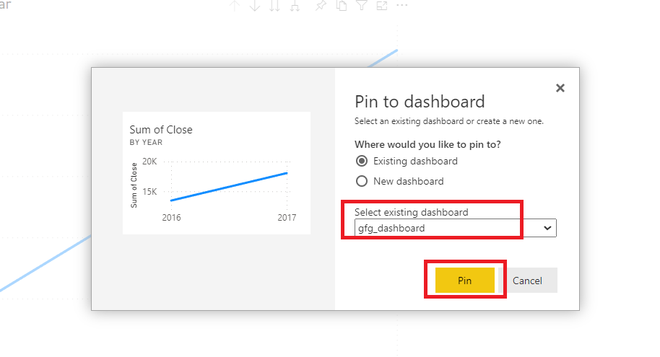
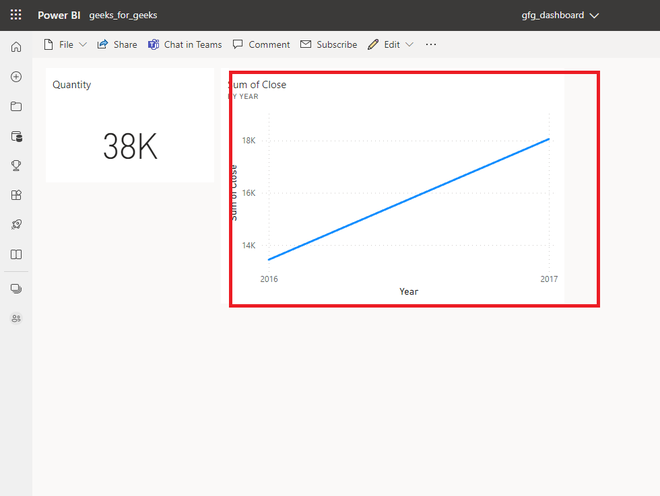
Step 8: A new graph is added to the same dashboard. We have successfully added a card and a graph from different reports in a dashboard.
</div
Recommend
About Joyk
Aggregate valuable and interesting links.
Joyk means Joy of geeK