

Intel Core i7-14700K 搭配 GIGABYTE Z790 AORUS Elite X WiFi7 實測
source link: https://benchlife.info/intel-core-i7-14700k-with-gigabyte-z790-aorus-elite-x-wifi7-review/
Go to the source link to view the article. You can view the picture content, updated content and better typesetting reading experience. If the link is broken, please click the button below to view the snapshot at that time.

Intel Core i7-14700K 搭配 GIGABYTE Z790 AORUS Elite X WiFi7 實測

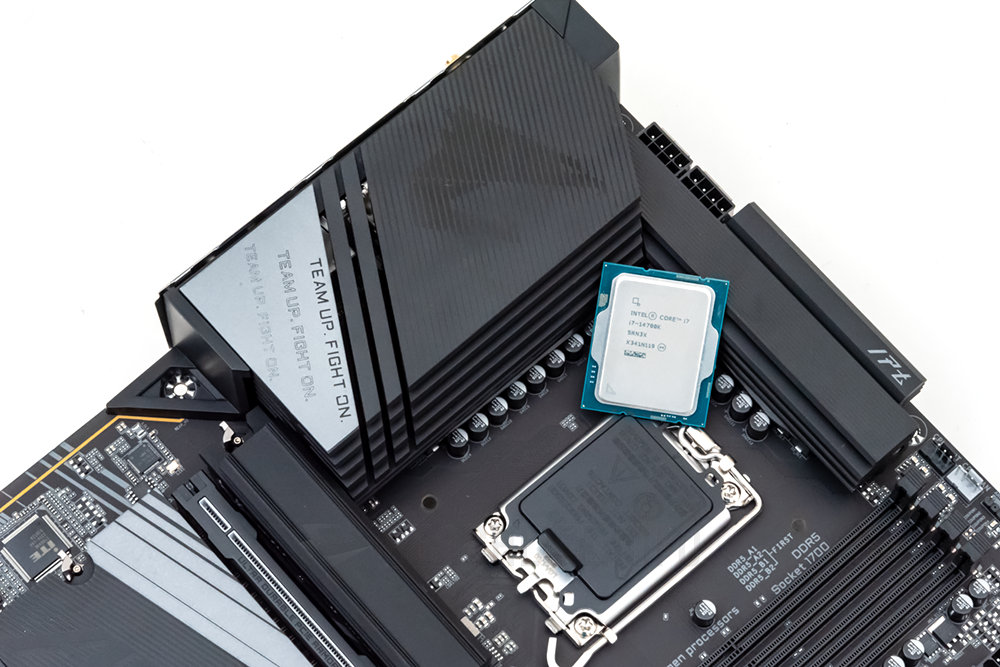
Core i7-14700K 比 Core i7-13700K 多了 4 個 E-core 核心,被視為 Raptor Lake Refresh 最超值一款處理器,搭配萬元不到的 Z790 AORUS Elite X WiFi7 主機板,Wi-Fi 7 無線網路、APO 等機能性全數輕鬆擁有。
Core i7-14700K 重點概述
Core i7-14700K 可謂加量不加價,Intel 公布的參考價格為 409 美元,和前一代 Core i7-13700K 相同。但是核心設計配置規模提升到 8 P-core + 12 E-core,合計為 20 核心、28 執行緒,相較於 8 P-core + 8 E-Core 的 Core i7-13700K,多了 4 個 E-core 核心(等於 1 個 E-core 群組)。

Intel 推出第 12 代(代號 Alder Lake)Core 處理器時曾提到,E-core 效能和代號 Skylake 的第 6 代產品相比,是有過而無不及並且相當省電。基於這差異,Core i7-14700K 尤其在多執行緒運算,將能與 Core i7-13700K 拉開更多距離,再者是這次微更新有拉高一些時脈也是有所助益。
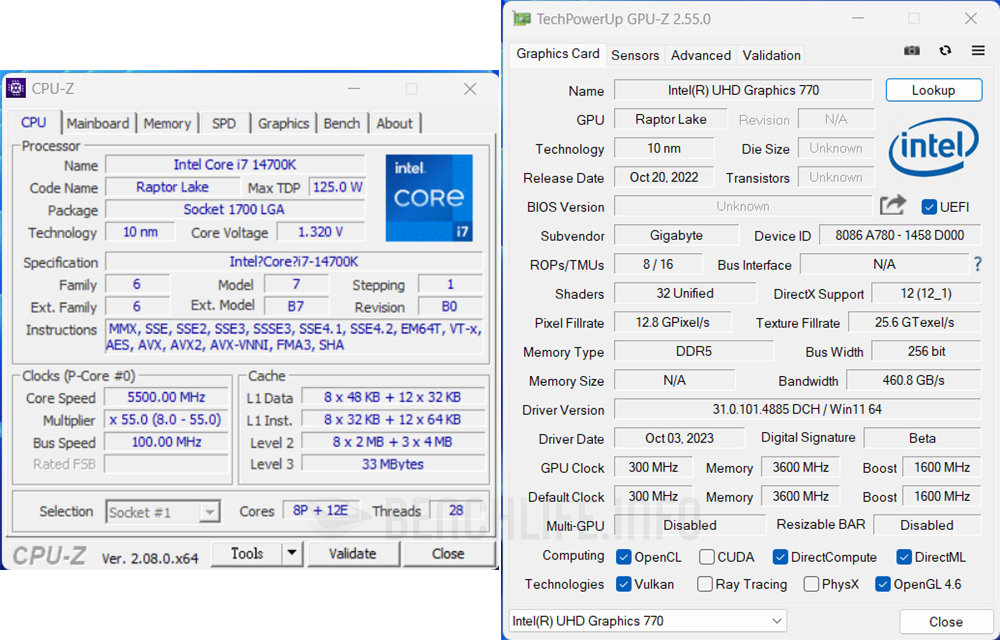
因應 E-core 數量增加,其 Intel Smart Cache 連動由 30MB 增加至 33MB,而 L2 Cache 總數也從 24MB 變為 28MB。Core i7-14700K 時脈設置為 P-core 基礎 3.4GHz、加速最高 5.6GHz,E-core 相對應設定分別為 2.5GHz、4.3GHz,和 Core i7-13700K 相比主要是加速時脈拉高 2 或 1 個倍頻。
其餘特性規格大致上相仿,像是基礎功耗 125W、加速功耗 253W,雖然加速功耗實際值還得視主機板 UEFI BIOS 設計而定。稍有差異或說 DLC 付費解鎖的部分,Core i7-14700K / KF 如同 Core i9-14900K / KF,也支援 Intel APO 和 Intel DTT 這些新機能,惟並未包含 Intel AI Assist。
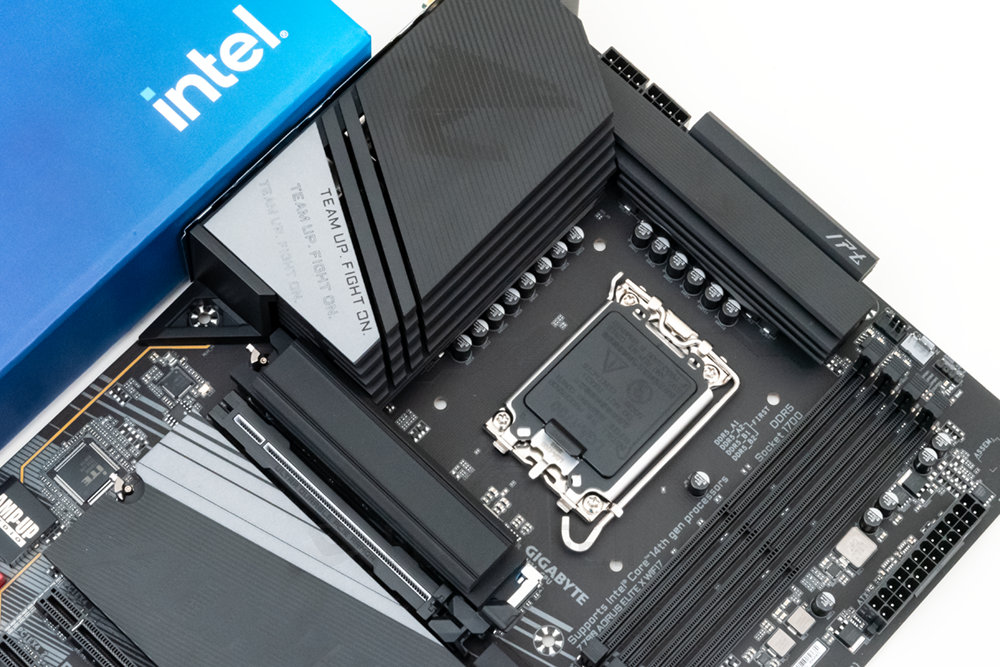
Z790 AORUS Elite X WiFi7 開箱看
Z790 AORUS Elite X WiFi7 前身為 Z790 AORUS Elite AX,伴隨 Intel 那 Refresh 策略進行了微改款,除了導入 Wi-Fi 7 也更換乙太網路控制器方案。雖說沒有跟風支援 PCIe 5.0 NVMe,但是 M.2 散熱片加入 EZ-Latch Plus 免工具快拆設計,藉由便利性提高組裝友善程度。
在 GIGABYTE 產品線規劃裡,AORUS Elite 系列是萬元以內價格帶的主打商品,Z790 AORUS Elite AX 目前市場參考價格約 8,490 元。經過前述微更新的 Z790 AORUS Elite X WiFi7,其建議售價應該難免也是漲破萬元,不過在零售通路市場大約能以 9,990 元購買到。
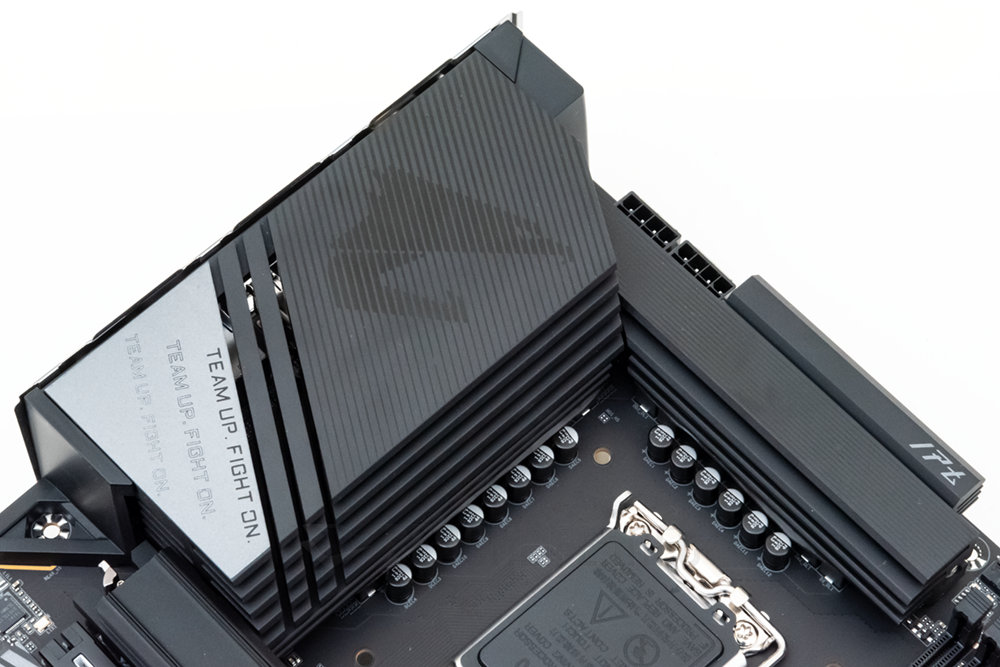
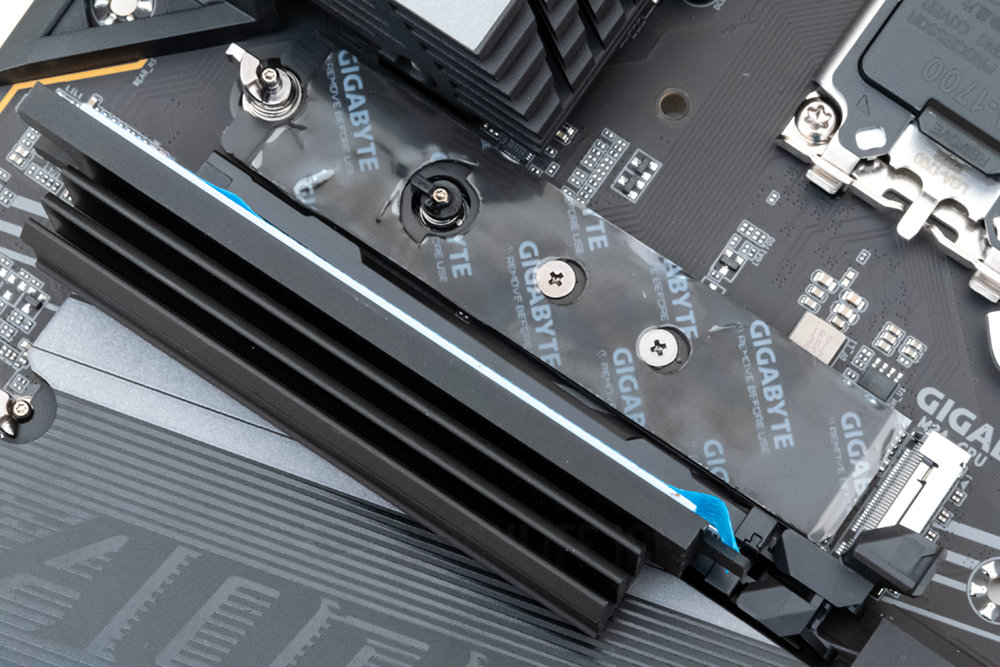
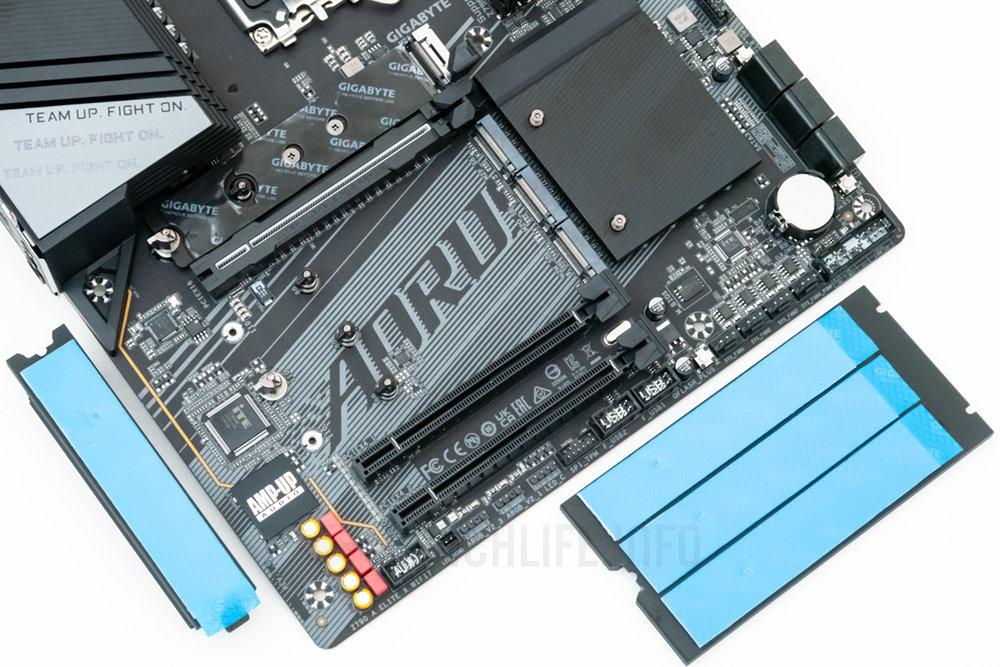
既然是 Refresh 而來的孿生產品,線路設計布局與外觀視覺,自然是拿舊有基礎進行修改調整。GIGABYTE 為散熱片加入更多的條紋裝飾點綴,品牌代表性標誌神鷹也轉移到 I/O 遮罩上,其餘如同為第 1 組的 M.2 散熱片和 PCIe 插槽,也改成全黑處理統一色調。
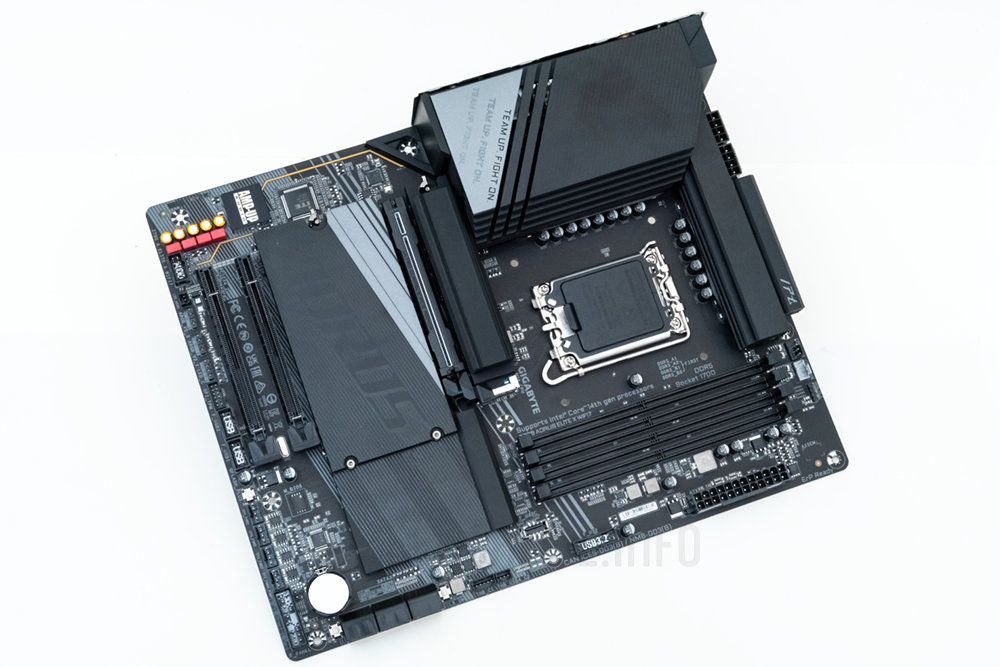
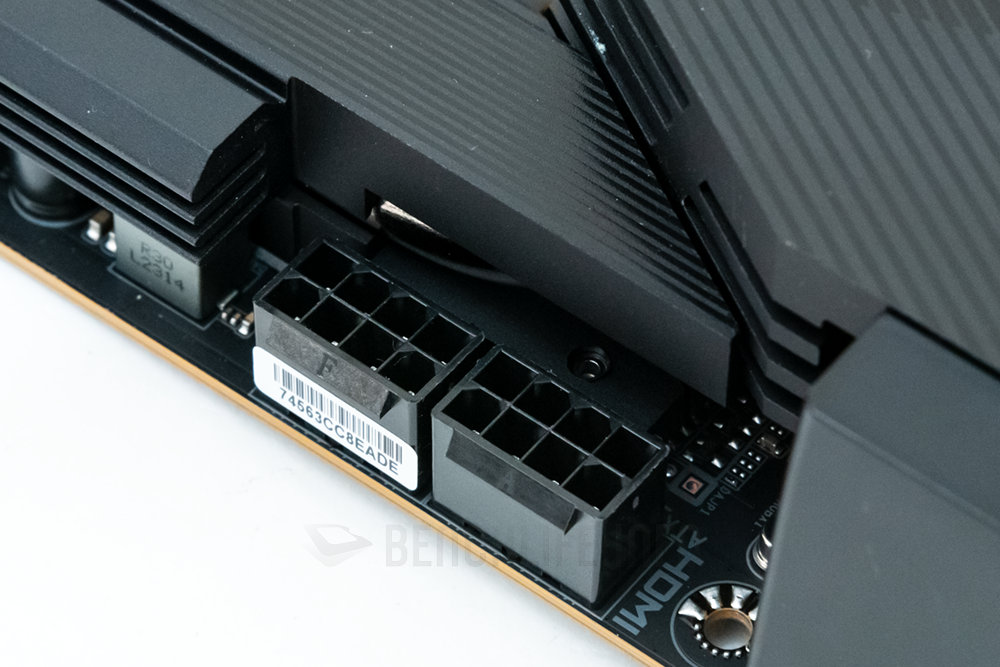
Z790 AORUS Elite X WiFi7 的 VRM 採用數位並聯式設計,16 + 1 + 2 相迴路使用 90A 和 60A 功率級晶片等元件構成,搭配 2 組 8pin 電源輸入插座。名為 VRM Thermal Armor Advanced 的散熱結構中,包含使用 8mm 熱導管、7W/mk 導熱墊,散熱片亦加大延伸成為 I/O 遮罩。
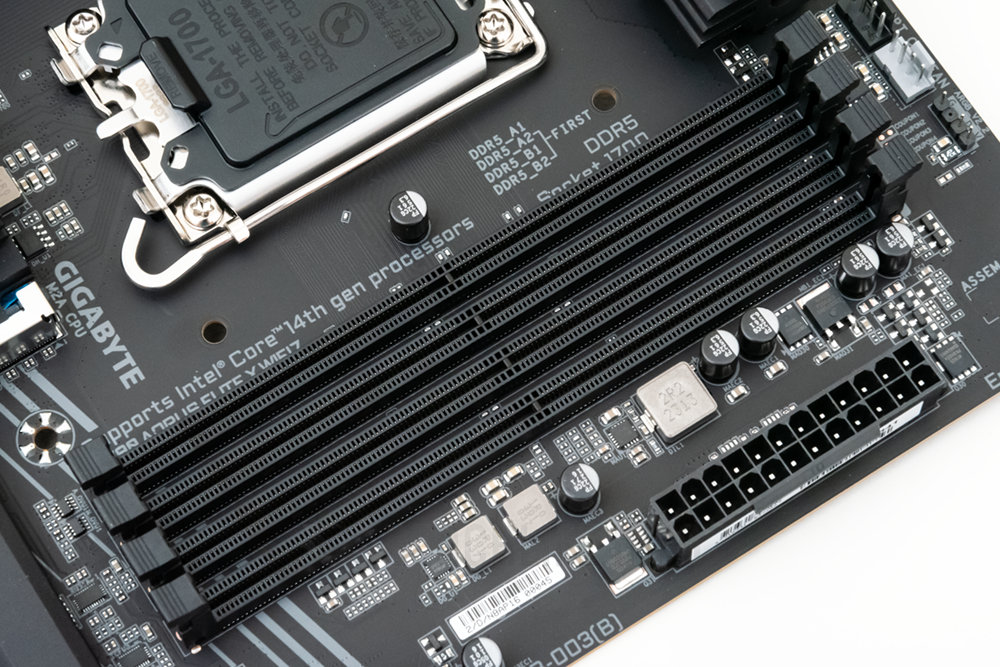
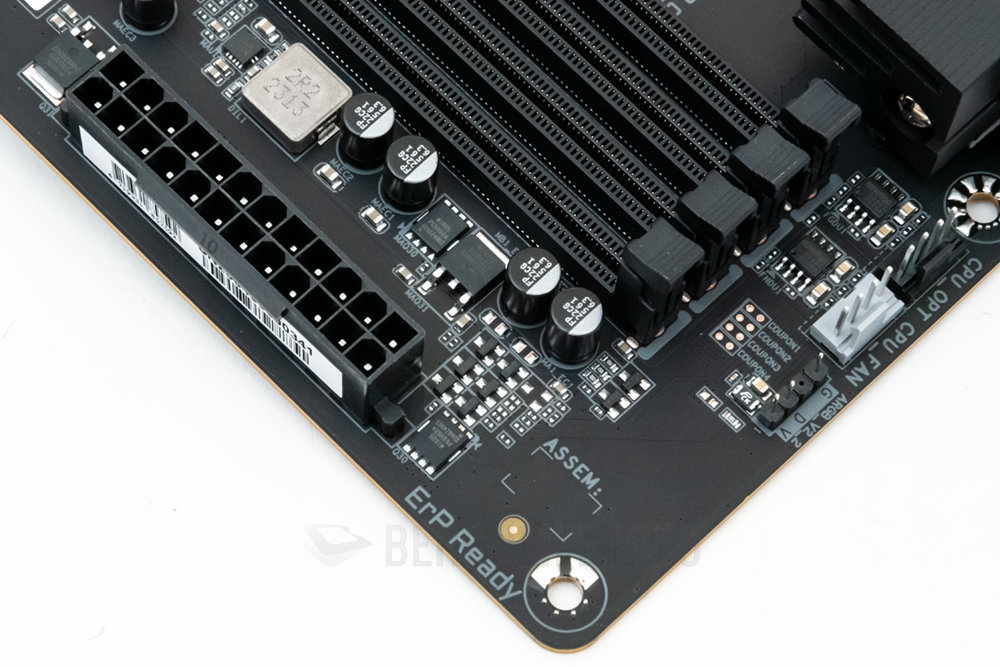
記憶體的可玩性能讓玩家感到欣喜,標示超頻支援達 DDR5-8266(1DPC、1R),反觀前代 Z790 AORUS Elite AX 是 DDR5-7600。GIGABYTE 在設計調校、驗證下了不少功夫,QVL 已經提供不少款 DDR5-8266 / 8000 產品供參考,得搭配第 14 代 Core 處理器才能有最佳效果。
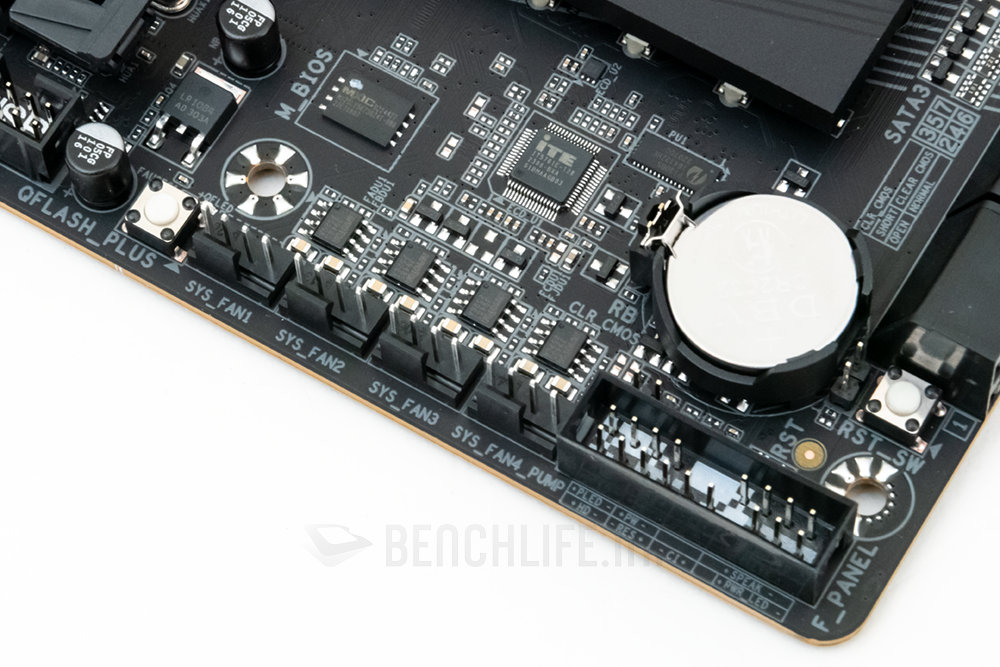
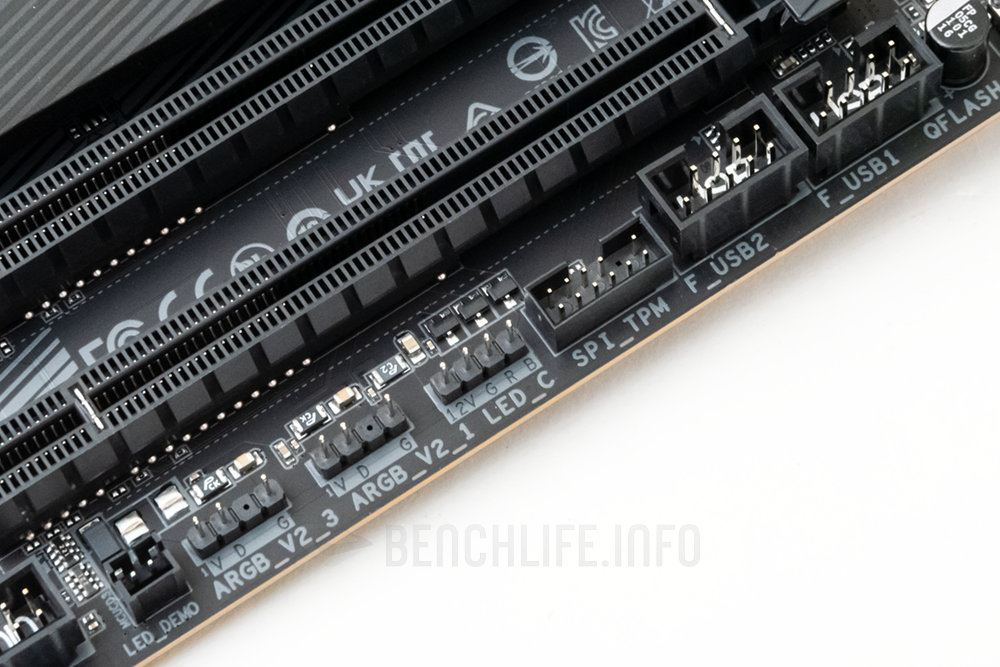
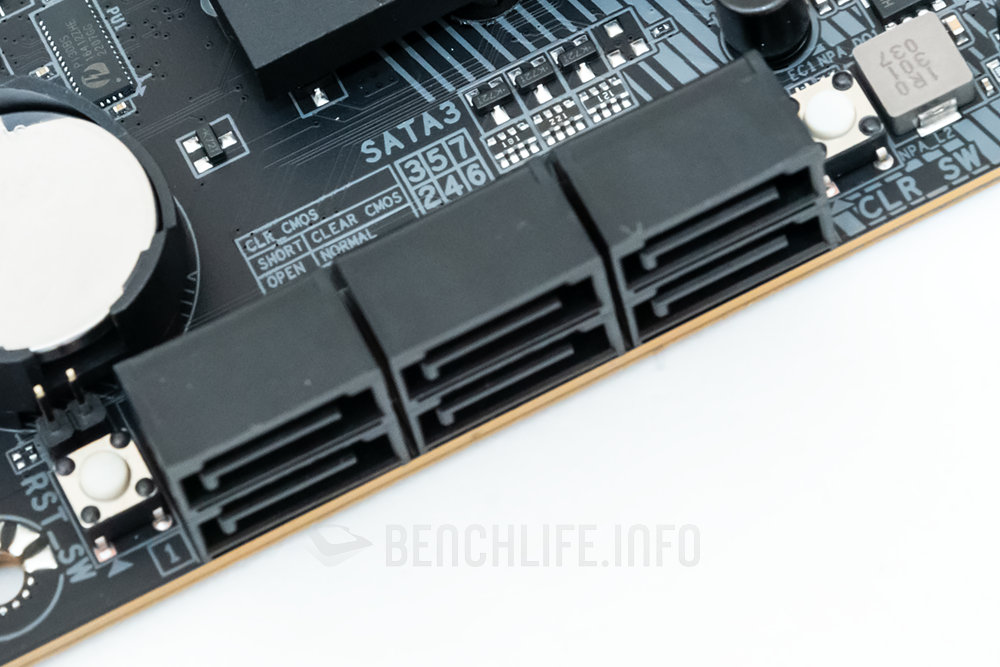
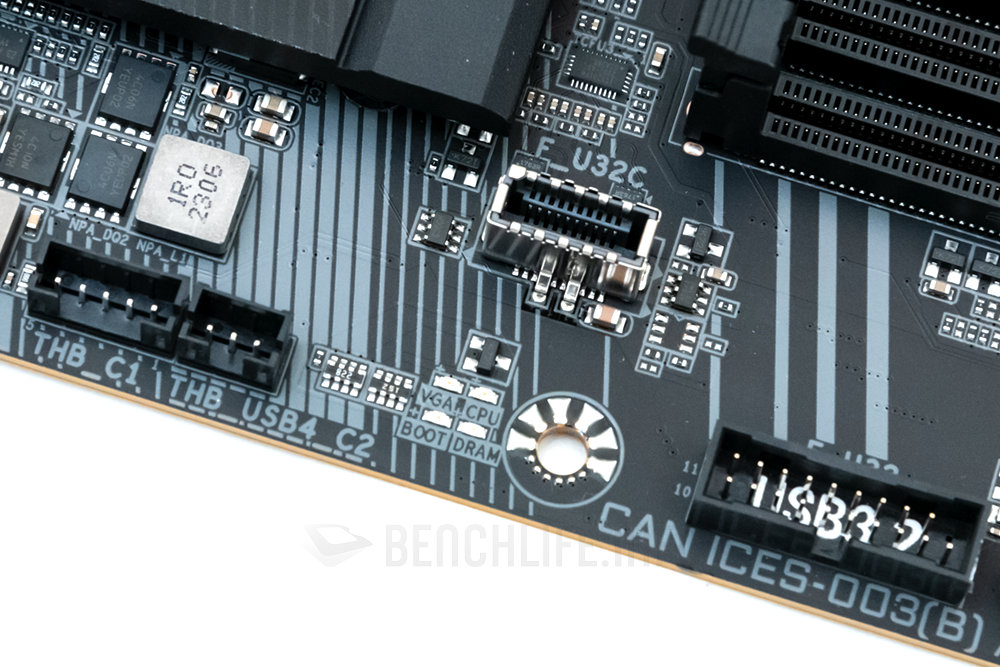
它維持提供 6 組 4pin 風扇插座,支援涵蓋水冷風扇和幫浦,燈效相關插座調整成 3 組可編程 RGB Gen2 LED、1 組 RGB LED。其餘還有如 COMS 清除、Q-Flash Plus、系統重置等 3 個按鈕,而 Thunderbolt 擴充子卡插座雖然沒有多加描述,看來也加入了 USB4 相對應支援規劃。
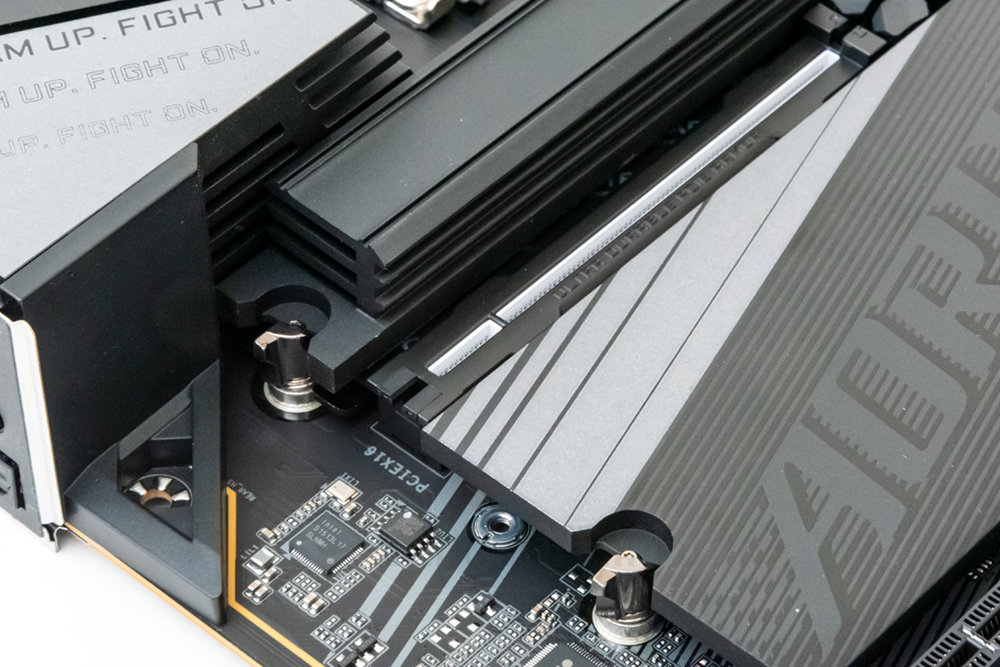
其 PCIe 維持 3 組 x16 形式插槽配置,第 1 組由處理器供應 PCIe 5.0 x16 通道,同時採用 PCIe UD Slot X 強化插槽,以及方便拆卸顯示卡的 PCIe EZ-Latch 設計。其餘 2 組由 Z790 晶片組供應 PCIe 4.0 x4 通道,反觀前代 Z790 AORUS Elite AX,第 3 組的配置僅為 PCIe 3.0 x4。
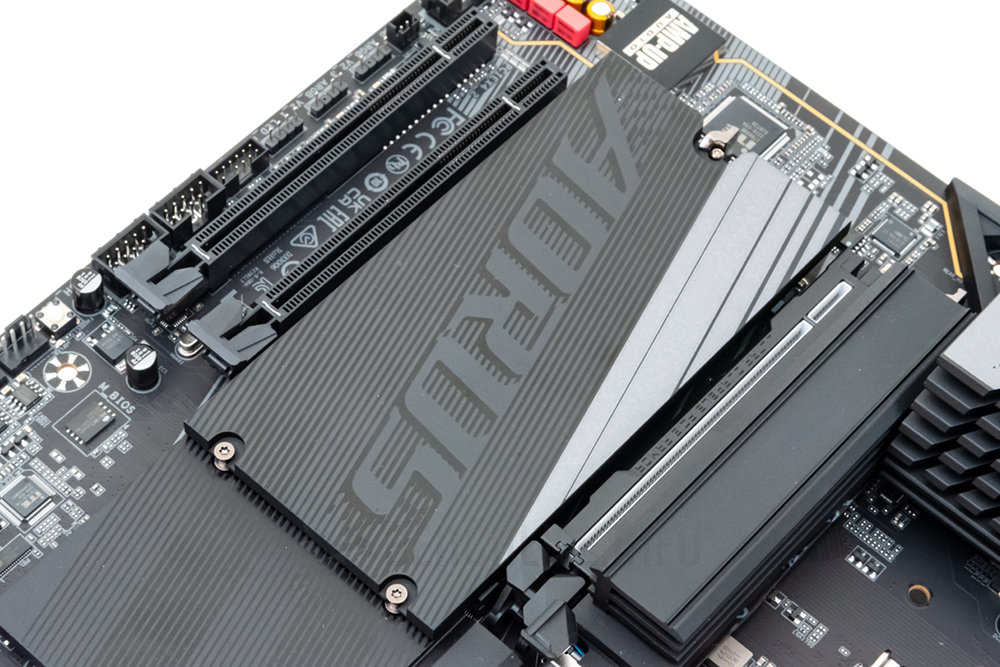
數量維持在 4 組 M.2 插槽,GIGABYTE 加強了組裝友善,全都配備 M.2 EZ-Latch Click 和 M.2 EZ-Latch Plus 免工具拆裝設計。其中由處理器供應 PCIe 4.0 x4 獨立通道的第 1 組,結合 M.2 Thermal Guard L 散熱片、散熱背板、導熱墊等設計,另外第 4 組同時也支援 SATA 6Gb/s 介面。
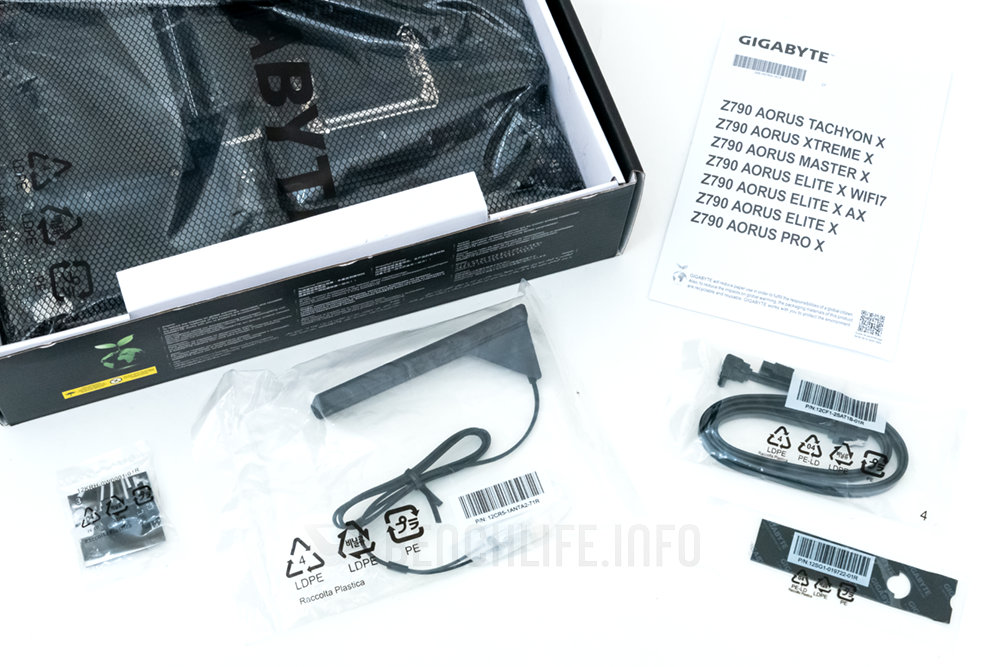
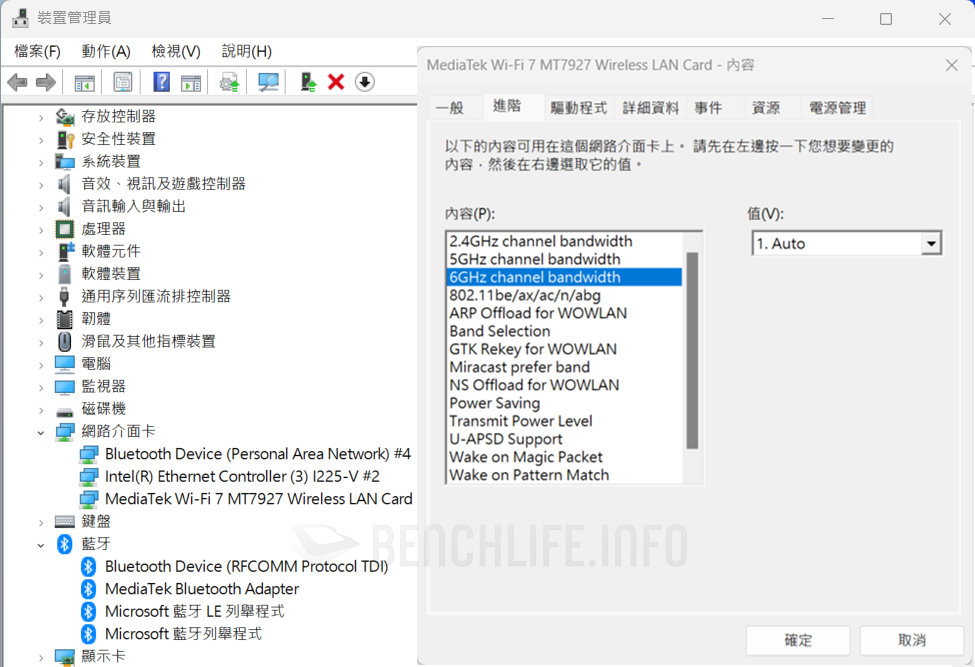
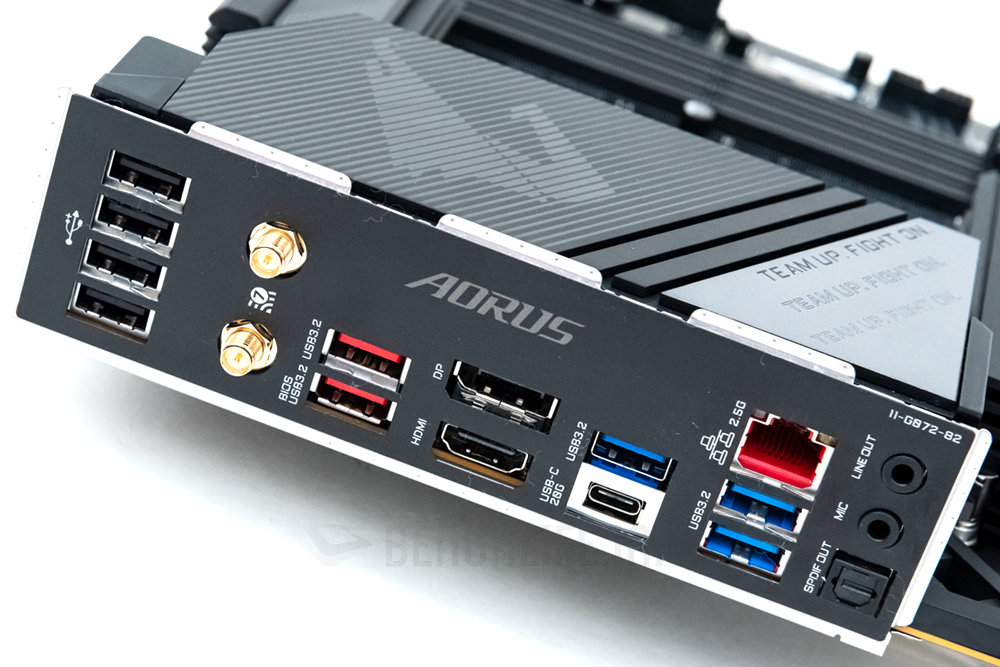
友善設計包含預裝 I/O 背板,首要變動是導入 Wi-Fi 7 無線網路,實際採用模組是 MediaTek 製 Wi-Fi 7 MT7927,概略規格為 2T2R、支援 2.4 / 5 / 6GHz 頻段和 320MHz 頻寬、內建整合 Bluetooth v5.3。另外,2.5Gbps 乙太網路由Realtek 方案,換成普遍常見的 Intel I225-V 控制器。
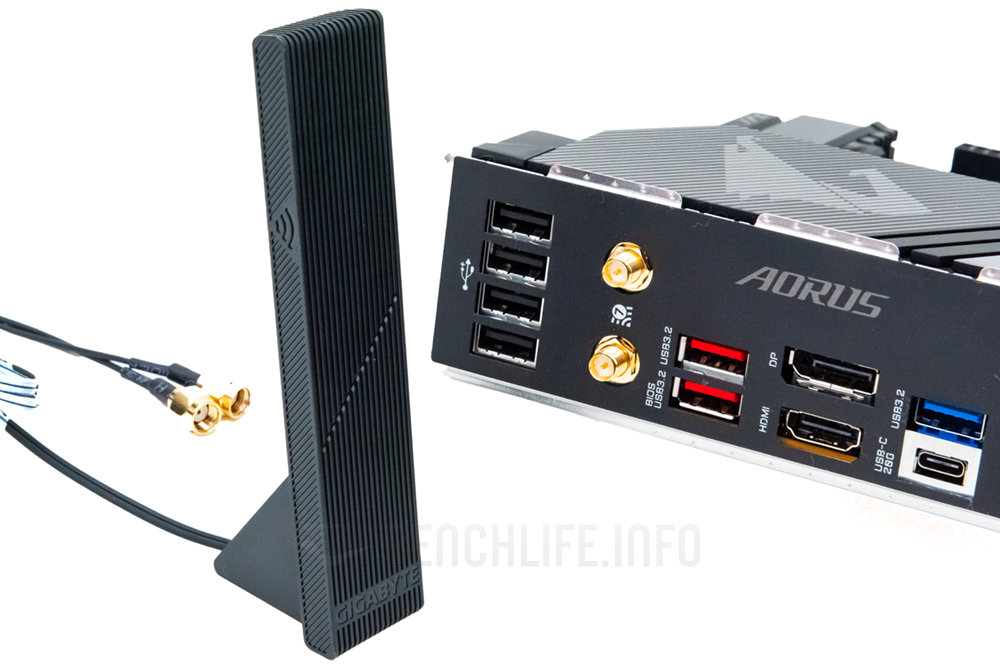
其餘包含 HDMI 2.0 和 DisplayPort 1.2,音效是採用 Realtek ALC1220-VB 編解碼器,搭配 WIMA 電容器等元件構成。此處除了 USB 3.2 Gen 2×2,還有 2 埠 USB 3.2 Gen 2、3 埠 USB 3.2 Gen 1、4 埠 USB 2.0,機殼前置擴充可再拉出 USB 3.2 Gen 2(Type-C)、2 埠 USB 3.2 Gen 1、4 埠 USB 2.0。
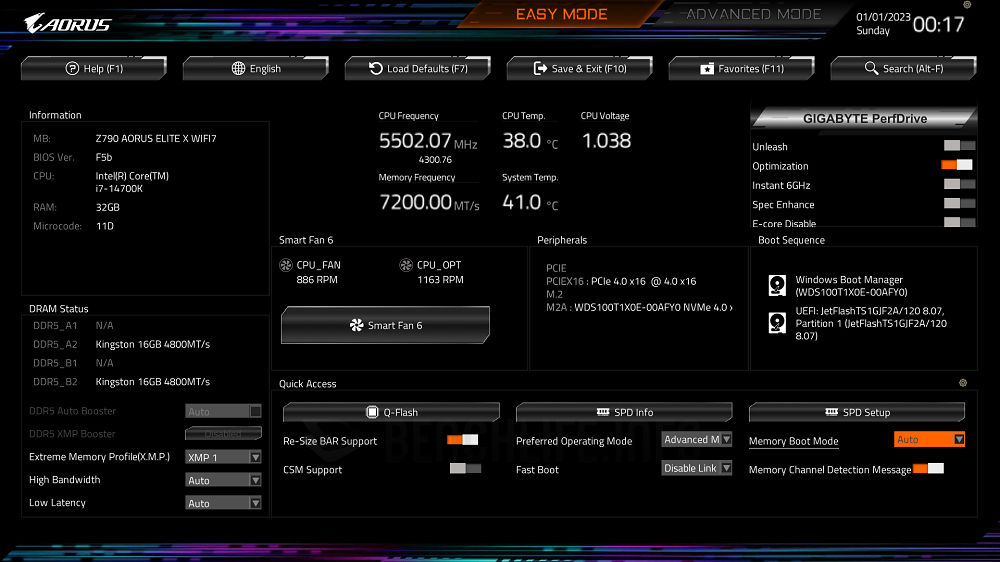
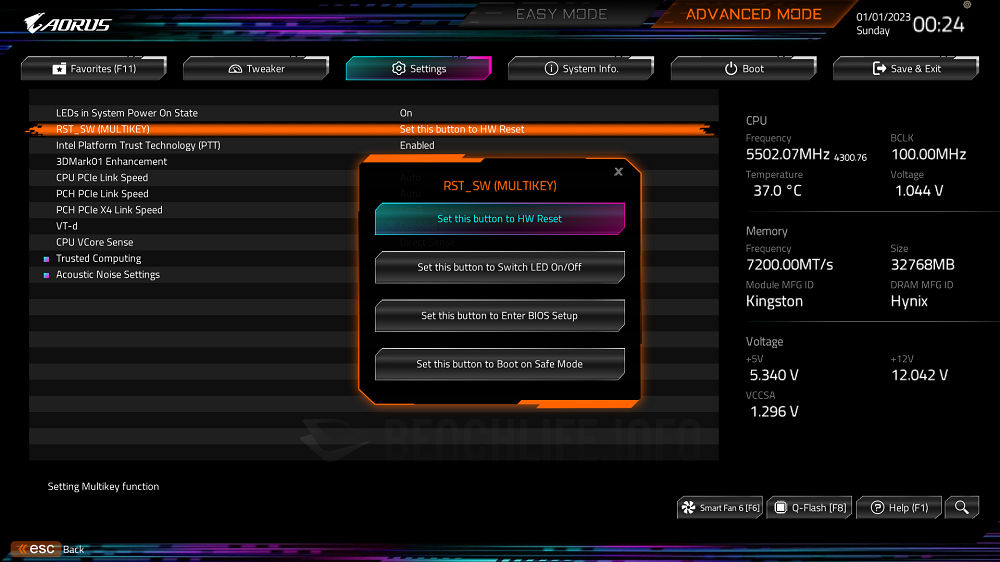
Z790 AORUS Elite X WiFi7 獲得使用再度強化設計的 UEFI BIOS 介面,GIGABYTE 將之稱為 UC BIOS,除了透過繽紛的配色讓視覺感更鮮活,也強調直觀介面設計配置能夠提升操作體驗。它也提供新的元素,像是 Quick Access 能從進階介面模式選擇 9 個實用項目,放置到簡易模式內方便經常性操作。
Core i7-14700K 搭 Z790 AORUS Elite X WiFi7 實測
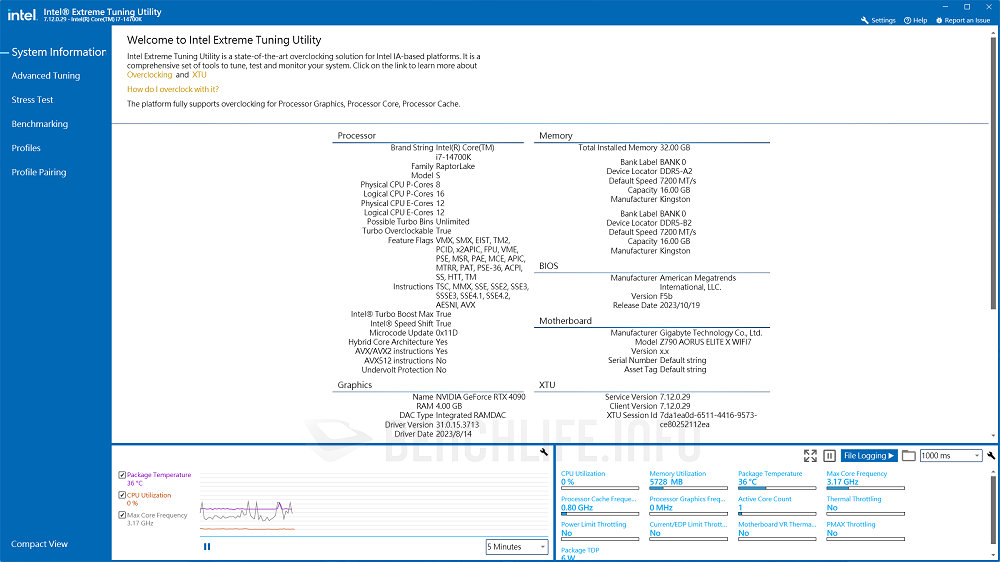
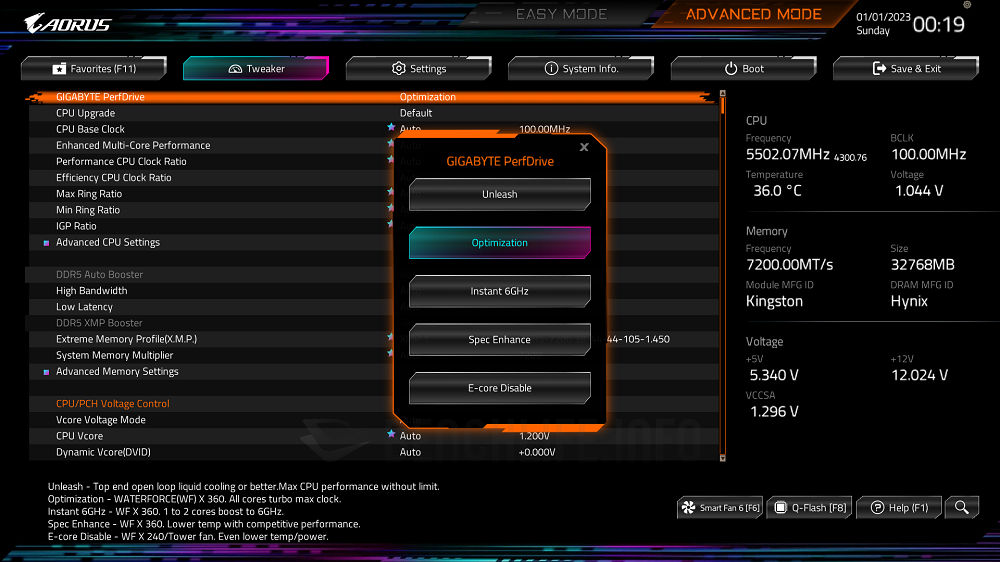
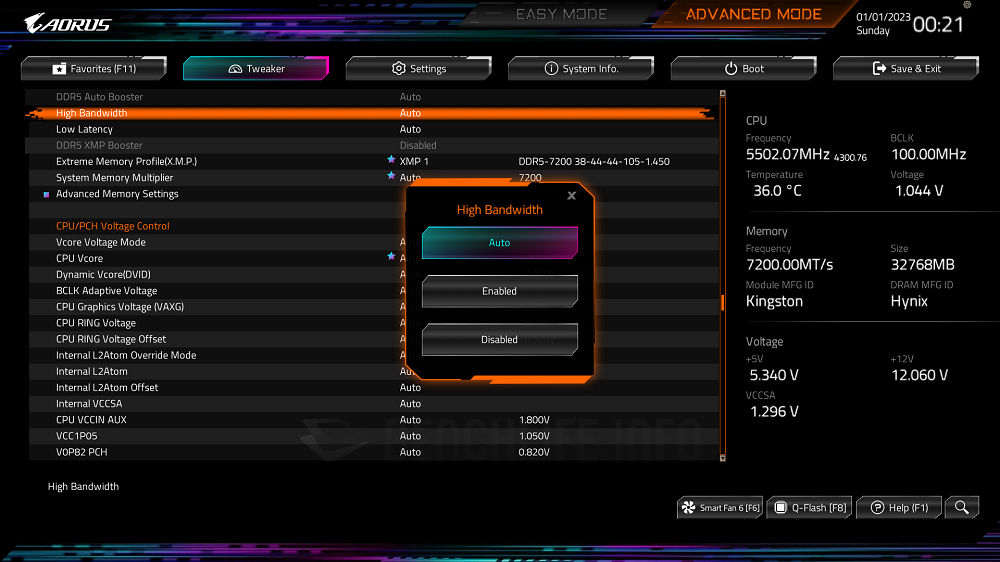
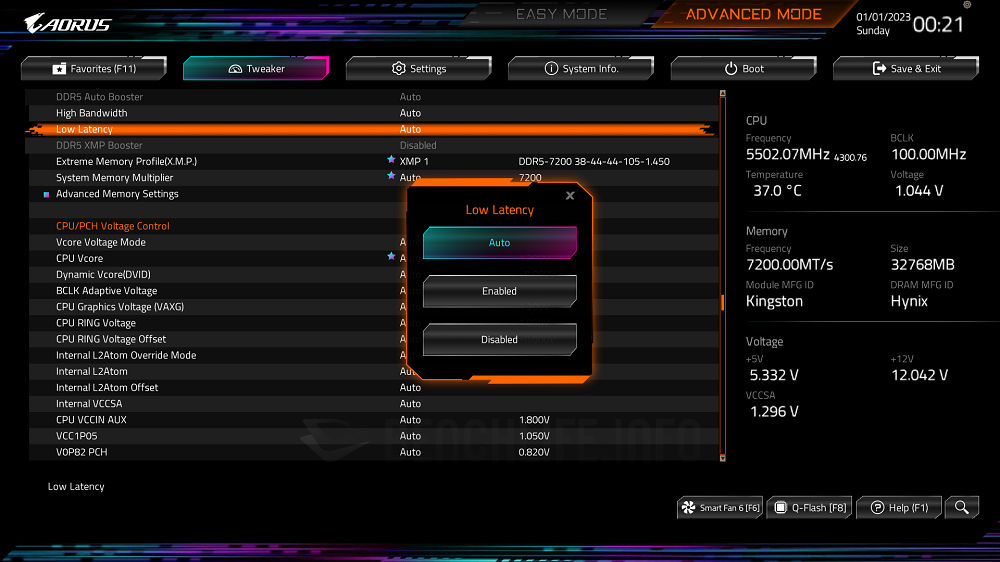
Z790 AORUS Elite X WiFi7 的 UEFI BIOS 預設值傾向發揮性能,像 Tweaker 群組底下的 GIGABYTE PerfDrive,預設 Optimization 模式會放寬 Power Limit。加速功耗 253W 的 Core i7-14700K,會變更成 PL1 280W、PL2 4,095W,我們另外搭配 XMP DDR5-7200 記憶體模組,以這樣微超頻組態進行測試。
| Z790 AORUS Elite X WiFi7 | Core i7-14700K* | Core i9-14900K 基準性能 | Core i5-14600K 基準性能 | |
|---|---|---|---|---|
| Geekbench 6 | ||||
| Multi-Core Performance | Multi-Core Score | 20804 | 20933 | 17051 |
| Integer Socre | 19168 | 19180 | 15612 | |
| Floating Point Socre | 24223 | 24626 | 20086 | |
| Single-Core Performance | Single-Core Score | 2932 | 3141 | 2793 |
| Integer Socre | 2840 | 3047 | 2714 | |
| Floating Point Socre | 3110 | 3323 | 2946 | |
| 3D Particle Movement | ||||
| Total Score (Mops/sec) | 5238.761 | 6063.925 | 3741.08 | |
| 3DTrig (Mops/sec) | 889.8439 | 992.2971 | 601.3708 | |
| BiPy (Mops/sec) | 1799.0978 | 2132.1853 | 1345.3811 | |
| P1rRjct (Mops/sec) | 1073.6899 | 1272.6261 | 792.593 | |
| Cosine (Mops/sec) | 461.8584 | 514.0196 | 308.5253 | |
| HypCube (Mops/sec) | 631.3243 | 720.8779 | 434.5191 | |
| NormDev (Mops/sec) | 382.9471 | 431.9196 | 258.6906 | |
| 7-Zip | ||||
| Compressing(GIPS) | 180.985 | 166.746 | 123.257 | |
| Decompressing(GIPS) | 196.219 | 220.387 | 134.577 | |
| Total Ratin(GIPS) | 188.602 | 193.716 | 128.917 | |
| Dolphin | ||||
| Overall time(Sec) | 167 | 164 | 177 | |
| Time spent on meteor-contest(Sec) | 33 | 31 | 34 | |
| Time spent on n-body(Sec) | 38 | 37 | 41 | |
| Time spent on pi-digits(Sec) | 45 | 45 | 48 | |
| Time spent on spectral-norm(Sec) | 24 | 23 | 25 | |
| WINRAR | ||||
| 基準測試(KB/s) | 51760 | 50222 | 33881 | |
| Nero Score | ||||
| Score | 15393 | 15292 | 14853 | |
| CPU Score | 3175 | 3073 | 2714 | |
| AI Tagging | 3540 | 3520 | 2917 | |
| AVC Decoding & Encoding | 2809 | 2625 | 2510 | |
| GPU Score - RTX 4090 | 12218 | 12219 | 12139 | |
| AVC Decoding & Encoding | 5656 | 5682 | 5645 | |
| Metaverse | 18799 | 18755 | 18633 | |
| Topaz Video AI Benchmark - 4K | ||||
| Artemis 1X(fps) | 9.15 | 8.72 | 8.78 | |
| Iris 1X(fps) | 9.06 | 8.94 | 8.63 | |
| Proteus 1X(fps) | 7.65 | 7.49 | 7.42 | |
| Gaja 1X(fps) | 3.39 | 3.39 | 3.38 | |
| Nyx 1X(fps) | 2.95 | 2.94 | 2.93 | |
| 4X Slowmo | Apollo(fps) | 18.26 | 17.01 | 16.5 |
| APFast(fps) | 23.91 | 21.63 | 21.89 | |
| Chronos(fps) | 7.2 | 7.18 | 7.15 | |
| CHFast(fps) | 13.36 | 12.95 | 12.33 | |
| Topaz Video AI Benchmark - FHD | ||||
| Artemis 1X(fps) | 43.96 | 43.57 | 43.17 | |
| Iris 1X(fps) | 42.95 | 41.1 | 42.47 | |
| Proteus 1X(fps) | 37.66 | 38.13 | 37.22 | |
| Gaja 1X(fps) | 15.89 | 15.91 | 15.81 | |
| Nyx 1X(fps) | 17.81 | 17.72 | 17.73 | |
| 4X Slowmo | Apollo(fps) | 45.52 | 42.89 | 38.46 |
| APFast(fps) | 99.73 | 75.92 | 74.27 | |
| Chronos(fps) | 33.19 | 32.44 | 32.21 | |
| CHFast(fps) | 36.08 | 34.57 | 33.41 | |
| Blender | ||||
| CPU | monster | 227.204978 | 248.79923 | 151.207747 |
| junkshop | 145.300716 | 156.565451 | 96.470366 | |
| classrom | 107.508863 | 117.710569 | 73.438193 | |
| dGPU - RTX 4090 | monster | 6920.409659 | 6869.084892 | 6877.909574 |
| junkshop | 3243.216936 | 3252.225761 | 3248.577609 | |
| classrom | 3176.430252 | 3174.769578 | 3194.130783 | |
| Cinebench 2024 | ||||
| GPU - RTX 4090(pts) | 34169 | 36090 | 35346 | |
| CPU - Multi Core(pts) | 1963 | 2101 | 1337 | |
| CPU - Single Core(pts) | 129 | 134 | 119 | |
| Corona 10 Benchmark | ||||
| Score(ray/s) | 11186701 | 12057143 | 7592414 | |
| Indigo Bench | ||||
| CPU | Bedroom(M samples/s) | 3.701 | 4.028 | 2.516 |
| Supercar(M samples/s) | 10.672 | 11.897 | 7.184 | |
| dGPU - RTX 4090 | Bedroom(M samples/s) | 35.25 | 35.267 | 35.155 |
| Supercar(M samples/s) | 78.033 | 77.735 | 77.557 | |
| 3DMark | ||||
| Speed Way Score | Score | 10128 | 10105 | 10066 |
| Port Royal | Score | 25897 | 25893 | 25971 |
| Time Spy Extreme | Score | 17802 | 18214 | 16066 |
| Graphics score | 19548 | 19496 | 19514 | |
| CPU score | 11822 | 13270 | 8028 | |
| Fire Strike Ultra | Score | 24415 | 24402 | 24039 |
| Graphics score | 24054 | 24021 | 24388 | |
| Physics score | 52424 | 55651 | 38340 | |
| Combined socre | 14457 | 14162 | 14406 | |
| CPU Profile | Max threads | 14314 | 16829 | 10668 |
| 16-threads | 11070 | 12018 | 9856 | |
| 8-threads | 8041 | 9103 | 7461 | |
| 4-threads | 4446 | 4849 | 4501 | |
| 2-threads | 2279 | 2451 | 2270 | |
| 1-threads | 1150 | 1259 | 1129 | |
| AIDA64 Cache & Memory Benchmark | ||||
| DDR5-7200* / 5600 | Read(MB/s) | 107370 | 88210 | 81268 |
| Write(MB/s) | 92835 | 77861 | 77748 | |
| Copy(MB/s) | 97675 | 78897 | 76420 | |
| Leatency(ns) | 66.6 | 82.1 | 81.3 | |
| CrossMark | ||||
| Overall Score | 2528 | 2676 | 2323 | |
| Productivity | 2332 | 2511 | 2213 | |
| Creativity | 2794 | 2831 | 2417 | |
| Responsiveness | 2386 | 2739 | 2386 | |
| WebXPRT 4 | ||||
| Score | 391 | 376 | 349 | |
| Photo Enhancement(ms) | 209 | 221 | 231 | |
| Organize Album using AI(ms) | 1026 | 1003 | 1081 | |
| Stock Option Pricing(ms) | 59 | 58 | 62 | |
| Encrypt Notes and OCR Scan(ms) | 619 | 619 | 671 | |
| Sales Graphs(ms) | 150 | 154 | 162 | |
| Online Homework(ms) | 918 | 1128 | 1274 | |
| PCMark 10 Extended | ||||
| Score | 15256 | 14880 | 14164 | |
| Essentials | Score | 12433 | 12750 | 11851 |
| App Start-up Score | 20795 | 20795 | 19019 | |
| Video Conferencing Score | 7919 | 8380 | 7698 | |
| Web Browsing Score | 11673 | 11895 | 11369 | |
| Productivity | Score | 13166 | 13532 | 12553 |
| Spreadsheets Score | 17077 | 17665 | 16256 | |
| Writing Score | 10151 | 10367 | 9695 | |
| Digital Content Creation | Score | 18313 | 18723 | 16779 |
| Photo Editing Score | 25465 | 25785 | 22740 | |
| Rendering and Visualization Score | 26413 | 26937 | 24074 | |
| Video Editing Score | 9131 | 9450 | 8630 | |
| Gaming | Score | 48834 | 41007 | 43562 |
| Graphics score | 77696 | 67086 | 85167 | |
| Physics score | 52126 | 55525 | 38138 | |
| Procyon Office Productivity | ||||
| Office Productivity score | 8916 | 9152 | 9023 | |
| Office Productivity MP score | 299000 | 302000 | 299000 | |
| Word socre | 9105 | 8657 | 9167 | |
| Excel socre | 8797 | 9206 | 8921 | |
| PowerPoint socre | 9425 | 9643 | 9258 | |
| Outlook score | 7865 | 9109 | 8499 | |
| Word MP socre | 372000 | 362000 | 381000 | |
| Excel MP socre | 216000 | 221000 | 214000 | |
| PowerPoint MP socre | 336000 | 346000 | 330000 | |
| Procyon Photo Editing Benchmark | ||||
| Photo Editing Benchmark score | 10631 | 10918 | 10671 | |
| Image Retouching score | 9378 | 9748 | 11752 | |
| Batch Processing score | 12052 | 12229 | 9691 | |
| Procyon Video Editing | ||||
| Video Editing score | 10309 | 10420 | 10203 | |
| Core i7-14700K* | Core i9-14900K 基準性能 | Core i5-14600K 基準性能 |
測試平台
- 記憶體:Kingston FURY Renegade DDR5-7200 RGB 32GB Kit(KF572C38RWAK2-32)
- 系統碟:Western Digital WD_BLACK SN850 1TB
- 顯示卡:NVIDIA GeForce RTX 4090 Founders Edition
- 電源供應器:ASUS ROG Thor II 1000W
- 散熱器:Noctua NH-D15S
- 顯示器:ASUS TUF Gaming VG28UQL1A
- 作業系統:Microsoft Windows 11 Pro 64bit 22H2
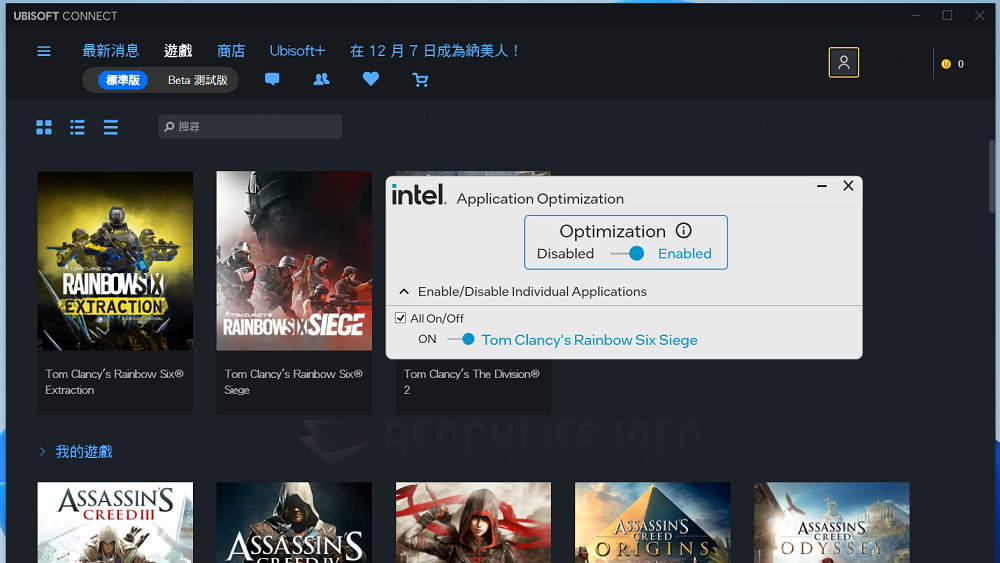
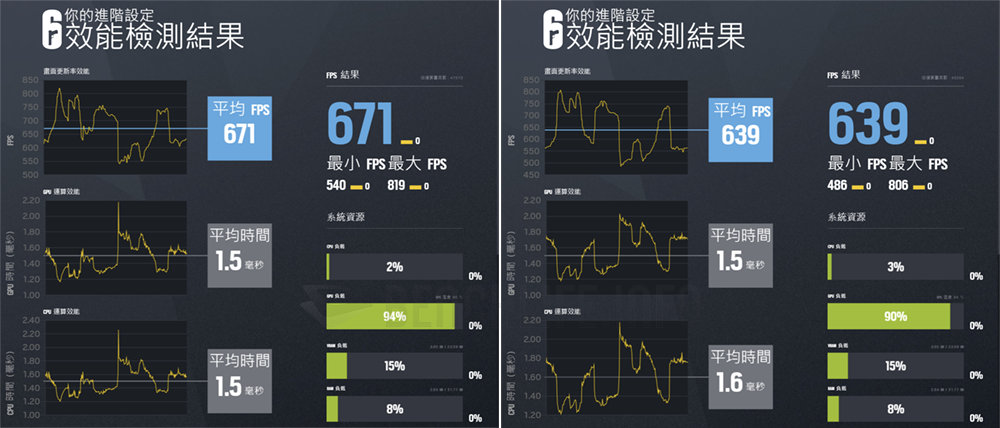
實測所得結果如上列,其中 Core i9-14900K 和 Core i5-14600K 基準性能存檔數據,是使用 Intel 預設組態、非超頻模組進行測試。另外,Core i7-14700K 也支援 Intel APO 技術功能,實際透過 Rainbow 6 Siege 遊戲進行簡單試驗,啟用後能使畫面平均幀率由 639fps 提高至 671fps。
* 2560 x 1440 解析度、最高貼圖品質。
Core i7-14700K 目前市場參考價格約 14,500 元(Core i7-14700KF 為 13,400 元),較 20,900 元(Core i9-14900KF 約 20,100 元)的 Core i9-14900K 便宜 6,400 元。兩者價差在 44.1% 左右,就我們實測的數據而言,性能差距幅度可視為不超過 20%(考量測試組態差異,稍微放寬評估)。
兩者的實體核心架構,P-core 同為 8 個、E-core 分別有 12 個和 16 個之差,另外 Core i7 預設時脈沒像 Core i9 拉那麼高。換言之,實質差異說不上有多大,想要追求極致的 Core i9-14900K / KF 自然得多付出一些代價($$),至於 Core i7-14700K / KF 性價比更好這點應該無庸置疑。
最後就 Z790 AORUS Elite X WiFi7 來看,微改款固然使價格往上提高一些,但是實際成交價格仍然並未破萬。其硬體設計配置和用料在一定水準之上,又有 Wi-Fi 7 這項新元素、更便捷的 M.2 友善設計等變動,而 UEFI BIOS 功能性和可玩性自然也相當齊備,如果想精簡成軍是值得加以參考。
Intel 700 系列晶片主機板開箱
Intel 14th Gen 系列處理器實測
你可能也想知道:
沒有類似文章
Recommend
-
16
The GIGABYTE B550I Aorus Pro AX Motherboard Review
-
11
GIGABYTE Z590 AORUS Master x Intel Core i9-11900K 動手玩 By bisheng on 2021-03-30 in 測試報告...
-
5
得力於第 11 代桌上型處理器的 AVX-512 和 DL Boost / VNNI 指令集,Z590I VISION D 讓創作者工作流程更為順暢。 於 500 系列晶片組主機板開賣一陣子之後,第 11 代 Intel Core 系列桌上型處理器終於在台灣時間 3 月 30 日晚上正式開賣。縱使這次最高核...
-
21
GIGABYTE Z690 AORUS MASTER 搭 Intel Core i9-12900K 動手玩神鷹高階定位當家,總和來看討喜指數明顯優於前一代。
-
9
GIGABYTE Z790 AORUS Master 搭 Intel Core i9-13900K 實測體驗 Z790 晶片組本質上是 Z690 的延伸,主要改變在於 PCIe 4.0 / 3.0 通道與 USB 3.2 Gen 2×2 的可配置數量。
-
10
搭配 Intel Core i9-13900K,GIGABYTE Z790 AORUS XTREME 主機板實測 ROG Maximus Z790 Extreme 之後的另一張旗艦主機板。 若是我們選擇了「奢華」這個詞來形容 ROG Z790 Extreme 主機板,看著 GIGABYTE 的 Z790 AORUS Xtreme 主機板,我們會...
-
8
與 AMD Radeon RX 7900 XT 對決,GIGABYTE AORUS GeForce RTX 4070 Ti ELITE 實測 799 美元的 NVIDIA GeForce RTX 4070 Ti 登場,效能是否滿足到你? 從 2022 年 10 月的 GeForce RTX 4090 開始,跟著 1...
-
4
搭配 Intel Core i5-13500 處理器,GIGABYTE B760 AORUS ELITE AX 主機板實測 更多的 B760 晶片主機板介紹,並且帶來 Intel Core i5-13500 的實測。 Intel 13 代 Core 系列處理器產品線已經就緒,各家的 LGA 1700 腳位主機板也涵蓋了 Z790、H...
-
10
跨世代 10,000MB/s 極速體驗,GIGABYTE AORUS Gen5 10000 SSD 實測
-
6
平價裝機組合:MSI MPG B760M Edge Ti WiFi 搭配 Intel Core i5-14400 實測
About Joyk
Aggregate valuable and interesting links.
Joyk means Joy of geeK