

解决 Groovy 引起的一次 OOM 告警
source link: https://mazhuang.org/2023/03/22/oom-caused-by-groovy/
Go to the source link to view the article. You can view the picture content, updated content and better typesetting reading experience. If the link is broken, please click the button below to view the snapshot at that time.
解决 Groovy 引起的一次 OOM 告警
线上收到告警,有个服务的一个 pod was OOM killed.
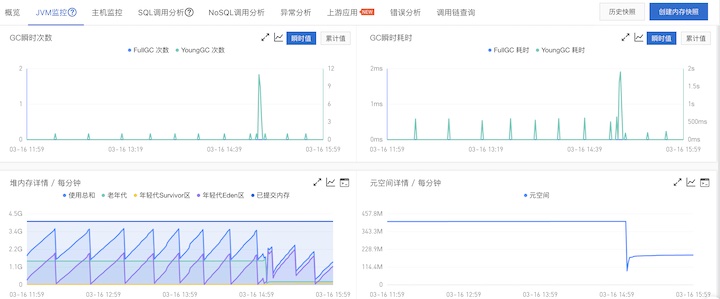
从监控系统来看,被 kill 的节点 A 在重启前,堆内存使用随着 YoungGC 规律波动,元空间占用较高,且一直缓慢增长到了400MB以上——该应用代码量不大,按理不应该占用这么多。
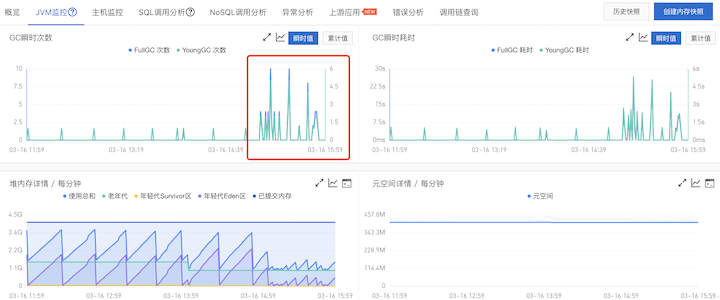
而与它同容器组的另一个节点 B 看起来更不正常,平均响应时间明显长于另外的节点,且在堆内存已经降下来的情况下还多次 FullGC,并且有很多 java.lang.OutOfMemoryError。晚些时候该节点触发了两次 FullGC 次数过多的告警。
OutOfMemoryError 异常堆栈:
java.lang.OutOfMemoryError : Metaspace
    at java.lang.ClassLoader.defineClass1(Native Method)
    at java.lang.ClassLoader.defineClass(ClassLoader.java:763)
    at java.security.SecureClassLoader.defineClass(SecureClassLoader.java:142)
    at groovy.lang.GroovyClassLoader.access$400(GroovyClassLoader.java:62)
    at groovy.lang.GroovyClassLoader$ClassCollector.createClass(GroovyClassLoader.java:500)
    at groovy.lang.GroovyClassLoader$ClassCollector.onClassNode(GroovyClassLoader.java:517)
    at groovy.lang.GroovyClassLoader$ClassCollector.call(GroovyClassLoader.java:521)
    at org.codehaus.groovy.control.CompilationUnit$16.call(CompilationUnit.java:822)
    at org.codehaus.groovy.control.CompilationUnit.applyToPrimaryClassNodes(CompilationUnit.java:1053)
    at org.codehaus.groovy.control.CompilationUnit.doPhaseOperation(CompilationUnit.java:591)
    at org.codehaus.groovy.control.CompilationUnit.processPhaseOperations(CompilationUnit.java:569)
    at org.codehaus.groovy.control.CompilationUnit.compile(CompilationUnit.java:546)
    at groovy.lang.GroovyClassLoader.doParseClass(GroovyClassLoader.java:298)
    at groovy.lang.GroovyClassLoader.parseClass(GroovyClassLoader.java:268)
    at groovy.lang.GroovyShell.parseClass(GroovyShell.java:688)
    at groovy.lang.GroovyShell.parse(GroovyShell.java:700)
    at groovy.lang.GroovyShell.evaluate(GroovyShell.java:584)
    at groovy.lang.GroovyShell.evaluate(GroovyShell.java:623)
    at groovy.lang.GroovyShell.evaluate(GroovyShell.java:594)
    at org.springframework.scripting.groovy.GroovyScriptEvaluator.evaluate(GroovyScriptEvaluator.java:118)
结合以上异常堆栈与节点 B 的现象推测:
- 执行
GroovyScriptEvaluator.evaluate时,会动态生成一些 Class,导致元空间占用持续上升; - FullGC 主要不是为了回收堆内存,很可能是为了回收元空间;
- FullGC 也无法成功回收 1 中动态生成的 Class 占用的元空间。
根据推测,用 Groovy 和 Metaspace 作为关键字进行了一些搜索,找到如下一篇相关性比较高的文章:记一次线上Groovy导致的OOM的问题解决过程
以及它里面引用的文章: Groovy 动态加载类踩中的那些坑
里面提到了 Groovy 的一个 Bug: ClassInfo.globalClassValue lead to GroovyClassLoader can’t unload classes,大意是 Groovy 动态生成的类因为被缓存和引用,导致无法 unload,从而引发元空间随着时间推移一直增长且无法释放。在 Groovy 2.4.6 引入,2.4.8 修复。
检查我们项目里的 groovy-all 包版本,是 2.4.7,那很有可能命中这个 bug。
构建一个测试应用,启动后循环调用 GroovyScriptEvaluator.evaluate,如:
@SpringBootApplication
public class GroovyOomDemoApplication implements CommandLineRunner {

    public static void main(String[] args) {
        SpringApplication.run(GroovyOomDemoApplication.class, args);
    }

    @Override
    public void run(String... args) throws Exception {
        GroovyScriptEvaluator evaluator = new GroovyScriptEvaluator();

        ScriptSource scriptSource = new StaticScriptSource("a == 3");
        Map<String, Object> params = new HashMap<>(0);
        Random rand = new Random();

        while (true) {
            Integer a = rand.nextInt(10);
            params.put("a", a);
            Object result = evaluator.evaluate(scriptSource, params);
            System.out.printf("a = %d, result is %s%n", a, result);
        }
    }
}
然后在运行的 JVM 参数里添加一些参数:
-XX:MetaspaceSize=64m
-XX:MaxMetaspaceSize=64m
-verbose:class
-verbose:gc
设置最大元空间大小、打印类的 load/unload、以及 GC 的信息。
测试代码发布在 https://github.com/mzlogin/groovy-oom-demo
使用 groovy-all 2.4.7 版本运行的情况
控制台打印:
……
[Loaded Script1 from file:/groovy/shell]
a = 1, result is false
[Loaded Script1 from file:/groovy/shell]
a = 2, result is false
[Loaded Script1 from file:/groovy/shell]
a = 0, result is false
[Loaded Script1 from file:/groovy/shell]
a = 8, result is false
[GC (Metadata GC Threshold)  838057K->253201K(1080832K), 0.1350074 secs]
[Full GC (Metadata GC Threshold)  253201K->244956K(1232896K), 0.4860932 secs]
[GC (Last ditch collection)  244956K->245557K(1421824K), 0.0403506 secs]
……
Exception: java.lang.OutOfMemoryError thrown from the UncaughtExceptionHandler in thread "main"
……
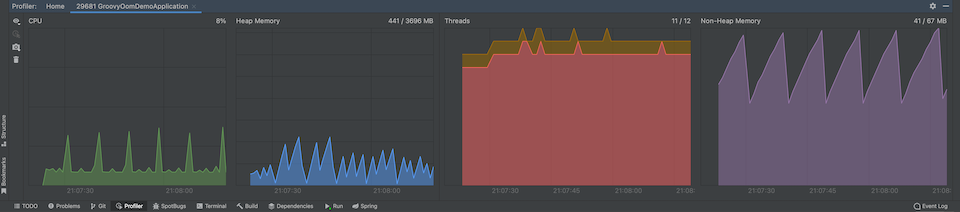
Profiler:

从控制台打印以及 Profiler 来看,程序先是打印了很多 [Loaded Script1 from file:/groovy/shell],然后最后当 Non-Heap Memory 占用很高之后,开始因为达到 Metadata GC Threshold,疯狂 YongGC + FullGC,但 Non-Heap Memory 也降不下来,最终程序很快直接挂掉了。
升级为 groovy-all 2.4.8 版本运行的情况
控制台打印:
……
[Loaded Script1 from file:/groovy/shell]
a = 9, result is false
[Loaded Script1 from file:/groovy/shell]
a = 3, result is true
[Loaded Script1 from file:/groovy/shell]
a = 7, result is false
[Loaded Script1 from file:/groovy/shell]
a = 7, result is false
[GC (Metadata GC Threshold)  722452K->251702K(1090560K), 0.0483118 secs]
[Full GC (Metadata GC Threshold)  251702K->240778K(1254912K), 0.4303570 secs]
[GC (Last ditch collection)  240778K->241270K(1373696K), 0.0274501 secs]
[Full GC (Last ditch collection)
[Unloading class Script1 0x00000007c103c428]
[Unloading class Script1 0x00000007c103bc28]
[Unloading class Script1 0x00000007c103b428]
[Unloading class Script1 0x00000007c103ac28]
[Unloading class Script1 0x00000007c103a428]
……
Profiler:
同上面一样,程序开始也是打印了很多 [Loaded Script1 from file:/groovy/shell],但不同的是达到 Metadata GC Threshold 进行 GC 之后,可以将 Non-Heap Memory 占用降下来,并且从控制台可以看到在 GC 时打印了很多 [Unloading class Script1 xxx],程序持续运行很长时间也没问题。
另外有个疑问:这个应用上线很长时间了,与 Groovy 相关的逻辑很久没有动过了,为什么以前没有出现这种现象?
答案:以前这个应用时不时会发一次版,重置 Metaspace,而这次有两个多月没有发版了,Metaspace 一直增长,最终达到了阈值。
升级 groovy-all 至 2.4.8(含)版本以上。
Recommend
About Joyk
Aggregate valuable and interesting links.
Joyk means Joy of geeK