

New Microsoft Intune troubleshooting experience - Microsoft Community Hub
source link: https://techcommunity.microsoft.com/t5/intune-customer-success/new-microsoft-intune-troubleshooting-experience/ba-p/3728338
Go to the source link to view the article. You can view the picture content, updated content and better typesetting reading experience. If the link is broken, please click the button below to view the snapshot at that time.
New Microsoft Intune troubleshooting experience
By Jon Lynn - Sr. Product Manager | Microsoft Intune
There’s a new troubleshooting experience in Microsoft Intune that provides quicker access to application, compliance, and policy data as well as deployment status. This new experience also includes several new features, including:
- Export, filter, and sort on reports.
- Support for excluded policies and applications.
- Filter the entire experience to a single device.
Additionally, the Troubleshooting pane now provides data insights for all available device diagnostics, disabled devices, and offline devices that haven't checked into the service for three or more days. Along with the troubleshooting updates, we also added the ability to download mobile device logs, such as the Intune Company Portal and App Protection logs.
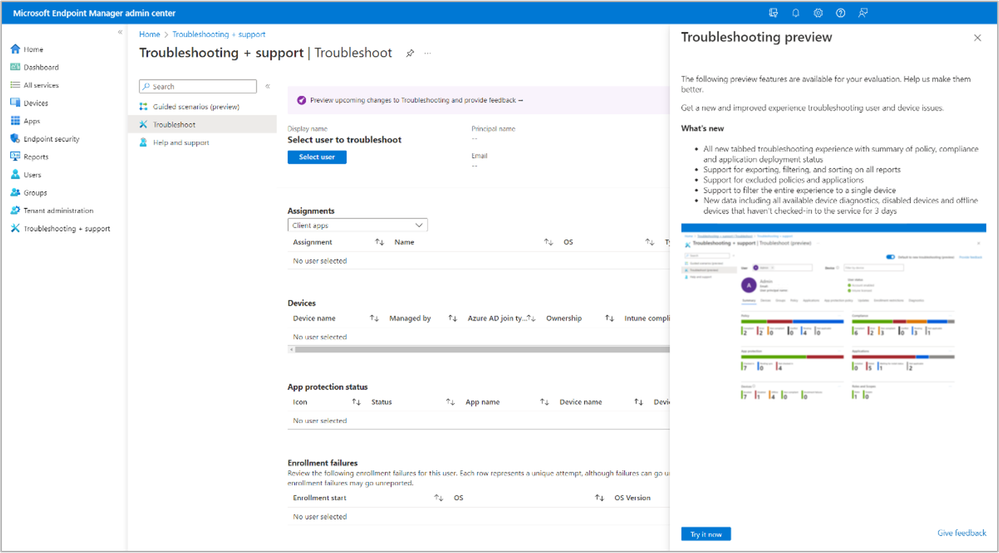
A screenshot of the Troubleshooting preview option pane.
We’re excited to share the new Troubleshoot pane in Intune and hope that it allows IT administrators to diagnose and troubleshoot issues quickly and easily. During public preview, admins can switch back and forth between the new and old experience, without impacting other admins use of the Troubleshooting pane, like your helpdesk admins. To enable this new experience, simply select the purple banner and then click the Try it now button in the Troubleshooting preview pane. The new experience will automatically load and remain on until you switch it back, even if you close the browser.
The first change you'll notice is that we updated the User selection tool to a drop-down list, making it faster and easier to find the user you want to review.

A screenshot of selecting a User in the Troubleshoot preview pane.
To begin the troubleshooting process, select a user from the drop-down list or type in a display name or email.
Once a user is selected, their information is loaded into a new tabbed format that starts with an overview of their licensing, device status, and assigned apps and policies. It also provides basic device information such as how many apps the user has enrolled, if any of them are disabled or offline, as well as recent enrollment failures. This information is displayed in bar charts with clickable components to access reporting for everything deployed to the user. Each colored section and associated numerical value can be clicked to access a report automatically filtered to that data.
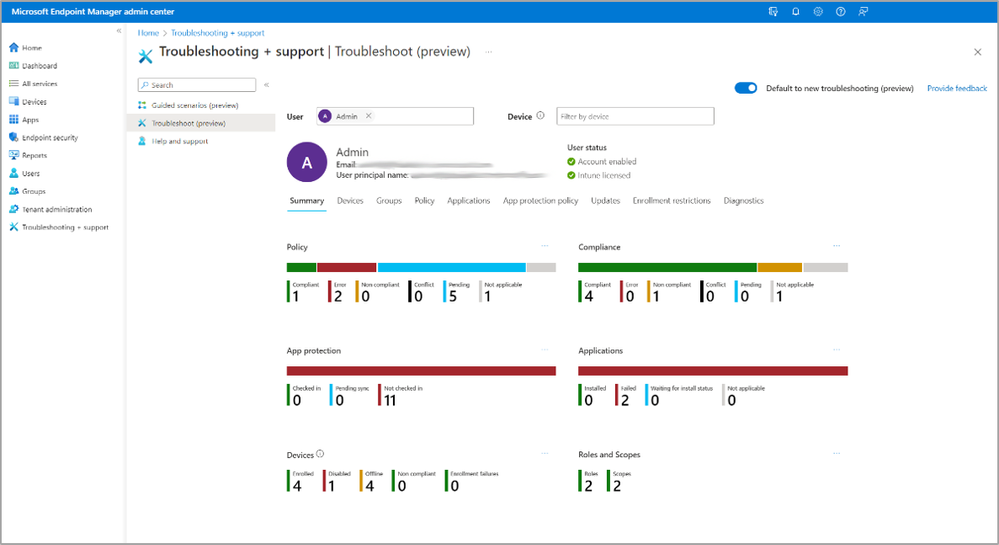
A screenshot of the summary data for a selected user in the Troubleshooting preview pane.
For example, clicking on Policy state -- Pending, provides a report of all the device policies with a pending status, as shown in the image below. From this pane, clicking on Add filters allows you to view another policy state, and clicking the “x” for an applied filter will remove it altogether.

A screenshot of Device policies filtered to show devices with pending policy states.
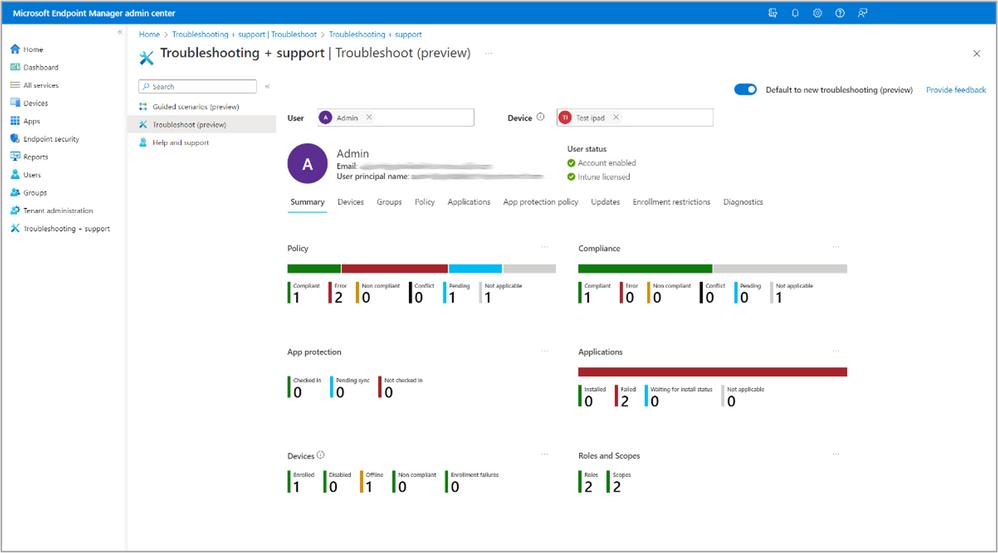
A screenshot of the Troubleshooting preview pane with the filters set to a specific user and specific device.
Another new feature is the ability to filter the entire pane and tabs to a single device. From the Device drop down option, select a device and the entire pane will automatically filter to that device.
To review all devices, select the Devices tab and their full status will display (see image below). Select a device name to get more information (such as remote tasks) or select the App lifecycle status of the device for information on an app’s installation status.
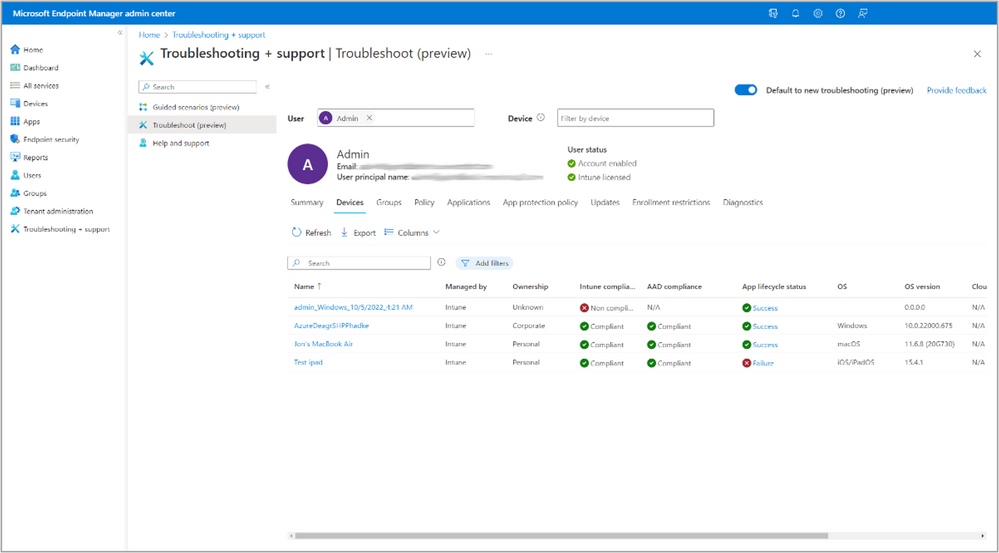
A screenshot of the Devices tab in the Troubleshooting preview pane for a specific user.
In addition to the Devices tab, the following tabs are also available to help troubleshoot and diagnose issues your users may be experiencing:
- Groups
- Policy
- Applications
- App protection policy
- Updates
- Enrollment restrictions
- Diagnostics
The Groups tab is similar to the existing Device group membership report, but, instead of groups for a specific device, it shows the groups that the user is part of. This updated format is much easier to use than our previous groups list and allows for full export, sorting, and filtering.
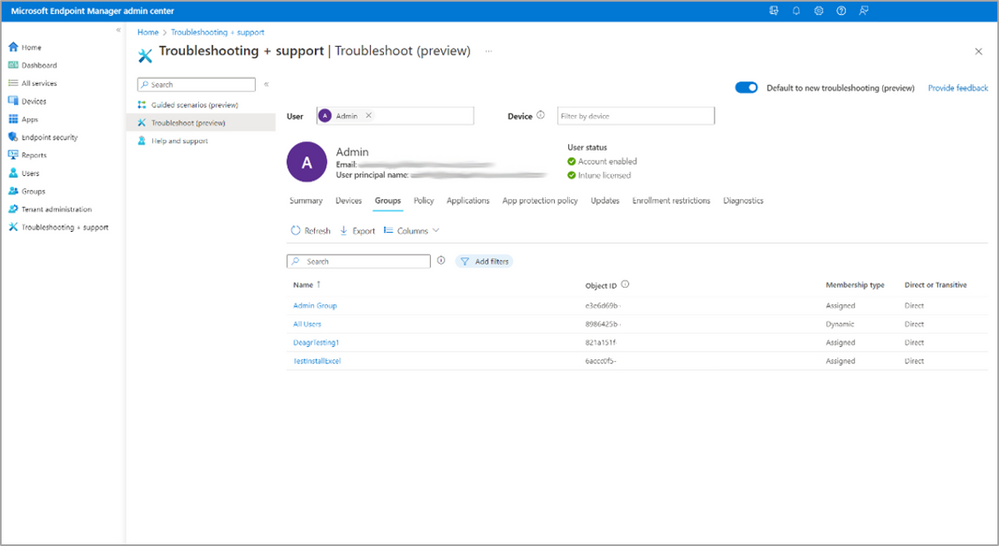
A screenshot of the Groups tab in the Troubleshooting preview pane.
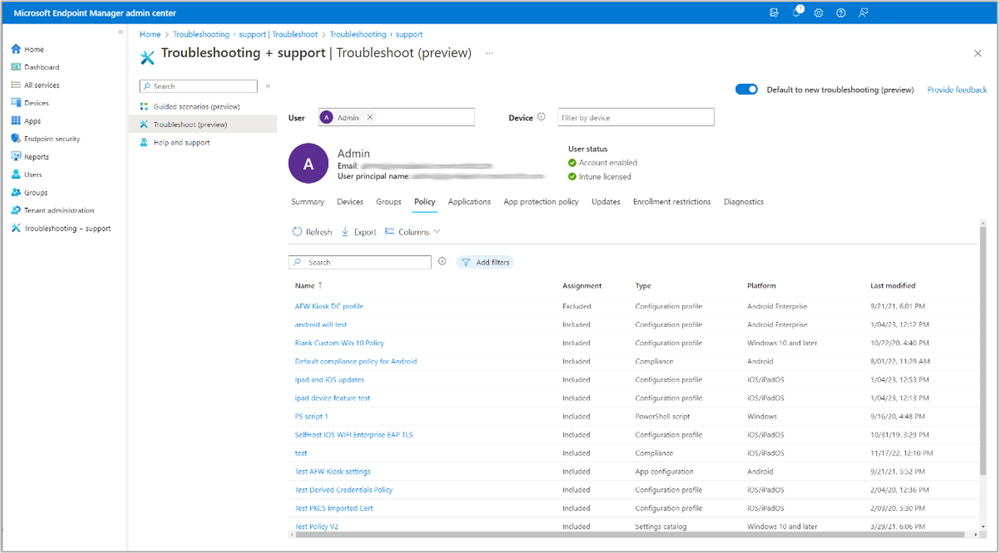
A screenshot of the Policy tab in the Troubleshooting preview pane.
The Policy and Applications tabs now include full sorting, filtering, refresh, and export capabilities along with showing included and excluded policies and apps. We’ve combined information about all policies applicable to the chosen user into the policy tab, including configuration and compliance policies.
The Applications tab includes App install status per app, which, when selected, shows the status of each app on that user’s devices.
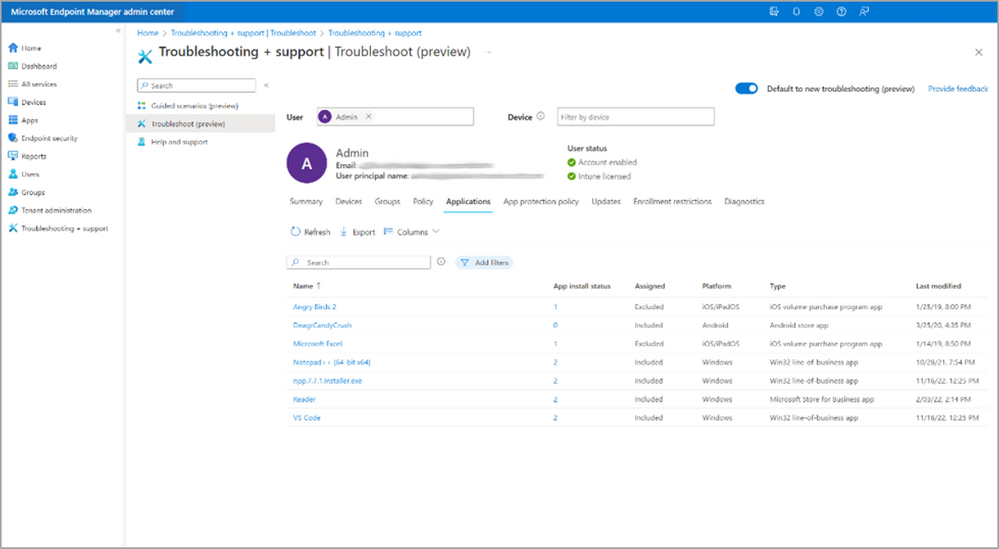
A screenshot of the Applications tab in the Troubleshooting preview pane.
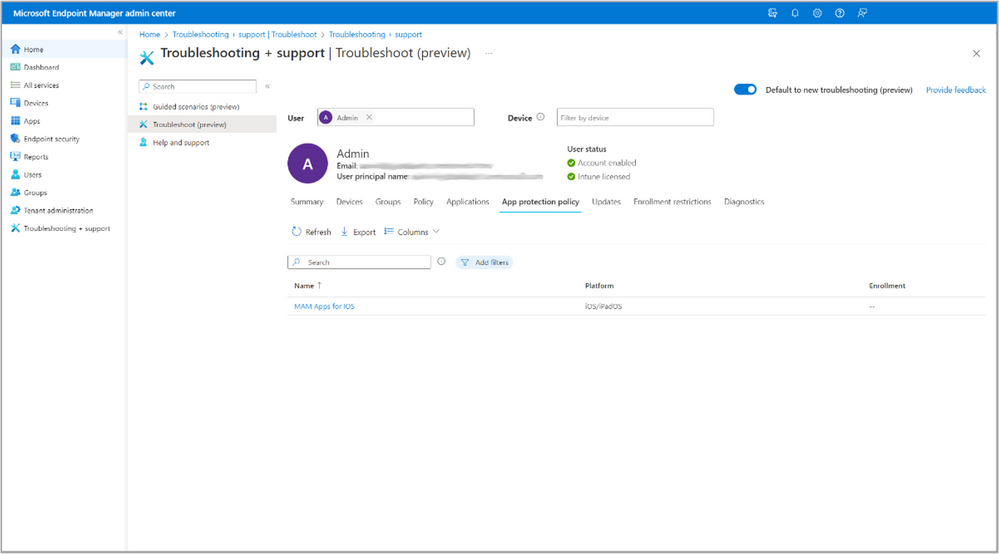
A screenshot of the App protection policy tab in the Troubleshooting preview pane.
The App protection policy tab shows you all the app protection policies targeted to that user. Clicking the policy name will take you to the policy for greater detail.
The Updates and Enrollment restrictions tabs show all those features targeted to the user.
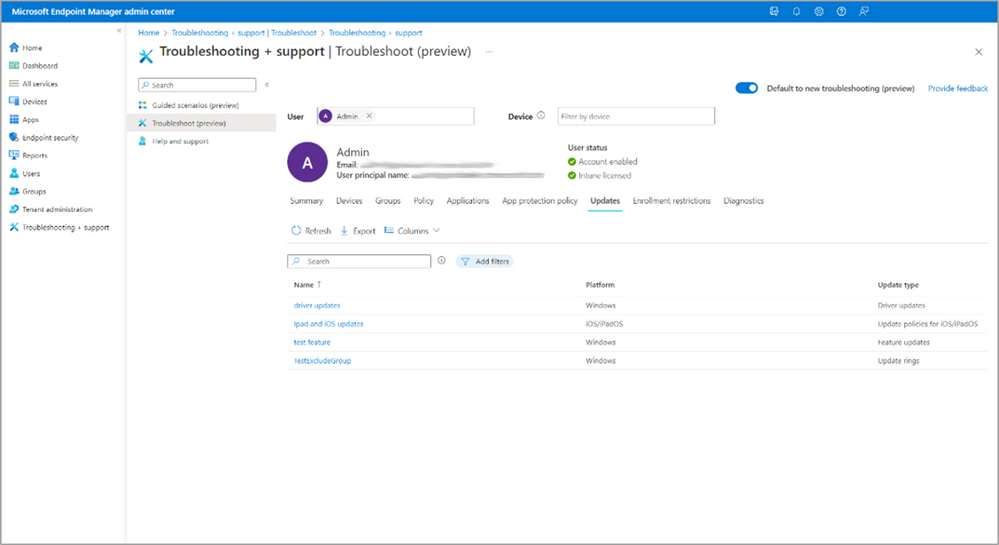
A screenshot of the Updates tab in the Troubleshooting preview pane.

A screenshot of the Enrollment restrictions tab in the Troubleshooting preview pane.
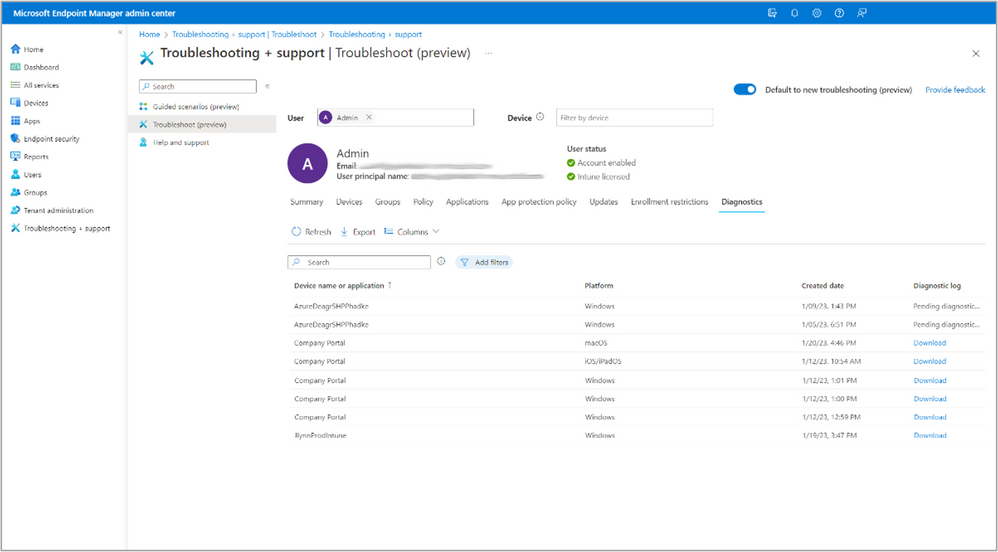
A screenshot of the Diagnostics tab in the Troubleshooting preview pane.
Another exciting feature in this public preview that has been highly requested is the mobile app log in Intune. In the Diagnostics tab, you’ll be able to access mobile app logs collected by in their mobile apps in addition to diagnostics collected for Windows 10 and 11 machines, apps, and Windows Autopilot. In the public preview, there is support for the Intune Company Portal on iOS/iPadOS, macOS, Android and Android Open-Source Project (AOSP) as well as Intune app protection logs via Microsoft Edge on iOS/iPadOS.
|
Note: The updated Company Portal app for Android and iOS to enable this feature in Intune is currently rolling out across the respective platforms and will be available by the end of this week. We'll remove this note once it's available for download! |
Future improvements
While we don’t have current timelines to share, we’re planning to continue making improvements to the new troubleshooting experience including:
- Show policies and apps that are only targeted to a device group.
- The capability to search for an individual device.
- Display app protection logs on iOS in the Diagnostics tab.
- Support for Intune app protection logs via Edge will be available with an upcoming update to the Edge app.
Known issues
- iOS and macOS Company Portal logs don’t appear in the Diagnostics tab. This will be resolved with a new version of the Company Portal, releasing in early February 2023.
- If data doesn’t exist for a specific report, the report is empty, and does not indicate the lack of data is expected.
Conclusion
This new functionality will simplify the troubleshooting and diagnostic experience. We’re excited for you to try it, let us know what you’re excited for and what you’d like to see in future improvements!
We will continue to update this post as new information becomes available. If you have questions or comments for the Intune team, reply to this post or reach out to @IntuneSuppTeam on Twitter.
Recommend
About Joyk
Aggregate valuable and interesting links.
Joyk means Joy of geeK