

HarmonyOS - 基于ArkUI(ETS) 实现心电图组件
source link: https://www.51cto.com/article/721174.html
Go to the source link to view the article. You can view the picture content, updated content and better typesetting reading experience. If the link is broken, please click the button below to view the snapshot at that time.

HarmonyOS - 基于ArkUI(ETS) 实现心电图组件

随着大家生活水平的提升,越来越多的人注重自身身心健康,养生成了目前比较热门的活动。心电图是检测心脏活动状态的直观表现,可以通过心电图来观察人提的健康状况。
响应鸿蒙万物互联的口号,肯定少不了智能设备和心电检测设备的互联。所以本文实现了简单的心电图功能UI展示。
组件API
ygEcg
ecgData | 配置心电图的信息 |
接口 EcgDataType
Array<number> | 心电数据源 | |||
timeStep | number | 每一小格代表时间(毫秒),x轴方向 | ||
mvStep | number | 每小格表示电压(毫伏/mv),y轴方向 | ||
waveLineColor | string | |||
gridColor | Array<string> | 网格颜色,第一个为小网格,第二个为大网格 | ||
maxTime | number | 图标显示最大时间区域(毫秒) | ||
width | number | |||
height | number | |||
backgroundColor | string | 画布背景色 |
// import 引入接口和组件
import ygEcg,{EcgDataType} from './../common/compontents/ygEcg'
@Entry
@Component
struct Index {
    @State ecgData:EcgDataType = {
        data: [
        0, 0, 0, 0.1, 0, 0, 0, -0.2, 1.5, -0.4, 0, 0, 0, 0.1, 0.2, 0.1, 0, 0, 0,
        0, 0, 0, 0.1, 0, 0, 0, -0.2, 1.0, -0.4, 0, 0, 0, 0.1, 0.2, 0.1, 0, 0, 0,
        0, 0, 0, 0.1, 0, 0, 0, -0.2, 1.0, -0.4, 0, 0.1, 0, 0.1, 0.2, 0.1, 0, 0, 0,
        0, 0, 0, 0.1, 0, 0, 0, -0.2, 2.0, -0.3, 0, 0, 0, 0.1, 0.2, 0.1, 0, 0, 0,
        0, 0, 0, 0.1, 0, 0, 0, -0.2, 1.0, -0.4, 0, 0, -0.1, 0.1, 0.2, 0.4, 0, 0, 0,
        0, 0, 0, 0.1, 0, 0, 0, -0.2, 1.0, -0.4, 0, 0, 0, 0.1, 0.2, 0.2, 0, 0, 0,
        0, 0, 0, 0.1, 0, 0, 0, -0.2, 1.0, -0.4, 0, 0.1, 0, 0.1, 0.2, 0.1, 0, 0, 0,
        0, 0, 0, 0.1, 0, 0, 0, -0.2, 1.0, -0.4, 0, 0, 0, 0.1, 0.2, 0.1, 0, 0, 0,
        0, 0, 0, 0.1, 0, 0, 0, -0.2, 1.0, -0.4, 0, 0, 0, 0.1, 0.2, 0.1, 0, 0, 0,
        ],
        timeStep: 40, // 每一小格表示40毫秒,x轴方向
        mvStep: 0.1, // 每小格表示0.1mv,y轴方向
        waveLineColor: '#181818', // 波线颜色
        gridColor: ['#ffa5a5','#dd0000'], // 网格颜色,第一个为小网格,第二个为大网格
        maxTime: 6000,
        width: 700,
        height: 300,
        backgroundColor: '#fff'
    }
    build() {
        Row(){
          ygEcg({ecgData: $ecgData})
        }
        .justifyContent(FlexAlign.Center)
        .alignItems(VerticalAlign.Center)
        .width('100%')
        .height('100%')
        //    .backgroundColor('#151515')
    }
}
实现前的准备
在写这个demo之前,以为心电图应该就是现在简单的上下波动的折线图。
通过使用canvas组件,绘制一个类似医学上的心电图纸网格,然后通过心电源数据,绘制对应的折线形成心电波形。
1、创建canvas画布
@Component
struct ygEcg {
private settings: RenderingContextSettings = new RenderingContextSettings(true);
private ctx: CanvasRenderingContext2D = new CanvasRenderingContext2D(this.settings)
@Link ecgData: EcgDataType;
build() {
Canvas(this.ctx)
.onReady(()=>{
})
.width(this.ecgData.width)
.height(this.ecgData.height)
.backgroundColor(this.ecgData.backgroundColor)
}
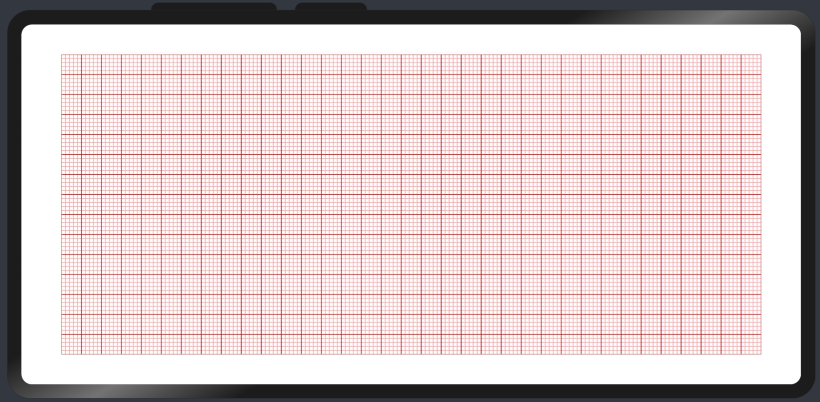
}2、绘制小网格
因为通上面的心电波形图解得知,默认一个小网格的走纸速度是0.04秒,也就是40毫秒,通过传入的数据timeStep字段控制
那么要绘制多少个小格呢?通过画布宽度,和maxTime字段(最大的显示时间,上面代码案例是6000毫秒)可以计算得知,将要绘制。
6000/40=150小格。
// 组件生命周期
  aboutToAppear() {
    // 计算每1小格需要绘制的宽度
    this.littleGridSize = Math.floor(this.ecgData.width / (this.ecgData.maxTime / this.ecgData.timeStep))
    // 计算每1大格需要绘制的宽度(每5小格是1大格)
    this.LargeGridSize = this.littleGridSize * 5
  }
//   绘制小格
  drawLittleGrid = ():void => {
    let c = this.ctx;
    let {width:w, height: h} = this.ecgData;
    c.strokeStyle = this.ecgData.gridColor[0];
    c.lineWidth = 0.5;
    c.beginPath();
    for(let x = 0; x <= w; x += this.littleGridSize){
      c.moveTo(x, 0)
      c.lineTo(x, h)
      c.stroke()
    }
    for(let y = 0; y <= h; y += this.littleGridSize){
      c.moveTo(0, y)
      c.lineTo(w, y)
      c.stroke()
    }
    c.closePath();
  }
3、绘制大网格
每1大格等于5小格。
//  绘制大格
  drawLargeGrid = ():void => {
    let c = this.ctx;
    let {width:w, height: h} = this.ecgData;
    let lg = this.LargeGridSize;
    c.strokeStyle = this.ecgData.gridColor[1];
    c.lineWidth = 0.5;
    c.beginPath();
    for(let x = 0; x <= w; x += lg){
      c.moveTo(x, 0);
      c.lineTo(x, h);
      c.stroke();
    }
    for(let y = 0; y <= h; y += lg){
      c.moveTo(0, y);
      c.lineTo(w, y);
      c.stroke();
    }
    c.closePath();
  }
最后绘制的结果如图:
4、绘制心电波形
获取画布高度的一半位置,作为心电波形的基线,在基线的基础上,通过心电数据源,将每个数据在基线上通过对数据的偏于来绘制点线,最后形成一个折线状态的心电波形线。
// 数据视图更新
  update = (data?: Array<number>):void => {
    let c = this.ctx;
//    c.clearRect(0, 0, this.ecgData.width, this.ecgData.height)
    c.beginPath();
    c.strokeStyle = this.ecgData.waveLineColor;
    c.lineWidth = 1.2;
    c.lineJoin = 'round'
    c.lineCap = 'round'
    let point = data || this.ecgData.data;
    if(point.length === 0) return;

    //开始遍历输出数据
    c.moveTo(0, Math.floor(this.ecgData.height / 2))
    for (let i = 0; i < point.length; i++) {
      let x = i * this.littleGridSize;
      let y = Math.floor(this.ecgData.height / 2) + point[i] * this.LargeGridSize * -1
      c.lineTo(x, y);
      c.stroke();
    }
    c.closePath();

  }
刷新预览器看看效果:
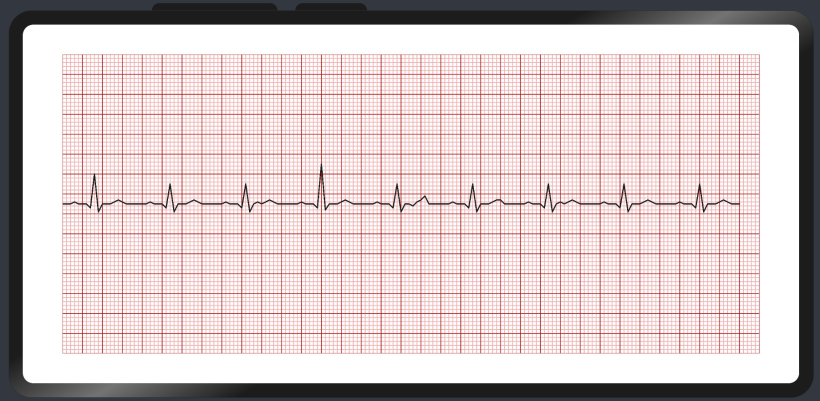
5、最后一步实现心跳的动画效果
这里的动画刷新时间是根据配置的心电图步长来做定时器的时间,默认是40毫秒,也就是每一小格走纸的时间。这样就可以保持跟实际时间对应,不会出现心跳快慢的问题。
当然,这里还是有写误差的,因为代码执行的过程也是消耗时间的,会比实际时间多一丢丢。
//  获取心律数据
  getEcgData = ():void => {
    let points = this.ecgData.data;
    //最后传递出去的数据
    let pointsLast = [];
    //当前取到了第几个数据了
    let currInedx = 0;
    let timer = null;
    clearInterval(timer)
    timer = setInterval( ()=> {
      if(currInedx < points.length){
        currInedx ++;
        pointsLast = points.slice(0,currInedx)
        this.update(pointsLast)
      } else {
        clearInterval(timer)
      }
    },this.ecgData.timeStep)
  }
最后再来看一下心电图的动画效果:

https://gitee.com/yango520/yg-ecg2
绘制这个心电图没有用到重绘机制,动画效果是每次绘制的时候覆盖在原有的波形线上的,但是这样会比重绘整个画布性能更好一些。
通过实现这个demo之后,对心电图上的信息有了全新的了解,我觉得大家都可以去学会看心电图来分析心脏状况,自己理解了总比别人告知更有说服力。
避坑小技巧
- 当代码大变更的时候(一般复制出来单独做一个文件的时候),需要在build选项卡里清理项目,不然也不报错,也不刷新,但是样式就是错乱。
- 预览器开久了之后,当一段时间不动了,再次刷新开启都一直卡着开启中进不去,需要关闭IDE重新打开才可以用。
Recommend
-
6
HarmonyOS ArkUI-eTS常用控制-51CTO.COM HarmonyOS ArkUI-eTS常用控制 作者:清风彬彬 2022-02-23 15:07:22 本篇带给大家ArkUI-eTS常用控制的相关知识,希望能够帮助到你!
-
10
ArkUI(ETS) 自定义图片查看组件-51CTO.COM OpenHarmony - ArkUI(ETS) 自定义图片查看组件 作者:王国菊 2022-05-26 14:50:15 今日分享的组件由subsampling-scale-image-view+swipe...
-
9
4、组件介绍组件包含了UI布局,组件属性定义,组件默认值,组件代码有详细说明,可以直接看代码@Component export struct StreamerButton { // 旋转角度 @State private angle:number = 0; // 旋转速度...
-
6
想了解更多关于开源的内容,请访问:...
-
10
ArkUI eTS PA计算十二生肖--Service Ability-51CTO.COM ArkUI eTS PA计算十二生肖--Service Ability 作者:狼哥Army 2022-07-11 16:26:37 计算生肖由Service Ability负责,eTS只负责...
-
6
HarmonyOS - 基于ArkUI(JS)实现打地鼠游戏-51CTO.COM HarmonyOS - 基于ArkUI(JS)实现打地鼠游戏 作者:尹宝荣 2022-07-13 16:24:12 对于FA目前还在摸索的路上,这个游戏写的比较...
-
6
基于ArkUI (JS) 实现图片旋转验证-51CTO.COM HarmonyOS - 基于ArkUI (JS) 实现图片旋转验证 作者:王少丽 2022-08-05 19:27:22 本文主要结合HarmonyOS官网上的相关组件以及通用API,...
-
7
作者:张呈 WIFI是大家日常必不可少需求,在OpenHarmony的开发中,系统提供了一系列完整的API,在万物互联的这个概念下,相信涉及到wifi功能操作的需求会越来越多,今日分享的是用ets来实现简单的wifi连接操作,可以实现扫描设备附近的wifi并进行连接,结合...
-
6
HarmonyOS - 基于ArkUI(JS)实现黑白翻棋小游戏 作者:苏亚雯 2022-08-22 17:28:34 本文详细讲述了黑白翻棋的编写思路,内含详细解释,有兴趣的小伙伴可以自己动手来制作一个属于自己的黑白翻棋小游戏。
-
1
HarmonyOS- 基于ArkUI(eTs)实现猫头鹰动画 作者:范颖 2022-09-05 15:22:27 我决定用Ets来画一只猫头鹰,看看Ets跟我之前掌握的知识有何不同,在什么地方需要值得注意。
About Joyk
Aggregate valuable and interesting links.
Joyk means Joy of geeK