

Poor retention kills 90% of startups.Here's how you get into the top 10% (and su...
source link: https://nextbigwhat.com/poor-retention-kills-90-of-startups-heres-how-you-get-into-the-top-10-and-survive/
Go to the source link to view the article. You can view the picture content, updated content and better typesetting reading experience. If the link is broken, please click the button below to view the snapshot at that time.

Poor retention kills 90% of startups.Here’s how you get into the top 10% (and survive)
Here’s how you get into the top 10% (and survive):
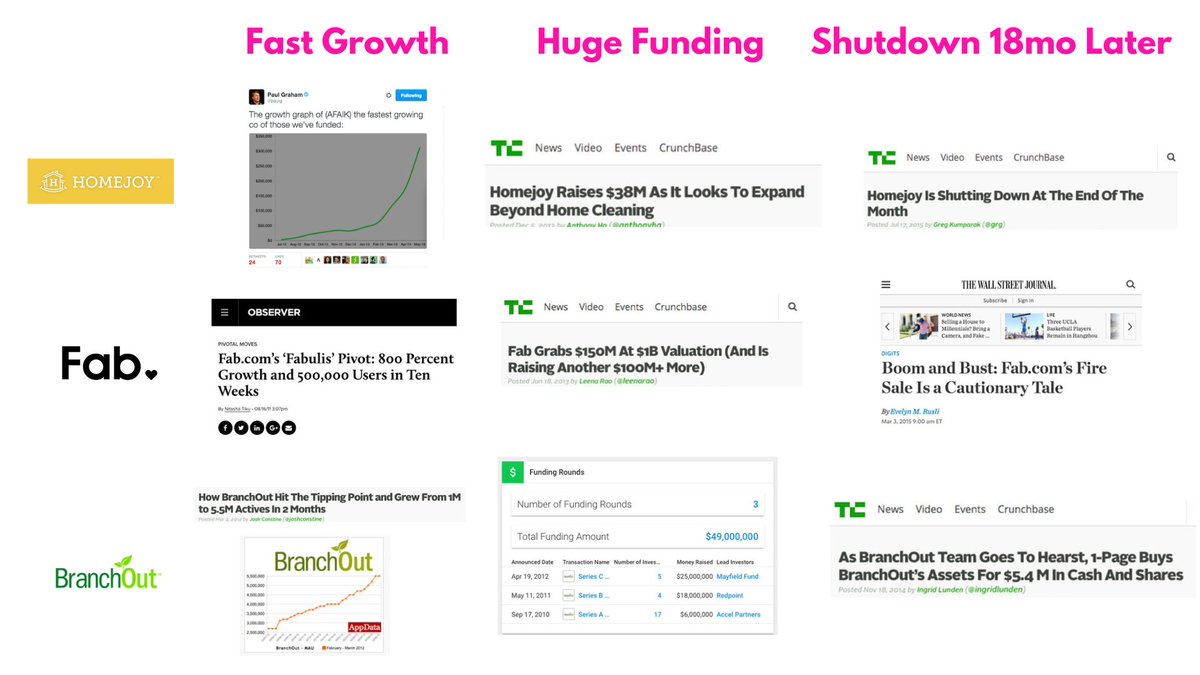
Do you remember Homejoy, Fab, or BranchOut?
3 companies that had:
• Talented teams
• Impressive high growth
• Heavily funded by top VCs
These companies had all the right elements in their favor to be successful
So, why did they fail?
Retention.
They couldn’t hold on to their customers.
Why is it typically put on the back burner of a startup?
Couple of reasons:
1. Prioritize new user growth (shorter-term gains)
2. Easy to cover up poor retention metrics
3. Defined retention metrics incorrectly
There are 3 mistakes to avoid:
1/ Choosing the wrong metric
2/ Choosing the wrong frequency
3/ Choosing the wrong core action
And learn how to choose the right retention metric to set your startup for success.
Defining your retention metric is critical to get right.
It has deep implications for how you’ll run your business.
The metric should reflect your product’s core behavior, not outputs like revenue or # of transactions.
Word of caution: AVOID combining different actions into one metric.
For example, back when Casey Winters was on Pinterest, they created a custom metric:
WARC = Weekly Active Repinner or Clicker
Highlight here: *or*
• Clicker – clicks to the source of the content
Both metrics, in theory, suggested that Pinterest showed you something interesting.
However, there were 2 problems:
In this case, clicks.
This encouraged clickbait-y content and reduced quality.
2) Stopped encouraging the creation of new & different content because you double down on what works – making the content grow stale
• Behavior – your product’s core behavior
• Frequency – the right frequency (natural frequency the user experiences the problem)
• User – the user we should optimize for
Credit: @reforge
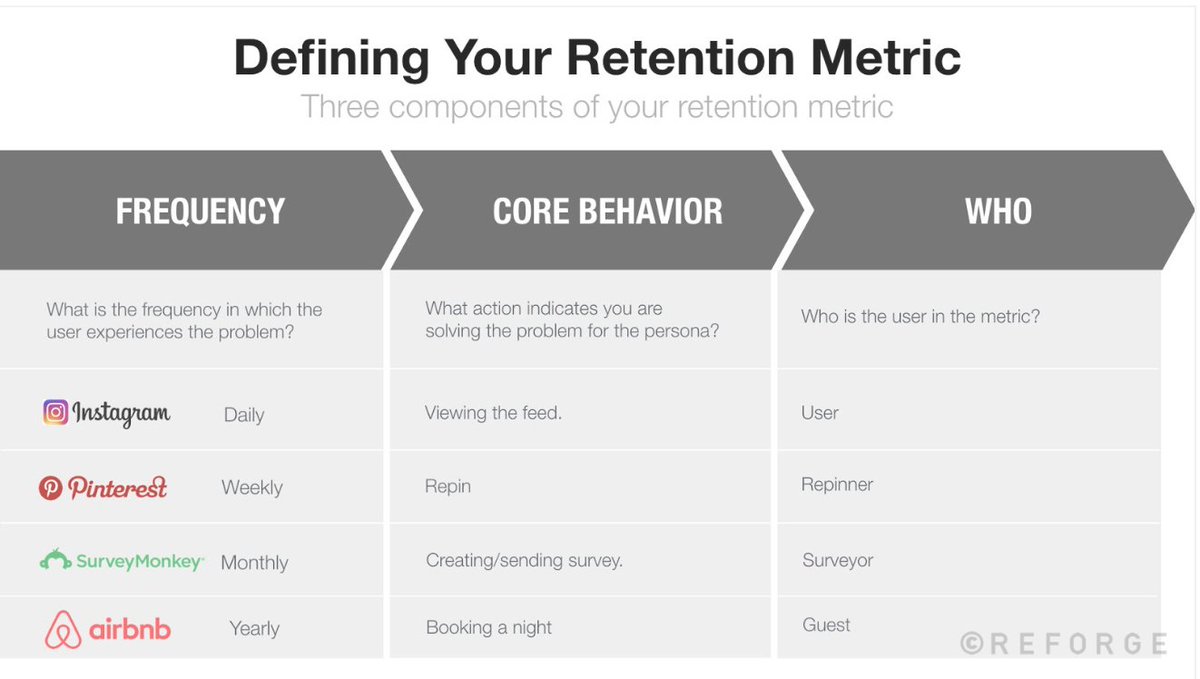
Ask: How often does my user need to engage with the product to be considered active: daily, weekly, monthly?
If you set the frequency too low = forget about you
Either option will lead the team to build features in the wrong direction.
Understand what’s the right cadence for the problem they encounter.
Ask: Which action indicates that we have delivered value?
Similar to what we discussed in selecting the core metric
We need to know what underlying behavior that metric will be based on.
How are we helping users solve the problem?
For example:
People came to Pinterest because they were bored & wanted to find things around their interests.
What core actions could from that problem?
Several.
For example:
> Viewing feed
> Pin/Repin content
> Clicking on something on the feed
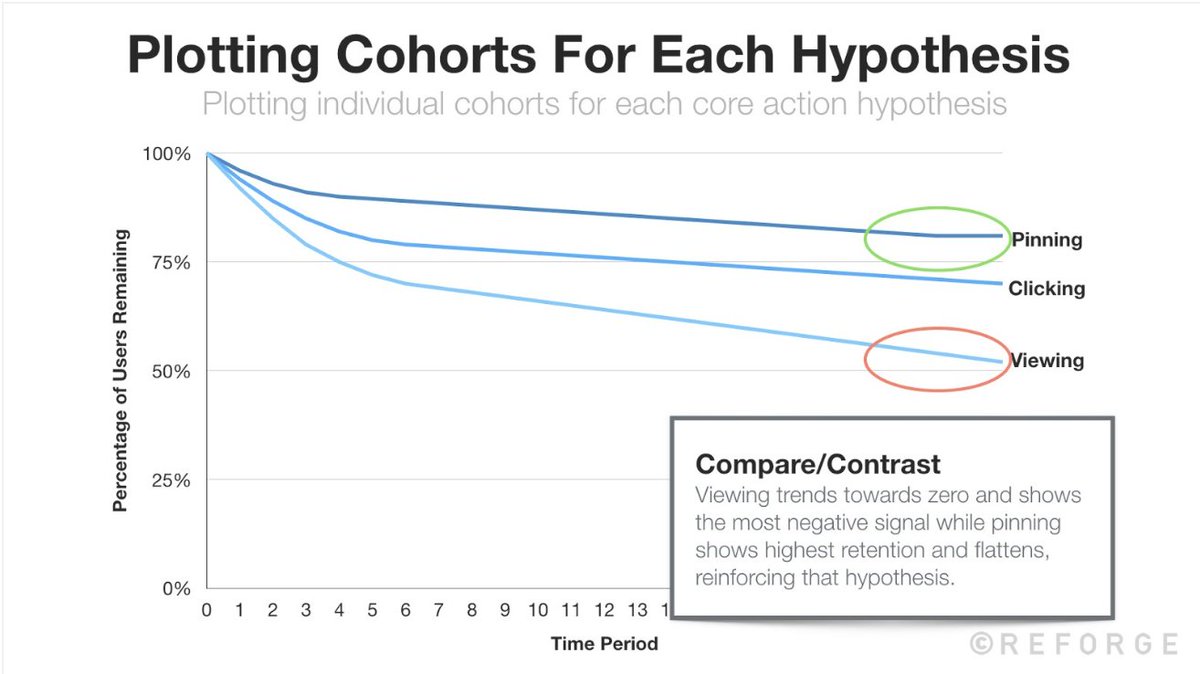
Now, let’s validate each hypothesis with quantitative data.
i) Group users based on the completion of each core action (view, pin/repin, click) + frequency
ii) Create retention curves for the different hypotheses
iii) Analyze the retention by comparing each hypothesis
Credit: @reforge
Part I. 3 key components define your retention metric:
• Behavior
• Frequency
• User
This will influence what features you’ll build and actions you’ll take moving forward.
1. Prioritize new user growth
2. Cover up poor retention metrics
3. Defined retention metrics incorrectly
– Choosing the wrong metric
– Choosing the wrong frequency
– Choosing the wrong core action
• The team at Reforge
• Casey Winters, CPO at Eventbrite
If you found this thread valuable:
1. Follow me @samanthalcc for more marketing insights to grow your startup
2. RT the tweet below to help your audience avoid critical retention mistakes https://twitter.com/1487096611/status/1578003683534594049
Follow: @samanthalcc
[Via]
[Via]
» Download CHAI APP: The News App for Tech Professionals  (Android, iOS)

Recommend
About Joyk
Aggregate valuable and interesting links.
Joyk means Joy of geeK