

Prometheus学习 - wuenwuen
source link: https://www.cnblogs.com/MrReboot/p/16637903.html
Go to the source link to view the article. You can view the picture content, updated content and better typesetting reading experience. If the link is broken, please click the button below to view the snapshot at that time.
Prometheus介绍
主要特征#
- 使用时间序列数据(
tsdb)的多维度数据模型 - 灵活的查询语言(
PromQL) - 不依赖分布式存储,单个节点是自主的
- 通过
http请求拉取(pull)时间序列数据(tsdb) - 通过网关推送(
push)时间序列数据(tsdb) - 支持监控目标的动态服务发现和静态配置
- 多样化的图像界面展示,包括
grafana
架构图及相关组件#
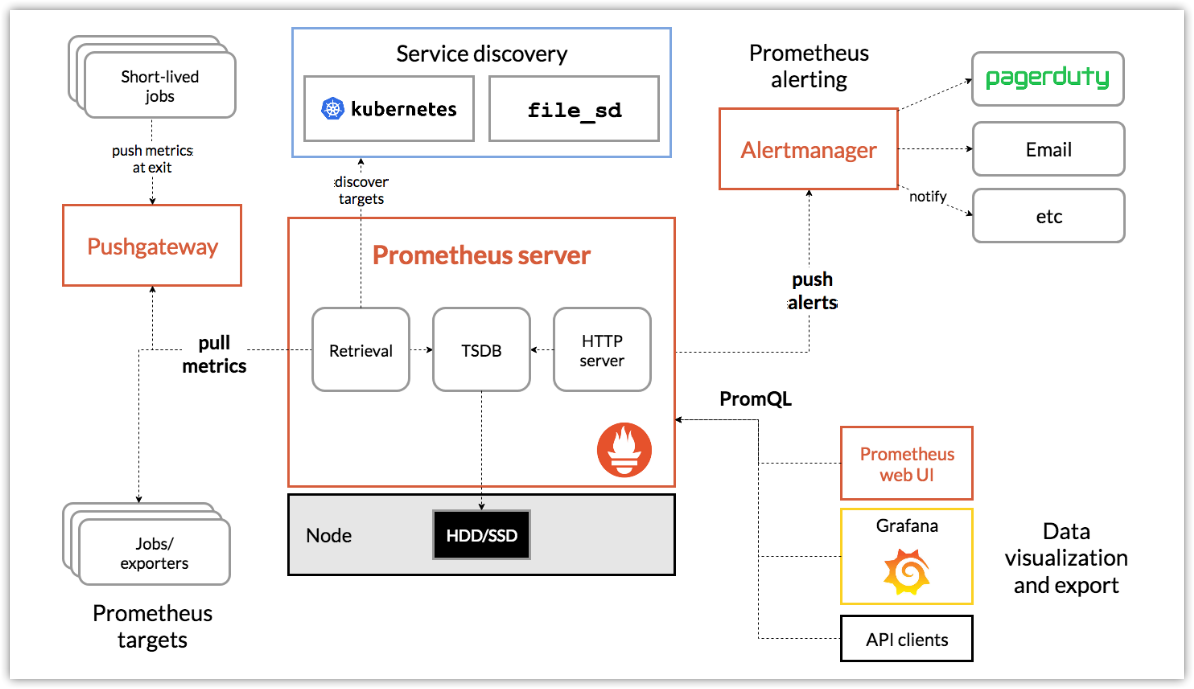
- 主服务Prometheus Server负责抓取和存储时间序列数据
- 客户库负责检测应用程序代码
- 支持短期任务的PUSH网关
- 多种数据出口(exporter)
- 告警器Alertmanager
- 命令行查询工具PromQL
- 其他各种支撑工具
重要概念#
数据模型#
Prometheus将所有数据存储为时间序列(time series),即一个属于相同指标和相同标签维度的带时间戳的数据流。除了存储时间序列数据外,也可以将临时的时序数据作为查询结果。
metric和label#
每个时间序列(time series)由metric指标名和可选的label标签(键值对)唯一确定。
metric反映了被监控样本的含义(如:http_requests_total - 接收http请求的总数),metric指标名可以包含字母、数字、下划线、冒号(需要符合正则:[a-zA-Z_:][a-zA-Z0-9_:]*)。
Label启动了prometheus的多维数据模型。对于同一个metric,打上不同的label组合,就会形成特定维度的metric实例。查询语言PromQL就可以基于这些维度进行过滤或聚合。Lable标签名可以包含字母、数字、下划线(需要符合正则:[a-zA-Z_][a-zA-Z0-9_]*)。以__作为前缀的标签,是系统保留的关键字,只能在系统内部使用。
api_http_requests_total{method="POST", handler="/messages"}
{__name__="api_http_requests_total",method="POST", handler="/messages"}
Samples采样值#
采样值是一个具体的时间序列数据,有序的采样值形成时间序列数据列表。
采样值包含两部分:
- 一个64位的浮点值
- 一个精确到毫秒级的时间戳
Notation标记#
时间序列通常由metric和一组label进行标记。
<metric name>{<label name>=<label value>, ...}
例如,metrci名称为api_http_requests_total,标签为method="POST",handler="/messages",则该时序数据可以标记如下:
api_http_requests_total{method="POST", handler="/messages"}
指标类型#
Counter(只增不减的计数器)#
Gauge(可增可减的测量器)#
当前值,暂时性
Histogram(柱状图)#
Summary (汇总)#
任务和实例#
- instance
Getting Started#
安装#
tar -zxvf prometheus-2.33.1.linux-amd64.tar.gz -C /root/	# 上传安装包后解压至root目录
mv prometheus-2.33.1.linux-amd64 prometheus
cd prometheus/
配置#
配置文件为prometheus.yml
global:
  scrape_interval:     15s
  evaluation_interval: 15s

rule_files:
  # - "first.rules"
  # - "second.rules"

scrape_configs:
  - job_name: prometheus
    static_configs:
      - targets: ['localhost:9090']
global:全局配置
scrape_interval:抓取目标的时间间隔,默认1分钟
evaluation_interval:计算规则的时间检查,默认1分钟。Promethues使用该规则创建新的时序数据和告警。
rule_files:提供给PS加载的规则文件的位置
scrape_configs:配置PS的监控目标。由于PS也会暴露自身的运行数据,所以PS也可以抓取和监控自身健康状态。
job_name:job名
static_configs:静态配置
targets:监控目标,'localhost:9090'表示从本地9090端口抓取数据,抓取url默认为http://localhost:9090/metrics。同时PS自身也通过该url暴露数据。
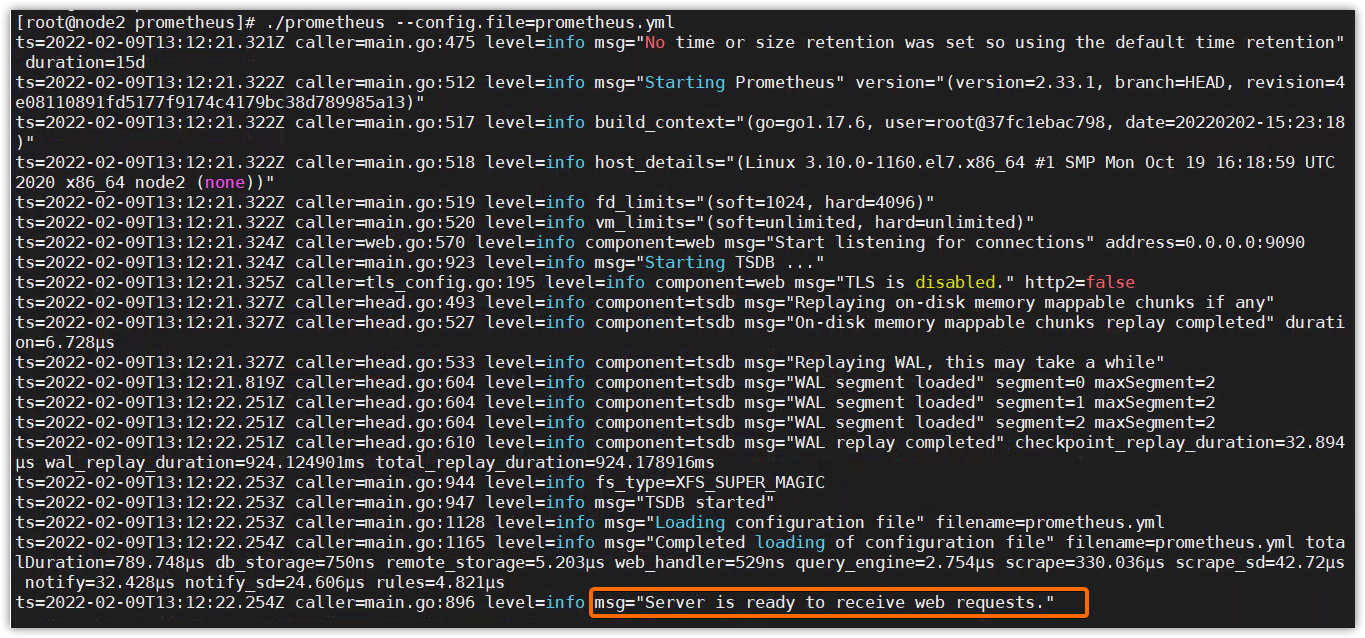
启动#
$ ./prometheus --config.file=prometheus.yml
# 或
$ nohup ./prometheus --config.file=prometheus.yml --web.enable-lifecycle &		# 后台运行,动态重载配置
访问#
访问Prometheus:http://localhost:9090或http://localhost:9090/graph
访问自身metrics接口:http://localhost:9090/metrics
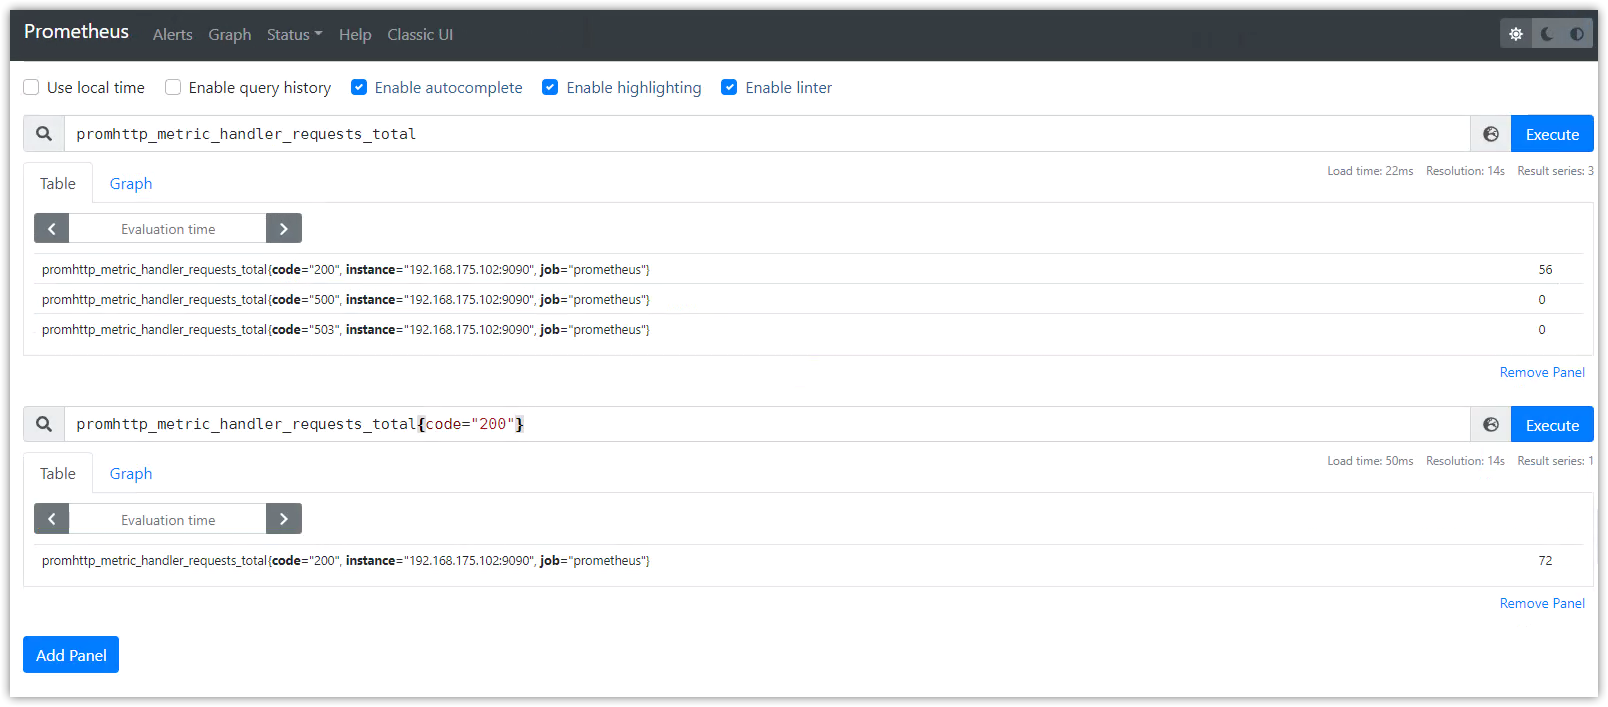
UI数据查询#
使用PromQL查询数据,示例如下:
数据列表显示
promhttp_metric_handler_requests_total:PS的/metrics接口请求总数
promhttp_metric_handler_requests_total{code="200"}:返回http200的请求数
prometheus_target_interval_length_seconds:两次数据抓取的实际时间间隔
count(prometheus_target_interval_length_seconds):返回的时序数量
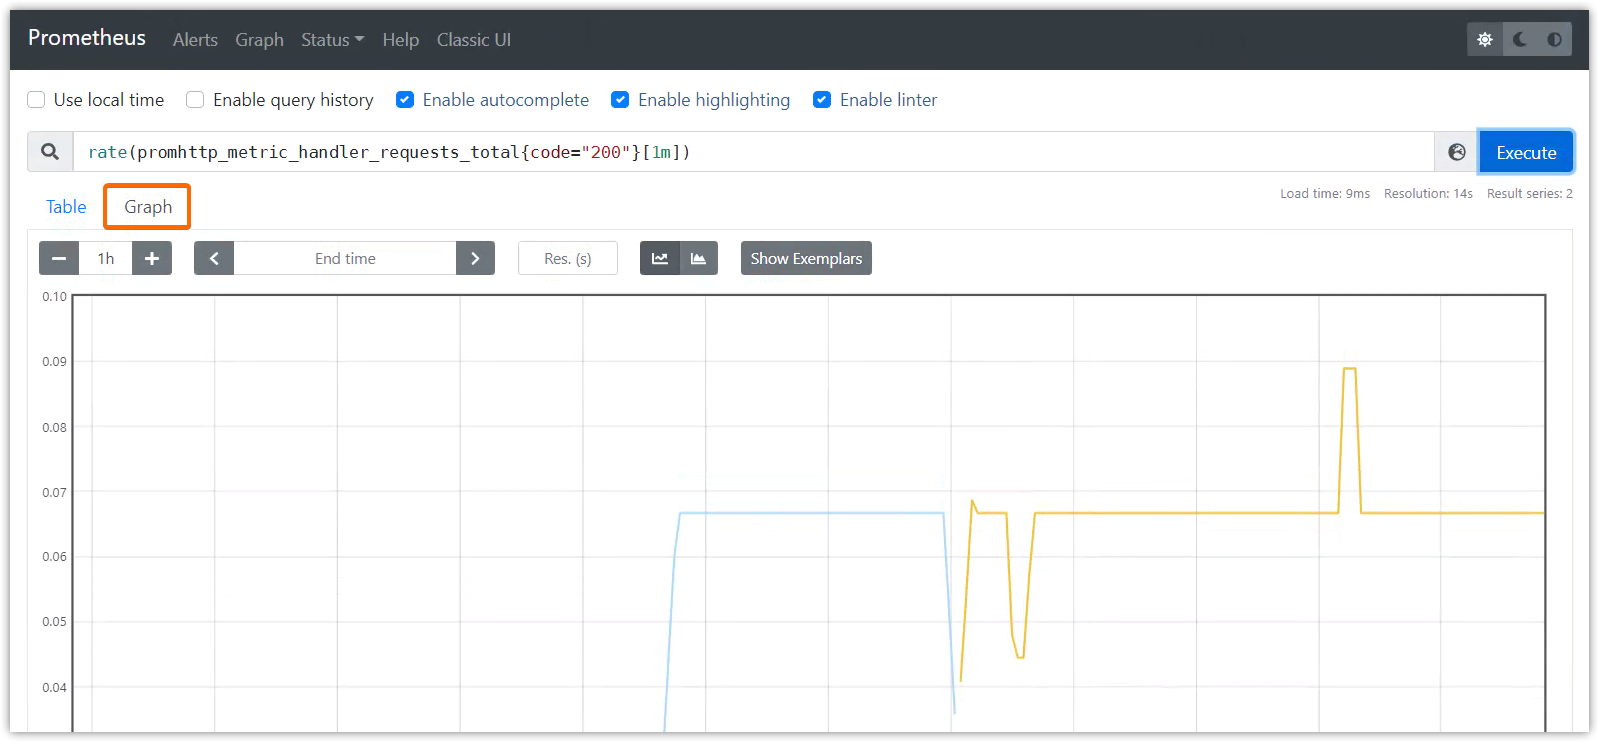
rate(promhttp_metric_handler_requests_total{code="200"}[1m])
监控其它目标#
安装并启动node_exporter#
# 安装
tar -xzvf node_exporter-1.3.1.linux-amd64.tar.gz
mv node_exporter-1.3.1.linux-amd64/ node_exporter
cd node_exporter
# 启动
nohup ./node_exporter --web.listen-address 192.168.175.102:8080 &
nohup ./node_exporter --web.listen-address 192.168.175.102:8081 &
nohup ./node_exporter --web.listen-address 192.168.175.102:8082 &
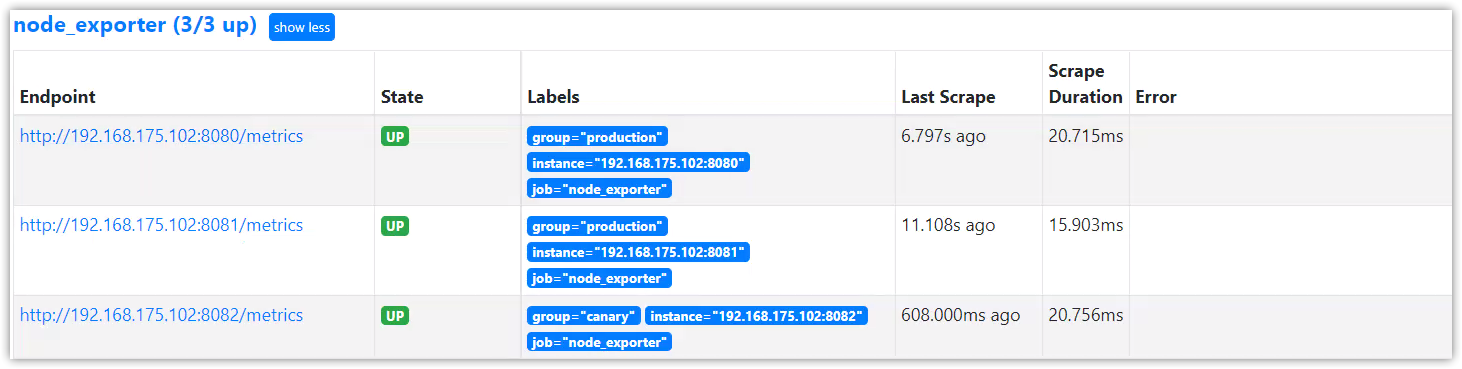
这时可以使用http://192.168.175.102:8080/metrics、http://192.168.175.102:8081/metrics、http://192.168.175.102:8082/metrics访问node_exporter的监控数据了。
配置Prometheus监控目标node_exporter#
在prometheus.yml文件中的scrape_configs配置域下添加以下的配置(注意格式):
- job_name: "node_exporter"
    static_configs:
      - targets: ['192.168.175.102:8080', '192.168.175.102:8081']
        labels:
          group: 'production'
      - targets: ['192.168.175.102:8082']
        labels:
          group: 'canary'
重启 Prometheus 后,打开UI界面,便可以查询node_exporter的相关指标数据,如node_cpu_seconds_total

安装#
linux安装#
tar -zxvf prometheus-2.33.1.linux-amd64.tar.gz -C /root/	# 上传安装包后解压至root目录
mv prometheus-2.33.1.linux-amd64 prometheus
cd prometheus/
目录结构:
$ tree $PWD
/root/prometheus
├── console_libraries
│   ├── menu.lib
│   └── prom.lib
├── consoles
│   ├── index.html.example
│   ├── node-cpu.html
│   ├── node-disk.html
│   ├── node.html
│   ├── node-overview.html
│   ├── prometheus.html
│   └── prometheus-overview.html
├── LICENSE
├── NOTICE
├── prometheus
├── prometheus.yml
└── promtool

2 directories, 14 files
docker安装#
$ docker run -td -p 9090:9090 --name prometheus1 prom/prometheus
Dockerfile构建#
Prometheus之Dockerfile编写、镜像构建、容器启动 - wuenwuen - 博客园 (cnblogs.com)
基础配置(⭐)#
Prometheus 通过命令行参数和配置文件进行配置,命令行主要用来配置不可变的系统参数(比如存储位置、保存在磁盘或内存的数据量),配置文件主要用来定义 jobs 和 instance 的抓取规则,以及规则文件。
./prometheus -h 查看所有的命令行选项。
Prometheus可以在运行时重载配置,可以通过发送SIGHUP信号给PS进程,或者发送POST请求给/-/reload端点(前提是启用了--web.enable-lifecycle选项)。
./prometheus --config.file=prometheus.yml --web.enable-lifecycle
curl -X POST http://192.168.175.102:9090/-/reload
如果新配置格式错误,则该配置不生效。
--config.file选项指定加载的yaml格式配置文件。
配置语法如下,[]方括号表示该配置是可选的,[ - ... ]方括号中有端横线表示该配置是列表。对于非列表参数,其值被设置为默认值。
占位符:
<boolean>: a boolean that can take the valuestrueorfalse<duration>: a duration matching the regular expression((([0-9]+)y)?(([0-9]+)w)?(([0-9]+)d)?(([0-9]+)h)?(([0-9]+)m)?(([0-9]+)s)?(([0-9]+)ms)?|0), e.g.1d,1h30m,5m,10s<filename>: a valid path in the current working directory<host>: a valid string consisting of a hostname or IP followed by an optional port number<int>: an integer value<labelname>: a string matching the regular expression[a-zA-Z_][a-zA-Z0-9_]*<labelvalue>: a string of unicode characters<path>: a valid URL path<scheme>: a string that can take the valueshttporhttps<secret>: a regular string that is a secret, such as a password<string>: a regular string<size>: a size in bytes, e.g.512MB. A unit is required. Supported units: B, KB, MB, GB, TB, PB, EB.<tmpl_string>: a string which is template-expanded before usage
配置文件格式#
global部分是全局配置,全局有效,也是其它配置部分的默认值。
global:
  [ scrape_interval: <duration> | default = 1m ]

  [ scrape_timeout: <duration> | default = 10s ]

  [ evaluation_interval: <duration> | default = 1m ]

  external_labels:
    [ <labelname>: <labelvalue> ... ]

  [ query_log_file: <string> ]

rule_files:
  [ - <filepath_glob> ... ]				# 规则文件路径列表,这些规则文件中定义了预计算规则和告警规则

scrape_configs:							# 监控目标,及数据抓取配置
  [ - <scrape_config> ... ]

alerting:
  alert_relabel_configs:
    [ - <relabel_config> ... ]
  alertmanagers:
    [ - <alertmanager_config> ... ]

remote_write:
  [ - <remote_write> ... ]

remote_read:
  [ - <remote_read> ... ]

storage:
  [ - <exemplars> ... ]
一个完整的配置示例:参考https://github.com/prometheus/prometheus/blob/release-2.33/config/testdata/conf.good.yml
scrape_config配置区域#
scrape_config配置指定了一系列的监控目标targets和描述如何抓取该目标数据的相关参数。一般情况下,一个数据抓取配置仅指定一个job任务。当然高级的配置中可能不一样。
监控目标targets可以通过static_configs进行静态配置,也可以通过file_sd_configs服务发现机制来动态发现。
relabel_configs配置允许在抓取目标数据之前,对target和他的labels进行修改。
job_name参数值必须是唯一的。
下面是scrape_config常用的配置,更多信息请参考官网。
job_name: <job_name>

[ scrape_interval: <duration> | default = <global_config.scrape_interval> ]

[ scrape_timeout: <duration> | default = <global_config.scrape_timeout> ]

[ metrics_path: <path> | default = /metrics ]

[ scheme: <scheme> | default = http ]

file_sd_configs:						# 服务发现配置的文件列表,服务发现指的是发现抓取的目标
  [ - <file_sd_config> ... ]

static_configs:							# 打标签的静态配置的监控目标列表
  [ - <static_config> ... ]

relabel_configs:						# targer标签重构配置列表
  [ - <relabel_config> ... ]

metric_relabel_configs:					# metric标签重构列表
  [ - <relabel_config> ... ]

http_sd_configs:						# 服务发现配置的http列表
  [ - <http_sd_config> ... ]
上面的参数在scrape_config区域如何配置,请参考上面的示例文件。
static_configs配置域#
ststic_config配置允许指定一个targets列表和一个label标签集,它是在数据抓取配置中指定静态目标的规范方法。
# The targets specified by the static config.
targets:
  [ - '<host>' ]

# Labels assigned to all metrics scraped from the targets.
labels:
  [ <labelname>: <labelvalue> ... ]
relabel_configs配置域#
relabeling标签重构可用来重写目标抓取之前的label标签集。
重构之前,除了配置的指定标签之外,目标自带的job标签,其值为job_name的配置值,__address__标签被设置为目标地址<host>:<port>。
重构之后,新标签instance被默认设置为__address__的值,除非特别配置。
__scheme__和__metrics_path__标签被设置为目标的协议和metrics路径;__scrape_interval__标签和__scrape_timeout__标签被分别设置为配置的scrape_interval和scrape_timeout相同的值
此外,以__meta__为前缀的标签也可以重构,它们由服务发现机制进行配置。
重构完成之后,__前缀的标签将从标签集中移除。
如果重构步骤需要暂时存储标签值(作为后续重构步骤的输入),可以使用__tmp前缀的标签名。该前缀不会被prometheus自身使用。
[ source_labels: '[' <labelname> [, ...] ']' ]		# 配置为现有标签的列表

[ separator: <string> | default = ; ]				# 多个label值之间连接的分隔符

[ target_label: <labelname> ]						# 目标标签

[ regex: <regex> | default = (.*) ]					# 从源标签中使用该正则进行匹配或提取值

[ modulus: <int> ]

[ replacement: <string> | default = $1 ]			# 若上面的regex正则表达式匹配了,则将此处的配置值替换掉目标标签的值;
													# 可使用正则捕获组,默认为$1,即使用第一个捕获组进行替换

[ action: <relabel_action> | default = replace ]	# 基于正则匹配执行的动作,默认为替换。(这个值尤其重要,它决定了上述各配置的具体行为)
separator: <string>指定分隔符,用于将source_labels配置的多个标签值连接成新值;比如分隔符为;,标签值分别为aaa和bbb,则使用分隔符连接后组成的新值为"aaa;bbb"
regex: <regex>是有效的正则表达式,需要它来对source_labels组合后的标签值进行匹配,并提供给replacement进行replace, keep, drop, labelmap,labeldrop,labelkeep动作。使用.*<regex>.*来取消正则。
action: <relabel_action>决定标签重构的动作:
replace:替换。regex对多个标签值组合后的字符串进行匹配,然后将目标target_label的值替换为replacement的值。如果regex不匹配,则不替换。keep:当regex正则表达式不匹配组合后的标签值时,丢弃整个监控目标。匹配时,保持原始标签信息不变。drop:当regex正则表达式匹配组合后的标签值时,丢弃整个监控目标。不匹配时,保持原始标签信息不变。hashmod:将target_label设置为source_labels的散列模数labelmap: 使用regex去匹配所有的标签名,然后使用匹配上的标签名的值来替换replacement标签名的值(如果replacement标签名没有,则新增)。labeldrop:使用regex去匹配所有的标签名,然后从标签集中删除所有匹配的标签。该值只能和regex参数结合使用,不能配置其它参数。labelkeep:使用regex匹配所有的标签名,然后从标签集中删除所有不匹配的标签。该值只能和regex参数结合使用,不能配置其它参数。
replacement: <string>预备替换target_label值的字符串,可以使用正则捕获组进行反向引用。
这里有些复杂,结合相关示例进行说明。
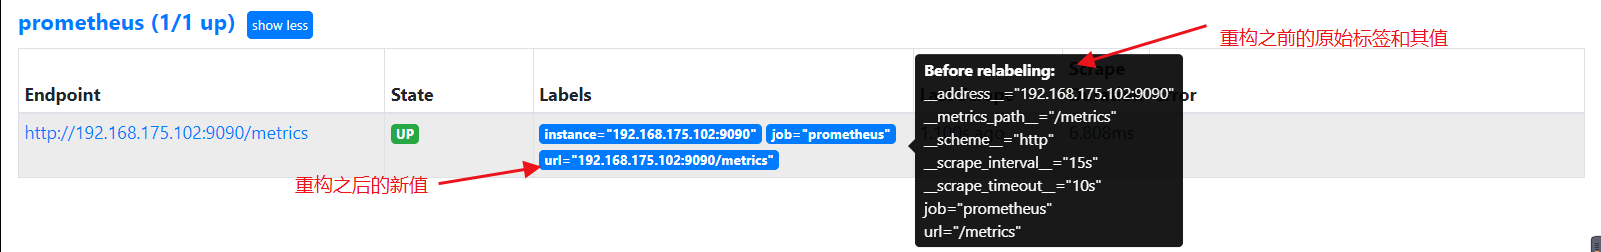
第一个示例,根据多个标签的值,重构出目标标签的新值,配置如下:
scrape_configs:
	- job_name: "prometheus"
	  static_configs:
      	- targets: ["192.168.175.102:9090"]
          labels:
            url: '/metrics'									# 构建一个标签为url,值为/metrics
      relabel_configs:
      - source_labels: [__address__, __metrics_path__]
        target_label: url
        regex: (.*);(.*)
        replacement: $1$2
        action: replace
配置解读:
source_labels: [__address__, __metrics_path__]
# __address__标签的值为192.168.175.102:9090,__metrics_path__标签的值为/metrics,两个标签的值使用分隔符(;号,由separator指定)组成新值,新值为字符串"192.168.175.102:9090;/metrics"

regex: (.*);(.*)
# regex与该新值做匹配,第一个捕获组为"192.168.175.102:9090",第二个捕获组为"/metrics"

action: replace
#  action的动作为replace,将目标标签url的值替换为replacement的指定值

replacement: $1$2
# replacement使用正则的反向引用,使用捕获组1和捕获组2,$1$2则表示字符串"192.168.175.102:9090/metrics"

target_label: url
# 该url标签的值使用replacement的值进行替换,url标签的新值为"192.168.175.102:9090/metrics"
重载prometheus的配置:
curl -X POST 192.168.175.102:9090/-/reload
在UI中查看url标签值,果然替换成了新值:
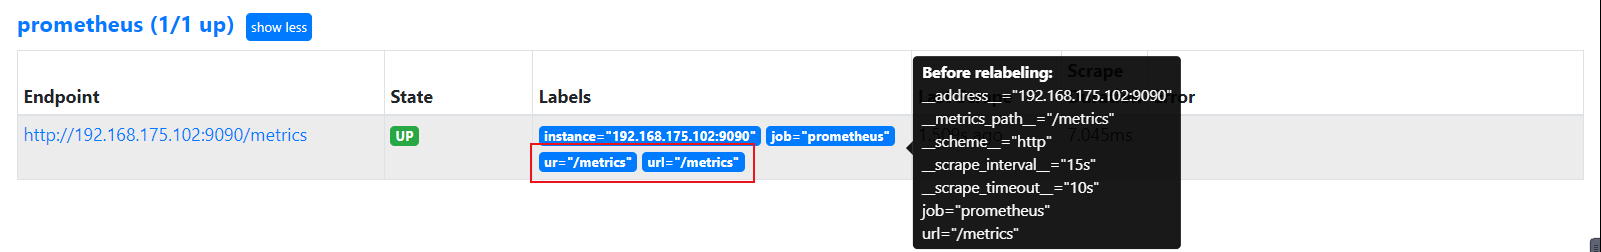
第二个示例,使用labelmap重构出一个新标签,配置如下:
scrape_configs:
	- job_name: "prometheus"
	  static_configs:
      	- targets: ["192.168.175.102:9090"]
          labels:
            url: '/metrics'									# 构建一个标签为url,值为/metrics
      relabel_configs:
      - regex: (ur)l
        replacement: $1
        action: labelmap
配置解读:
# 标签名有__address__、__metrics_path__、__scheme__、__、__scrape_interval__、__scrape_timeout__、job、url等

regex: (ur)l
# 正则表达式(ur)l将与上述标签名进行匹配,匹配结果为url,捕获组为ur;

replacement: $1
# replacement的值使用regex的第一个捕获组,也即"ur"字符串

action: labelmap
# 使用regex匹配标签url的值替换掉replacement指定的标签ur的值。由于没有ur标签,所有会创建一个ur新标签,其值为url的"/metrics"
重载prometheus的配置:
curl -X POST 192.168.175.102:9090/-/reload
在UI中查看新标签和其值:
file_sd_configs配置域#
基于文件的服务发现提供了一些通用的办法去配置静态目标和自定义的服务发现接口。
它读取一系列包含了多个<static_config>配置的文件,同时通过磁盘监控来探测文件配置的变化。该文件可以写成yaml或json格式,格式错误的配置组不生效。
该文件必须包含一系列静态配置,使用以下格式:
YAML yaml - targets: [ - '<host>' ] labels: [ <labelname>: <labelvalue> ... ]
JSON json [ { "targets": [ "<host>", ... ], "labels": { "<labelname>": "<labelvalue>", ... } }, ... ]
文件内容将以指定的刷新时间被重新读取,文件后缀必须为json、yaml或yml。
files:
  [ - <filename_pattern> ... ]				# 读取的文件列表,后缀必须为json/yaml/yml,最后一个文件路径可以使用通配符*,比如my/path/tg_*.json

[ refresh_interval: <duration> | default = 5m ]			# 重新加载的时间周期
- job_name: "node_exporter"
  static_configs:
    - targets: ['192.168.175.102:8080', '192.168.175.102:8081']
      labels:
        group: 'production'
    - targets: ['192.168.175.102:8082']
      labels:
        group: 'canary'
改造如下:
- job_name: "node_exporter"
  file_sd_configs:
    - files:
        - /root/prometheus/static_config/node_exporter.yml
      refresh_interval: 5m
/root/prometheus/static_config/node_exporter.yml配置如下:
- targets: ['192.168.175.102:8080', '192.168.175.102:8081']
  labels:
    group: 'production'
- targets: ['192.168.175.102:8082']
  labels:
    group: 'canary'
重载prometheus配置:
curl -X POST 192.168.175.102:9090/-/reload
rule_files配置区域#
Prometheus支持预计算规则和告警规则,需要将这两类规则写入单独的规则文件中,然后在rule_files配置中引入。
rule_files的配置格式:
rule_files:
  [ - <filepath_glob> ... ]				# 规则文件路径列表,这些规则文件中定义了预计算规则和告警规则
promtool命令行工具可以用来执行规则文件的语法检查:
promtool check rules /path/to/example.rules.yml # 语法正确退出码为0,错误退出码为1
通过预计算规则,可以预先计算经常使用的或运算昂贵的PromQL表达式,并将这些表达式的结果保存为一组新时间序列。查询这些预计算结果通常比直接执行原始表达式快得多。对于每次刷新时都要重复查询相同表达式的仪表板来说很有帮助。
通过告警规则,可以基于PromQL表达式定义告警条件,Prometheus后端对这些告警规则进行周期性计算,当满足触发条件后则会触发告警通知。当告警表达式在给定时间点产生一个或者多个向量元素,这个告警就会统计这些活跃的元素标签集。
预计算规则和告警规则配置方式#
预计算规则和告警规则都配置在规则文件的同一个规则组group中,一个组内的rules规则以指定的时间间隔按顺序运行。
规则文件的groups配置语法:
groups:
  [ - <rule_group> ]
rule_group配置#
rule_group中配置一个规则组,在该规则组内的rules下配置预计算规则或告警规则
name: <string>						# 规则组的名称

[ interval: <duration> | default = global.evaluation_interval ]			# 组内规则的计算周期

[ limit: <int> | default = 0 ]		# 限制告警规则的告警数量、或限制预计算规则产生的时序数量

rules:
  [ - <rule> ... ]
groups:
- name: example
  rules:
  	[ - <rule> ... ]
rule配置#
<rule>要么定义预计算规则要么定义告警规则,若同时定义了告警规则和预定义规则,则以列表的方式存放在rules下组成一个规则组。
预计算规则的定义语法
record: <string>						# 输出的metrics时序名称

expr: <string>							# 预计算的PromQL表达式。

labels:									# 存储结果之前添加或重写的标签
  [ <labelname>: <labelvalue> ]
groups:
  - name: example
    rules:
    - record: job:http_inprogress_requests:sum
      expr: sum by (job) (http_inprogress_requests)
告警规则的定义语法
alert: <string>							# 告警名称

expr: <string>							# 告警的PromQL表达式

[ for: <duration> | default = 0s ]		# 告警的等待时间,只有当expr达到条件并持续一段时间,才会发送告警。等待期间告警状态为pending

labels:									# 为告警添加或重写的标签
  [ <labelname>: <tmpl_string> ]

annotations:							# 告警描述; 指定一组附加信息,比如用于描述告警详细信息的文字等,这些内容在告警产生时会一同作为参数发送到Alertmanager
  [ <labelname>: <tmpl_string> ]
groups:
- name: example
  rules:
  - alert: HighRequestLatency
    expr: job:request_latency_seconds:mean5m{job="myjob"} > 0.5
    for: 10m
    labels:
      severity: page
    annotations:
      summary: High request latency
告警描述模板化
一般来说,在告警规则文件的annotations中使用summary描述告警的概要信息,description用于描述告警的详细信息。同时Alertmanager的UI也会根据这两个标签值,显示告警信息。
通过模板化label和annotation中的值,可以提高告警信息的可读性。
模板定义格式如下:
# To insert a firing element's label values:
{{ $labels.<labelname> }}
# To insert the numeric expression value of the firing element:
{{ $value }}
$labels变量保存告警标签的键值对;
$value变量保存当前PromQL表达式计算的样本值;
通过$labels.<labelname>可以访问当前告警实例中指定标签的值。
groups:
- name: example
  rules:

  # Alert for any instance that is unreachable for >5 minutes.
  - alert: InstanceDown
    expr: up == 0
    for: 5m
    labels:
      severity: page
    annotations:
      summary: "Instance {{ $labels.instance }} down"
      description: "{{ $labels.instance }} of job {{ $labels.job }} has been down for more than 5 minutes."

  # Alert for any instance that has a median request latency >1s.
  - alert: APIHighRequestLatency
    expr: api_http_request_latencies_second{quantile="0.5"} > 1
    for: 10m
    annotations:
      summary: "High request latency on {{ $labels.instance }}"
      description: "{{ $labels.instance }} has a median request latency above 1s (current value: {{ $value }}s)"
可以通过UI界面的Alerts菜单查看当前发送(firing)或挂起(pending)的告警信息,以及所有的告警规则。
可以通过UI界面的Rules菜单查看所有规则组(包含预计算规则和告警规则)。
prometheus.yml文件配置
rule_files:
   - /root/prometheus/first_rules.yml
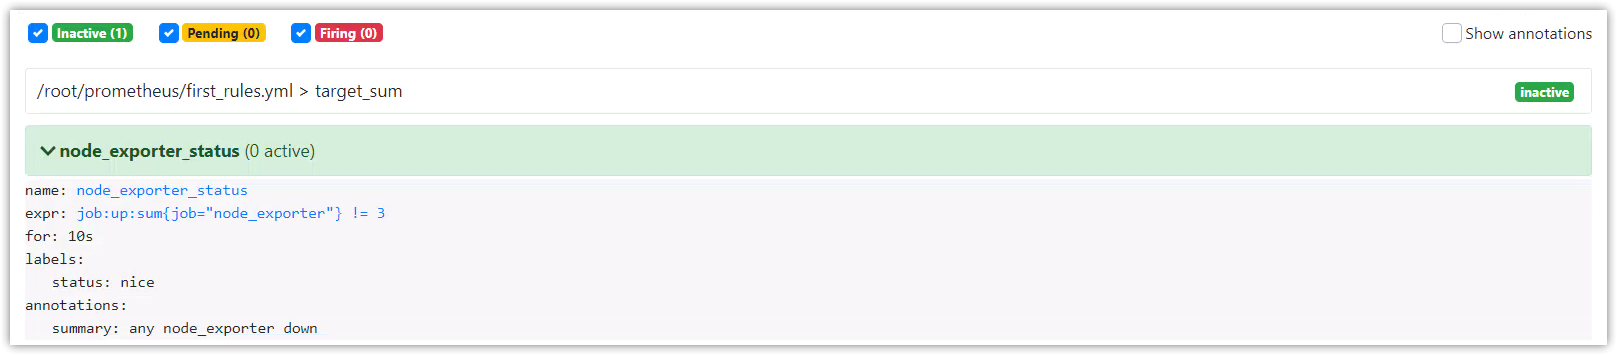
first_rules.yml文件配置
groups:
  - name: target_sum
    rules:
    - record: job:up:sum
      expr: sum(up)by(job)
    - alert: node_exporter_status
      expr: job:up:sum{job="node_exporter"} != 3
      for: 3s
      labels:
        status: nice
      annotations:
        summary: any node_exporter down
重新加载:
$ curl -X POST http://192.168.175.102:9090/-/reload
在Rules界面查看

在Alerts界面查看
停止一个node_exporter进程,观察告警信息
告警表达式的值为2,等待3秒后将触发告警

告警活动状态

Prometheus查询(⭐)#
PromQL(Prometheus Query Language)可以对时序进行选择和聚合。
PromQL基础#
表达式语言数据类型#
在PromQL中,任何表达式或者子表达式都可以归为四种类型:
Instant vector:瞬时向量,具有相同时间戳的时序集合。Range vector:范围向量,跨时间范围的时序集合。Scalar:标量,简单的浮点数。String:字符串,当前未使用。
根据使用场景(例如:图表 或 表格)不同,在PromeQL中可使用的数据类型也不同。例如:瞬时向量类型是唯一可以直接在图表中使用的。
Literals#
字符串类型
字符串可以用单引号、双引号或者反引号表示,PromQL遵循与Go相同的转义规则。

标量:浮点数类型
scalar标量浮点数能可以被写成整数或浮点数的格式
[-+]?(
      [0-9]*\.?[0-9]+([eE][-+]?[0-9]+)?
    | 0[xX][0-9a-fA-F]+
    | [nN][aA][nN]
    | [iI][nN][fF]
)
23
-2.43
3.4e-9
0x8f
-Inf
NaN
时序选择器(Time series Selectors)#
瞬时向量选择器
瞬时向量选择器可以选择出时序集合,其中每个时序都具有一个当下时间戳的样本值。
最简单的格式为,只有配置一个指标名。这个瞬时向量的查询结果将包含所有的时序元素。
prometheus_http_requests_total
标签选择器及其操作符
在指标名后面使用{}和标签选择器可以对这些时序数据做进一步的过滤:
prometheus_http_requests_total{code="200"}
标签选择器的操作符可以使用下面这个:
=: 精确地匹配标签给定的值!=: 不等于给定的标签值=~: 选择匹配正则表达的标签!~: 选择不匹配正则表达式的标签
prometheus_http_requests_total{code!~"200|500"}
如果将标签值设为空,那么标签选择器将筛选出所有没有设置标签的指标数据。否则查询为空。
向量选择器,必须指定一个指标名称,或者一个无法匹配空串标签的选择器,如下
{job=~".*"} # 错误,因为.*正则可以匹配到空字符串
下面是正确的方式,因为无法匹配到空标签值
{job=~".+"}              # Good!
{job=~".*",method="get"} # Good!
除了使用<metric name>{label=value}的形式以外,我们还可以使用内置的__name__标签来指定监控指标名称:
{__name__=~"http_request_total"} # 合法
{__name__=~"node_disk_bytes_read|node_disk_bytes_written"} # 合法
表达式http_requests_total等价于{__name__="http_requests_total"}。
其他的匹配器,如:= ( !=, =~, !~)都可以使用。下面的表达式选择了度量指标名称以job:开头的时间序列数据:
指标名称不能使用关键字 bool, on, ignoring, group_left 和 group_right。
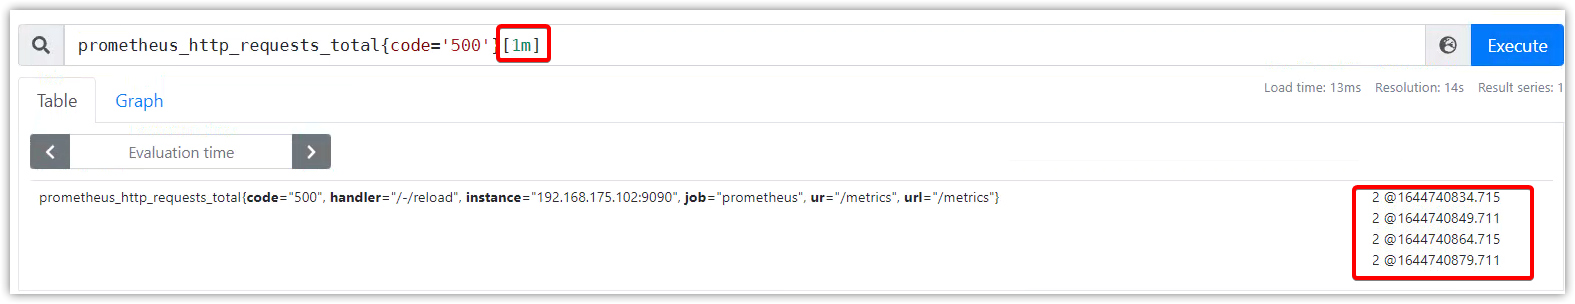
范围向量选择器
在[]中添加一个时间,就构成一个范围向量选择器。它会选择出最近这段时间内的样本值及其时间戳。
prometheus_http_requests_total{code='500'}[1m]
这将从起始时间(当前)查询到1m前。
ms- millisecondss- secondsm- minutesh- hoursd- days - assuming a day has always 24hw- weeks - assuming a week has always 7dy- years - assuming a year has always 365d
时间单位可以结合使用:
5h
1h30m
5m
10s
时间偏移:offset修饰符
offset修饰符,可以修改查询起始时间。不使用,则默认为当前时间。
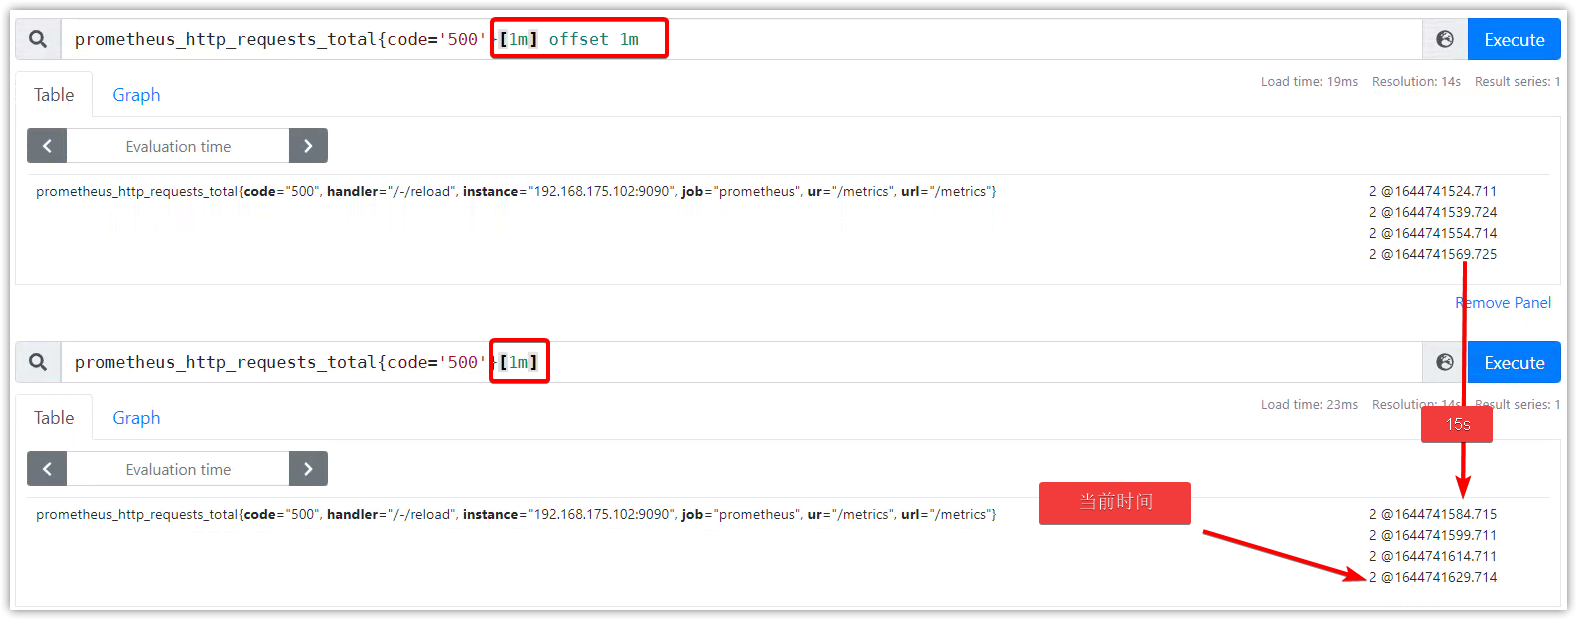
可以和时间范围一起使用,也可以在瞬时向量上直接使用。
使用示例:
http_requests_total offset 5m
sum(http_requests_total{method="GET"} offset 5m) // GOOD.
sum(http_requests_total{method="GET"}) offset 5m // INVALID.	# 必须直接跟在选择器后
rate(http_requests_total[5m] offset 1w)
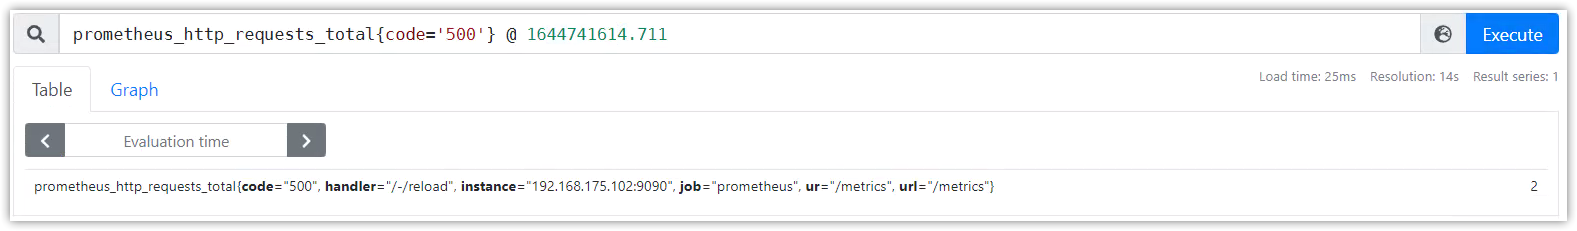
指定时间戳:@修饰符
@修饰符,可以指定查询时间。时间戳为unix。
http_requests_total @ 1609746000
sum(http_requests_total{method="GET"} @ 1609746000) // GOOD.
sum(http_requests_total{method="GET"}) @ 1609746000 // INVALID.	# 必须直接跟在选择器后
rate(http_requests_total[5m] @ 1609746000)
和offset修饰符结合使用,写在前或后查询结果一样:
# offset after @
http_requests_total @ 1609746000 offset 5m
# offset before @
http_requests_total offset 5m @ 1609746000
http_requests_total @ start()
rate(http_requests_total[5m] @ end())
注释#
PromQL使用#接注释
prometheus_http_requests_total{code='200'} # test
查询中的坑#
-
插值和陈旧
-
避免慢查询和高负载
操作符#
PromQL支持基本的逻辑运算和算术运算。
二元操作符#
算术操作符
+加法-减法*乘法/除法%模^幂等
二元算术运算符支持scalar/scalar(标量/标量)、vector/scalar(向量/标量)、和vector/vector(向量/向量)之间的操作。
在两个标量之间进行运算,结果也是标量。
在向量和标量直接进行运算,操作符将作用在每个向量值上,最后得到一个新的向量。
在两个向量之间进行运算,左边的每个向量值将与右边匹配的向量值进行运算,最后得到一个没有指标名称的新向量。
比较操作符
==等于!=不等于>大于<小于>=大于等于<=小于等于
比较二元操作符被应用于scalar/scalar(标量/标量)、vector/scalar(向量/标量),和vector/vector(向量/向量)。
比较操作符得到的结果是bool布尔类型值,返回1或者0。
-
两个标量之间的比较运算,bool结果写入到另一个结果标量中。
-
瞬时向量和标量之间的比较运算,操作符会应用到向量的每个值上。如果一个向量值与这个标量比较结果是
false,则这个向量元素被丢弃掉,如果是true, 则这个向量元素被保留在结果中。 -
两个瞬时向量之间的比较运算,左边每个向量值将与右边向量值进行匹配,没有匹配上的,或者计算结果为false的,都被丢弃,不在结果中显示。否则将保留左边的向量元素和向量值,并写入到新的瞬时向量中。
逻辑/集合操作符#
逻辑/集合二元操作符只能作用在瞬时向量
and交集or并集unless补集
vector1 and vector2 的逻辑/集合二元操作符,规则:vector1瞬时向量中的每个样本数据与vector2向量中的所有样本数据进行标签匹配,不匹配的,全部丢弃。运算结果是保留左边的度量指标名称和值。
vector1 or vector2的逻辑/集合二元操作符,规则: 保留vector1向量中的每一个元素,对于vector2向量元素,则不匹配vector1向量的任何元素,则追加到结果元素中。
vector1 unless vector2的逻辑/集合二元操作符,又称差积。规则:包含在vector1中的元素,但是该元素不在vector2向量所有元素列表中,则写入到结果集中。
向量匹配#
向量匹配,指的是右边向量中的每一个元素,在左边向量中也存在。匹配行为分为一对一和一对多。
一对一向量匹配
一对一,找到这个操作符的两边向量元素的相同元素。
默认情况下,操作符的格式是vector1 [operate] vector2。如果它们有相同的标签和值,则表示相匹配。
ingoring关键字是指,向量匹配时,可以忽略指定标签。
on关键字是指,在指定标签上进行匹配。
匹配格式如下:
<vector expr> <bin-op> ignoring(<label list>) <vector expr>
<vector expr> <bin-op> on(<label list>) <vector expr>
示例:
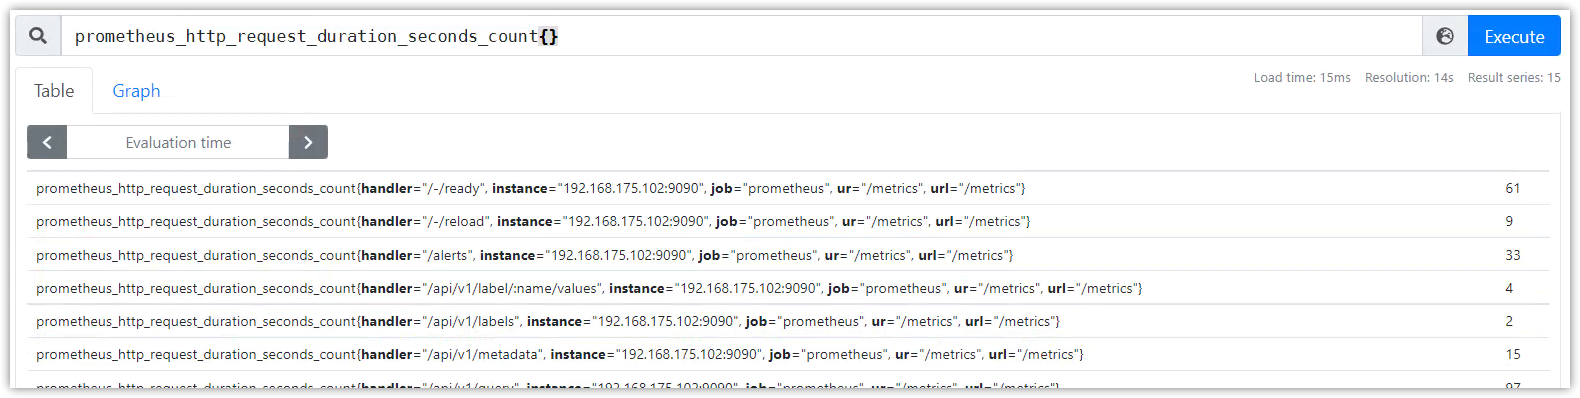
PromQL1:prometheus_http_requests_total{code='200'}

PromQL2:prometheus_http_request_duration_seconds_count{}
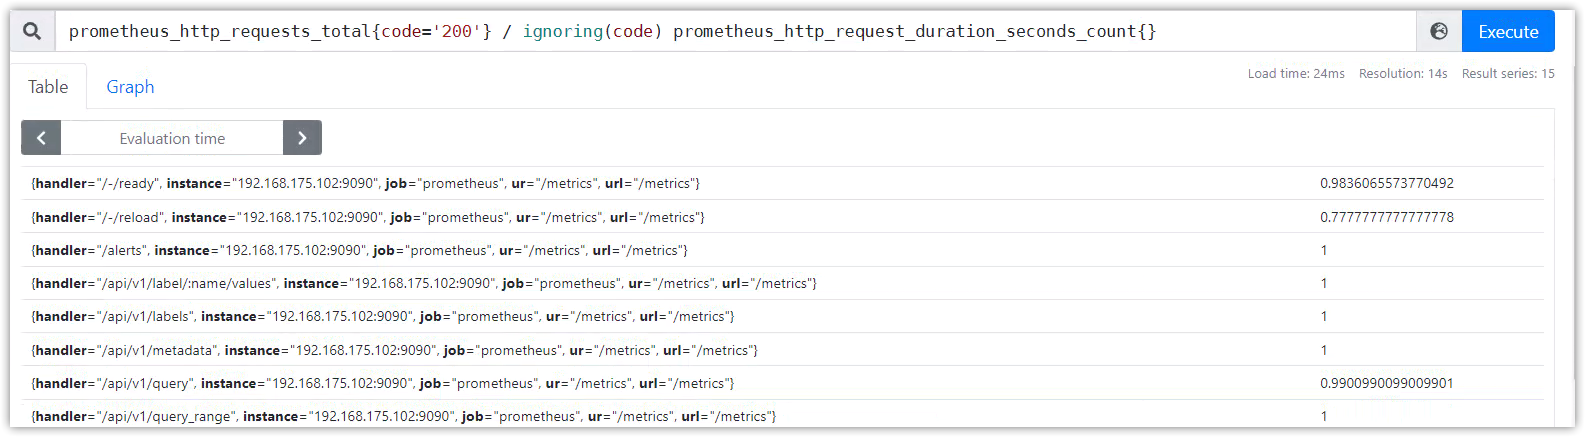
使用逻辑操作符计算:prometheus_http_requests_total{code='200'} >= ignoring(code) prometheus_http_request_duration_seconds_count{}

使用算术操作符计算:prometheus_http_requests_total{code='200'} >= ignoring(code) prometheus_http_request_duration_seconds_count{}
得到没有指标名称的新向量。
多对一和一对多匹配
多对一和一对多的匹配,是指向量元素中的一个样本数据匹配标签到了多个样本数据标签。
这里必须直接指定两个修饰符group_left或者group_right, 左或者右决定了哪边的向量具有较高的子集。
匹配格式如下:
<vector expr> <bin-op> ignoring(<label list>) group_left(<label list>) <vector expr>
<vector expr> <bin-op> ignoring(<label list>) group_right(<label list>) <vector expr>
<vector expr> <bin-op> on(<label list>) group_left(<label list>) <vector expr>
<vector expr> <bin-op> on(<label list>) group_right(<label list>) <vector expr>
聚合操作符,及without和by#
聚合操作符被用于聚合单个瞬时向量的所有时间序列列表,把聚合的结果值存入到新的向量中。可以通过without或者by子句来保留不同的标签。
sum(在维度上求和)max(在维度上求最大值)min(在维度上求最小值)avg(在维度上求平均值)stddev(求标准差)stdvar(求方差)count(统计向量元素的个数)count_values(统计相同数据值的元素数量)bottomk(样本值第k个最小值)topk(样本值第k个最大值)quantile(统计分位数)
格式:
\<aggr-op\>([parameter,] \<vector expr\>) [without | by (\<label list\>)] [keep_common]
parameter只能用于count_values, quantile, topk和bottomk。
示例:
如果度量指标名称http_requests_total包含由group, application, instance的标签组成的时间序列数据,我们可以通过以下方式计算去除instance标签的http请求总数:
sum(http_requests_total) without (instance)
如果我们对所有应用程序的http请求总数,我们可以简单地写下:
sum(http_requests_total)
统计每个编译版本的二进制文件数量,我们可以如下写:
count_values("version", build_version)
通过所有实例,获取http请求第5个最大值,我们可以简单地写下:
topk(5, http_requests_total)
二元运算符优先级#
从高到低:
^*,/,%+,-==,!=,<=,<,>=,>and,unlessor
优先级相同的运算符是左关联。 例如,2 * ( 3 % 2)等效于(2 * 3) % 2。 但^是右关联,所以2 ^ 3 ^ 2等效于2 ^ (3 ^ 2)。
函数#
https://fuckcloudnative.io/prometheus/3-prometheus/functions.html#increase
列举一些常用的函数及示例:
changes()
返回区间向量中,时序值改变的次数
increase(v range-vector)
获取区间向量中的第一个和最后一个样本并返回其增长量,只能用于计算counter类型数据。
increase(prometheus_http_requests_total{handler="/metrics"}[5m])
irate(v range-vector)
获取区间向量的瞬时增长率。通过区间向量中最后两个两本数据来计算区间向量的增长速率;
这种方式可以避免在时间窗口范围内的“长尾问题”,并且体现出更好的灵敏度,通过irate函数绘制的图标能够更好的反应样本数据的瞬时变化状态。
irate(prometheus_http_requests_total{handler="/metrics"}[5m])
注意
当将
irate()函数与聚合运算符(例如sum())或随时间聚合的函数(任何以_over_time结尾的函数)一起使用时,必须先执行 irate 函数,然后再进行聚合操作,否则当采样目标重新启动时 irate() 无法检测到计数器是否被重置。
rate(v range-vector)
直接计算区间向量 v 在时间窗口内平均增长速率,只能用于计算counter类型数据,在长期趋势分析或者告警中推荐使用这个函数。
rate(prometheus_http_requests_total{handler="/metrics"}[5m])
注意
当将
rate()函数与聚合运算符(例如sum())或随时间聚合的函数(任何以_over_time结尾的函数)一起使用时,必须先执行 rate 函数,然后再进行聚合操作,否则当采样目标重新启动时 rate() 无法检测到计数器是否被重置。
<aggregation>_over_time()
下面的函数列表允许传入一个区间向量,它们会聚合每个时间序列的范围,并返回一个瞬时向量。
avg_over_time(range-vector): 区间向量内每个度量指标的平均值min_over_time(range-vector): 区间向量内每个度量指标的最小值max_over_time(range-vector): 区间向量内每个度量指标的最大值sum_over_time(range-vector): 区间向量内每个度量指标的求和count_over_time(range-vector): 区间向量内每个度量指标的样本数据个数quantile_over_time(scalar, range-vector): 区间向量内每个度量指标的样本数据值分位数,φ-quantile (0 ≤ φ ≤ 1)stddev_over_time(range-vector): 区间向量内每个度量指标的总体标准差。stdvar_over_time(range-vector): 区间向量内每个度量指标的总体标准方差。last_over_time(range-vector): 区间向量内最近一个指标数据present_over_time(range-vector): 区间向量内第一个指标数据
label_join()
将瞬时向量中的原有标签使用连接符组合成为新标签。
label_join(v instant-vector, dst_label string, separator string, src_label_1 string, src_label_2 string, ...)
up{}
=>
up{group="canary", instance="192.168.175.102:8082", job="node_exporter"}
...
####
label_join(up{},'foo',';','job','instance')
=>
up{foo="node_exporter;192.168.175.102:8082", group="canary", instance="192.168.175.102:8082", job="node_exporter"}
...
# 组合成新标签,链接符为';'
label_replace()
根据regex正则,将原有标签的匹配部分写入到新标签中
label_replace(v instant-vector, dst_label string, replacement string, src_label string, regex string)
label_replace(up{}, "hosts", "$1", "instance", "(.*):.*")
=>
up{group="canary", hosts="192.168.175.102", instance="192.168.175.102:8082", job="node_exporter"}
sort(v instant-vector)
sort_desc(v instant-vector)
time()
timestamp(v instant-vector)
官网:https://prometheus.io/docs/prometheus/latest/querying/functions/
查询示例#
HTTP API#
数据格式:json
向量表达式查询#
即时查询 - 瞬时向量
Restful API:
GET /api/v1/query
POST /api/v1/query
URL参数:
query=<string>: PromQL字符串time=<rfc3339 | uninx_timestamp>: 执行时间戳,可选项。默认使用服务器时间timeout=<duration>: 执行超时时间设置,可选项。默认由-query.timeout标志设置
可以使用GET请求访问API数据接口,带特殊符号的话,则需要对URL进行编码,或者使用POST方式并且带上头部信息Content-Type: application/x-www-form-urlencoded,见下方示例。
查询结果的数据格式:
{
  "resultType": "matrix" | "vector" | "scalar" | "string",
  "result": <value>
}
发送Get请求:
# curl 'http://192.168.175.102:9090/api/v1/query?query=sum(up)&time=1644757519'
{
  "status": "success",
  "data": {
    "resultType": "vector",
    "result": [
      {
        "metric": {
          "__name__": "up",
          "group": "canary",
          "instance": "192.168.175.102:8082",
          "job": "node_exporter"
        },
        "value": [
          1644757519,
          "1"
        ]
      },
      ...
    ]
  }
}
一些特殊字符需要url编码的情况,GET请求会报错,需要使用POST请求,并带上头部信息Content-Type: application/x-www-form-urlencoded:
$ curl 'http://192.168.175.102:9090/api/v1/query?query=up{job="prometheus"}'                                          {"status":"error","errorType":"bad_data","error":"invalid parameter \"query\": 1:6: parse error: unexpected \"=\""}
$
$ curl -H 'Content-Type:application/x-www-form-urlencoded' -d 'query=up{job="prometheus"}' http://192.168.175.102:9090/api/v1/query
{
  "status": "success",
  "data": {
    "resultType": "vector",
    "result": [
      {
        "metric": {
          "__name__": "up",
          "instance": "192.168.175.102:9090",
          "job": "prometheus",
          "ur": "/metrics",
          "url": "/metrics"
        },
        "value": [
          1644757017.26,
          "1"
        ]
      }
    ]
  }
}
范围查询 - 范围向量#
Restful API:
GET /api/v1/query_range
POST /api/v1/query_range
URL参数:
query=<string>: PromQL字符串。start=<rfc3339 | unix_timestamp>: 开始时间戳,包含。end=<rfc3339 | unix_timestamp>: 结束时间戳,包含。step=<duration>: 查询时间步长,范围时间内每step秒执行一次。timeout=<duration>: 执行超时时间设置,可选项。默认由-query.timeout标志设置
查询方式:和即时查询一样多,可以使用GET请求,带特殊符号需要使用POST方式并且带上头部信息Content-Type: application/x-www-form-urlencoded。
查询结果的数据格式:
{
  "resultType": "matrix",
  "result": <value>
}
$ curl -H "Content-Type:application/x-www-form-urlencoded" \
-d 'query=up{job="prometheus"}' \
-d 'start=1644837500' \
-d 'end=1644837800' \
-d 'step=5m' \
http://192.168.175.102:9090/api/v1/query_range
{
  "status": "success",
  "data": {
    "resultType": "matrix",
    "result": [
      {
        "metric": {
          "__name__": "up",
          "instance": "192.168.175.102:9090",
          "job": "prometheus",
          "ur": "/metrics",
          "url": "/metrics"
        },
        "values": [
          [
            1644837500,
            "1"
          ],
          [
            1644837800,
            "1"
          ]
        ]
      }
    ]
  }
}
查询结果的数据格式
瞬时查询结果格式:
{
  "resultType": "matrix" | "vector" | "scalar" | "string",
  "result": <value>
}
<value>格式:
[
  {
    "metric": { "<label_name>": "<label_value>", ... },
    "value": [ <unix_time>, "<sample_value>" ]
  },
  ...
]
范围查询结果格式:
{
  "resultType": "matrix",
  "result": <value>
}
<value>格式:
[
  {
    "metric": { "<label_name>": "<label_value>", ... },
    "values": [ [ <unix_time>, "<sample_value>" ], ... ]
  },
  ...
]
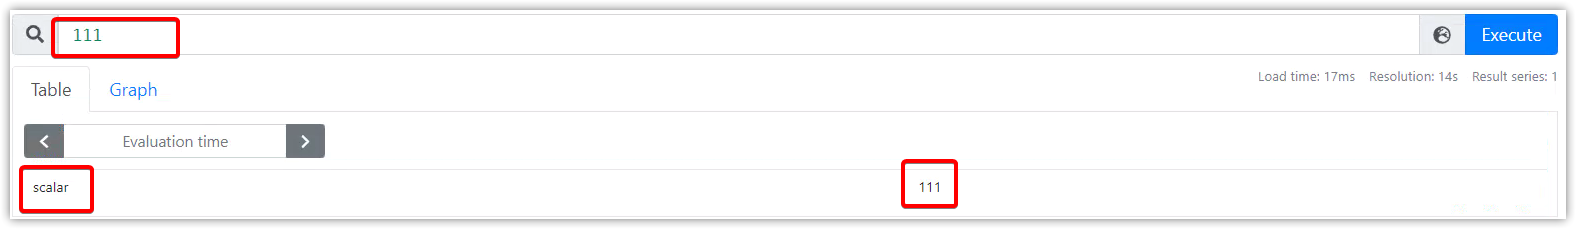
标量的<value>格式:
[ <unix_time>, "<scalar_value>" ]
{"status":"success","data":{"resultType":"scalar","result":[1644840866.871,"111"]}}
字符串的<value>格式:
[ <unix_time>, "<string_value>" ]
{"status":"success","data":{"resultType":"string","result":[1644840912.231,"aaa"]}}
元数据查询#
元数据即时序和其标签(如果历史数据没有清理了,则也包含历史时序和标签)
查询时序数据
Restful API:
GET /api/v1/series
POST /api/v1/series
URL参数:
match[]=<series_selector>: 选择器是时序选择器,可写多个(&连接),最少提供一个参数。start=<rfc3339 | unix_timestamp>: 开始时间戳。end=<rfc3339 | unix_timestamp>: 结束时间戳。
查询方式:可以使用GET请求,带特殊符号需要使用POST方式并且带上头部信息Content-Type: application/x-www-form-urlencoded。
查询结果的数据格式:
{
   "status" : "success",
   "data" : [
      {
         "__name__" : "up",
         "job" : "prometheus",
         "instance" : "localhost:9090"
      },
      ...
   ]
}
示例:
$ curl -g 'http://localhost:9090/api/v1/series?' --data-urlencode 'match[]=up' --data-urlencode 'match[]=process_start_time_seconds{job="prometheus"}'
{
   "status" : "success",
   "data" : [
      {
         "__name__" : "up",
         "job" : "prometheus",
         "instance" : "localhost:9090"
      },
      {
         "__name__" : "up",
         "job" : "node",
         "instance" : "localhost:9091"
      },
      {
         "__name__" : "process_start_time_seconds",
         "job" : "prometheus",
         "instance" : "localhost:9090"
      }
   ]
}
查询标签名
Restful API:
GET /api/v1/labels
POST /api/v1/labels
URL参数:
match[]=<series_selector>: 时序选择器,可写多个(&连接),可选项。start=<rfc3339 | unix_timestamp>: 开始时间戳。end=<rfc3339 | unix_timestamp>: 结束时间戳。
查询及数据格式:
$ curl 'localhost:9090/api/v1/labels'
{
    "status": "success",
    "data": [
        "__name__",
        "call",
        "code",
        "config",
        "dialer_name",
        "endpoint",
        "event",
        "goversion",
        "handler",
        "instance",
        "interval",
        "job",
        "le",
        "listener_name",
        "name",
        "quantile",
        "reason",
        "role",
        "scrape_job",
        "slice",
        "version"
    ]
}
查询标签值
Restful API:
GET /api/v1/label/<label_name>/values
URL参数:
match[]=<series_selector>: 时序选择器,可写多个(&连接),可选项。start=<rfc3339 | unix_timestamp>: 开始时间戳。end=<rfc3339 | unix_timestamp>: 结束时间戳。
查询示例:
$ curl http://localhost:9090/api/v1/label/job/values
{
   "status" : "success",
   "data" : [
      "node",
      "prometheus"
   ]
}
查询targets#
GET /api/v1/targets					# 返回activeTargets和dropedTargets
GET /api/v1/targets?state=active	# state=active, state=dropped, state=any
URL参数:
state:state=active, state=dropped, state=any
默认会返回活跃的和丢弃的targets。加上state参数可以对activeTargets和dropedTargets进行过滤(state=active, state=dropped, state=any)。
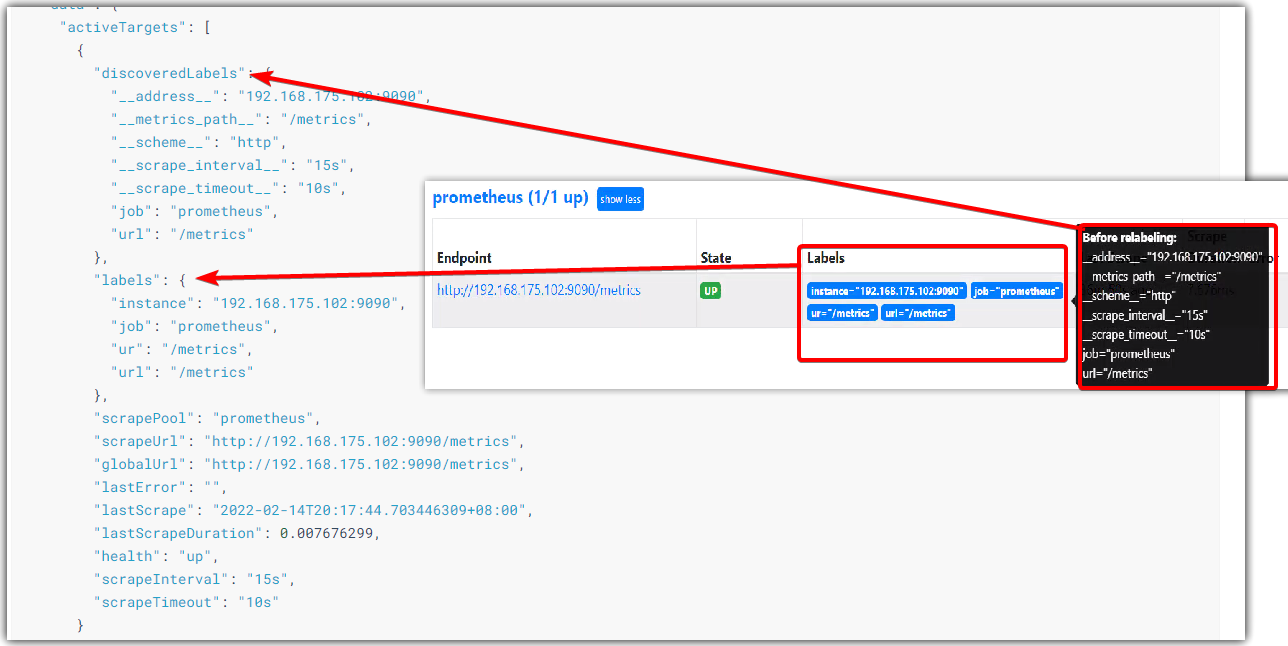
labels元素,代表标签重构之后的标签;
discoveredLabels元素,代表原始未修改的标签;
$ curl http://localhost:9090/api/v1/targets
{
  "status": "success",
  "data": {
    "activeTargets": [
      {
        "discoveredLabels": {
          "__address__": "192.168.175.102:9090",
          "__metrics_path__": "/metrics",
          "__scheme__": "http",
          "__scrape_interval__": "15s",
          "__scrape_timeout__": "10s",
          "job": "prometheus",
          "url": "/metrics"
        },
        "labels": {
          "instance": "192.168.175.102:9090",
          "job": "prometheus",
          "ur": "/metrics",
          "url": "/metrics"
        },
        "scrapePool": "prometheus",
        "scrapeUrl": "http://192.168.175.102:9090/metrics",
        "globalUrl": "http://192.168.175.102:9090/metrics",
        "lastError": "",
        "lastScrape": "2022-02-14T20:17:44.703446309+08:00",
        "lastScrapeDuration": 0.007676299,
        "health": "up",
        "scrapeInterval": "15s",
        "scrapeTimeout": "10s"
      }
    ],
    "droppedTargets": [
      {
        "discoveredLabels": {
          "__address__": "127.0.0.1:9100",
          "__metrics_path__": "/metrics",
          "__scheme__": "http",
          "__scrape_interval__": "1m",
          "__scrape_timeout__": "10s",
          "job": "node"
        }
      }
    ]
  }
}
Rules#
返回当前告警规则和预计算规则的列表。另外,还返回每个告警规则的当前活跃告警(在alert元素中)。
API:
GET /api/v1/rules
url参数:
type=alert|record,返回告警规则或预计算规则
$ curl http://localhost:9090/api/v1/rules

{
	"status": "success",
	"data": {
		"groups": [
			{
				"name": "target_sum",
				"file": "/root/prometheus/first_rules.yml",
				"rules": [
					{
						"name": "job:up:sum",
						"query": "sum by(job) (up)",
						"health": "ok",
						"evaluationTime": 0.000760367,
						"lastEvaluation": "2022-02-14T21:17:56.68729078+08:00",
						"type": "recording"
					},
					{
						"state": "firing",
						"name": "node_exporter_status",
						"query": "job:up:sum{job=\"node_exporter\"} != 3",
						"duration": 3,
						"labels": {
							"status": "nice"
						},
						"annotations": {
							"summary": "any node_exporter down.{{$labels.instance}}"
						},
						"alerts": [
							{
								"labels": {
									"alertname": "node_exporter_status",
									"job": "node_exporter",
									"status": "nice"
								},
								"annotations": {
									"summary": "any node_exporter down."
								},
								"state": "firing",
								"activeAt": "2022-02-14T13:17:41.683269601Z",
								"value": "2e+00"
							}
						],
						"health": "ok",
						"evaluationTime": 0.00073434,
						"lastEvaluation": "2022-02-14T21:17:56.688054823+08:00",
						"type": "alerting"
					}
				],
				"interval": 15,
				"limit": 0,
				"evaluationTime": 0.0015459,
				"lastEvaluation": "2022-02-14T21:17:56.687251569+08:00"
			}
		]
	}
}
Alerts#
返回当前活跃的告警列表
API:
GET /api/v1/alerts
示例:
$ curl http://localhost:9090/api/v1/alerts

{
	"status": "success",
	"data": {
		"alerts": [
			{
				"labels": {
					"alertname": "node_exporter_status",
					"job": "node_exporter",
					"status": "nice"
				},
				"annotations": {
					"summary": "any node_exporter down."
				},
				"state": "firing",
				"activeAt": "2022-02-14T13:17:41.683269601Z",
				"value": "2e+00"
			}
		]
	}
}
查询target元数据#
API:
GET /api/v1/targets/metadata
URL参数:
match_target=<label_selectors>:标签选择器,不加默认选择所有targetmetric=<string>:metrics指标名称,不加默认选择所有指标limit=<number>:数量限制
$ curl -G http://localhost:9091/api/v1/targets/metadata \
    --data-urlencode 'metric=go_goroutines' \
    --data-urlencode 'match_target={job="prometheus"}' \
    --data-urlencode 'limit=2'

$ curl -G http://localhost:9091/api/v1/targets/metadata \
    --data-urlencode 'match_target={instance="127.0.0.1:9090"}'
查询metric元数据#
API:
GET /api/v1/metadata
URL参数:
limit=<number>:返回结果的最大数量metric=<string>:指定指标名称
Alertmanagers#
API:
GET /api/v1/alertmanagers
示例:
$ curl http://localhost:9090/api/v1/alertmanagers
{
  "status": "success",
  "data": {
    "activeAlertmanagers": [
      {
        "url": "http://127.0.0.1:9090/api/v1/alerts"
      }
    ],
    "droppedAlertmanagers": [
      {
        "url": "http://127.0.0.1:9093/api/v1/alerts"
      }
    ]
  }
}
status#
Config
API:
GET /api/v1/status/config
示例:
$ curl http://localhost:9090/api/v1/status/config
{
  "status": "success",
  "data": {
    "yaml": "<content of the loaded config file in YAML>",
  }
}
Flags
API:
GET /api/v1/status/flags
示例:
$ curl http://localhost:9090/api/v1/status/flags
{
  "status": "success",
  "data": {
    "alertmanager.notification-queue-capacity": "10000",
    "alertmanager.timeout": "10s",
    "log.level": "info",
    "query.lookback-delta": "5m",
    "query.max-concurrency": "20",
    ...
  }
}
Runtime Information
返回运行信息:启动时间、启动路径、chunk数量、时序数量、数据保存天数
API:
GET /api/v1/status/runtimeinfo
示例:
$ curl http://localhost:9090/api/v1/status/runtimeinfo
{
	"status": "success",
	"data": {
		"startTime": "2022-02-14T08:00:38.922544422Z",				# 启动时间
		"CWD": "/root/prometheus",									# 启动路径
		"reloadConfigSuccess": true,
		"lastConfigTime": "2022-02-14T08:00:38Z",
		"corruptionCount": 0,
		"goroutineCount": 39,
		"GOMAXPROCS": 2,
		"GOGC": "",
		"GODEBUG": "",
		"storageRetention": "15d"									# 数据保存天数
	}
}
Build Information
GET /api/v1/status/buildinfo
$ curl http://localhost:9090/api/v1/status/buildinfo
{
  "status": "success",
  "data": {
    "version": "2.13.1",
    "revision": "cb7cbad5f9a2823a622aaa668833ca04f50a0ea7",
    "branch": "master",
    "buildUser": "julius@desktop",
    "buildDate": "20191102-16:19:59",
    "goVersion": "go1.13.1"
  }
}
TSDB Stats
返回TSDB的统计信息
GE#T /api/v1/status/tsdb
WAL Replay Stats
API:
GET /api/v1/status/walreplay
示例:
$ curl http://localhost:9090/api/v1/status/walreplay
{
  "status": "success",
  "data": {
    "min": 2,
    "max": 5,
    "current": 40,
    "state": "in progress"
  }
}
TSDB Admin APIs#
管理数据库的接口,必须先启动--web.enable-admin-api命令行参数。
Snapshot - 快照
给当前所有数据创建一个快照,存储在数据库存储目录(默认data)的snapshots/<datetime>-<rand>目录下。
POST /api/v1/admin/tsdb/snapshot
PUT /api/v1/admin/tsdb/snapshot
URL参数:
skip_head=<bool>:是否跳过head 块中的数据,默认false,即不跳过
$ curl -XPOST http://localhost:9090/api/v1/admin/tsdb/snapshot
{
  "status": "success",
  "data": {
    "name": "20171210T211224Z-2be650b6d019eb54"
  }
}

# 不跳过内存中的数据,即同时备份内存中的数据
curl -XPOST http://127.0.0.1:9090/api/v1/admin/tsdb/snapshot?skip_head=false
# 跳过内存中的数据
curl -XPOST http://127.0.0.1:9090/api/v1/admin/tsdb/snapshot?skip_head=true
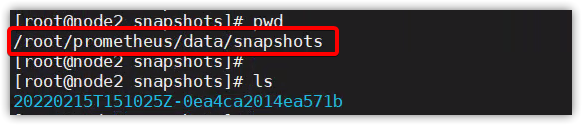
快照将存在/snapshots/20171210T211224Z-2be650b6d019eb54目录
该API将从数据库中删除选择的时序,实际数据仍然存在磁盘上,并在未来的压缩中进行清理,或者通过Tombstone进行清理。
如果成功,将返回204状态码。
API:
POST /api/v1/admin/tsdb/delete_series
PUT /api/v1/admin/tsdb/delete_series
URL参数:
match[]=<series_selector>: 时序选择器,可写多个(&连接),可选项。start=<rfc3339 | unix_timestamp>: 开始时间戳。end=<rfc3339 | unix_timestamp>: 结束时间戳。
示例:
curl -X POST \
  -g 'http://localhost:9090/api/v1/admin/tsdb/delete_series?match[]=up&match[]=process_start_time_seconds{job="prometheus"}'
Tombstone清理
CleanTombstones将从磁盘中移除已删除数据,同时清理存在的tombstones。可以在删除时序后用来释放空间。
如果成功,将返回204状态码。
POST /api/v1/admin/tsdb/clean_tombstones
PUT /api/v1/admin/tsdb/clean_tombstones
$ curl -XPOST http://localhost:9090/api/v1/admin/tsdb/clean_tombstones
管理API#
GET /-/healthy
GET /-/ready
PUT  /-/reload
POST /-/reload
必须开启--web.enable-lifecycle命令行选项;
- 也可以通过发送
SIGHUP信号来触发配置重载
$  ps -ef | grep  prometheu[s] | gawk '{print $2}'
13715
$ kill -SIGHUP 13715
# 或者
$ kill -1 13715
Prometheus优雅停止#
PUT  /-/quit
POST /-/quit
必须开启--web.enable-lifecycle命令行选项;
- 也可以通过发送
SIGTERM信号来触发优雅停止
$  ps -ef | grep  prometheu[s] | gawk '{print $2}'
13715
$ kill -SIGTERM 13715
# 或者
$ kill -15 13715
# kill -9是强制停止
存储#
Prometheus支持本地存储和远程存储。
本地存储(TSDB)#
存储配置:
--storage.tsdb.path:数据存储目录。默认为 data/。--storage.tsdb.retention.time:数据过期清理时间,默认为 15 天。--storage.tsdb.wal-compression:此标志启用预写日志(WAL)的压缩。根据您的数据,您可以预期 WAL 大小将减少一半,而额外的 CPU 负载却很少。此标志在 2.11.0 中引入,默认情况下在 2.20.0 中启用。请注意,一旦启用,将 Prometheus 降级到 2.11.0 以下的版本将需要删除 WAL。
目录结构:
prometheus按照block块的方式来存储数据,每2小时为一个时间单位。
data
├── 01FVSSJACPYRB38QPF8JR7056S				# 数据块目录,2小时
│   ├── chunks
│   │   └── 000001						   # 保存 timeseries 数据
│   ├── index							    #  索引文件,通过metric名和labels查找时序数据在chunk文件中的位置
│   ├── meta.json							# 配置文件,包含起止时间、包含哪些block
│   └── tombstones							# 删除操作会首先记录到这个文件
├── 01FVYQFWYBVT315GWTPXMEVAG5
│   ├── chunks
│   │   └── 000001
│   ├── index
│   ├── meta.json
│   └── tombstones
├── chunks_head
│   ├── 000016
│   └── 000017
├── lock
├── queries.active
└── wal
    ├── 00000015
    ├── 00000016
    ├── 00000017
    ├── 00000018
    └── checkpoint.00000014
        └── 00000000
数据存储方式:
prometheus将采集到的样本以时间序列的方式保存在内存(TSDB 时序数据库)中,并定时保存到硬盘中。
默认存储15天,超过15天以上的数据将会被删除。若要永久存储数据,有两种方式,方式一:修改prometheus的配置参数“storage.tsdb.retention.time=10000d”;方式二:将数据引入存储到Influcdb中。为保证数据安全性,这里主要介绍的是promethues本地存储备份数据的方法。
Prometheus按 2 小时一个 block 进行数据存储,最新写入的数据保存在内存 block 中,2 小时后自动写入磁盘。
为防止程序异常导致数据丢失,采用了WAL(write-ahead-log)机制,即2小时内记录的数据存储在内存中的同时,还会记录一份日志,存储在block下的wal目录中。当程序再次启动时,会将wal目录中的数据写入对应的block中,从而达到恢复数据的效果。
删除数据时,删除条目会记录在tombstones 中,而不是立刻删除。
数据备份#
完全备份:
备份数据存储目录data,即可完全备份,不过这样效率很低。
快照备份:
可以通过API的方式实现数据备份。
启动Prometheus时需要加上--web.``enable``-admin-api 命令行选项
数据还原#
利用api方式制作成snapshot后,还原时将snapshot中的文件覆盖到data目录下,重启prometheus即可!
添加定时备份任务
$ crontable -l                              #注意时区,修改完时区后,需要重启 crontab    systemctl  restart cron

0 3 * * 7 sudo /usr/bin/curl -XPOST -I http://127.0.0.1:9090/api/v1/admin/tsdb/snapshot >> /home/bill/prometheusbackup.log
Recommend
About Joyk
Aggregate valuable and interesting links.
Joyk means Joy of geeK