

Linux常用系统性能监控命令
source link: https://os.51cto.com/article/714774.html
Go to the source link to view the article. You can view the picture content, updated content and better typesetting reading experience. If the link is broken, please click the button below to view the snapshot at that time.

监控CPU使用率
使用下面的命令:
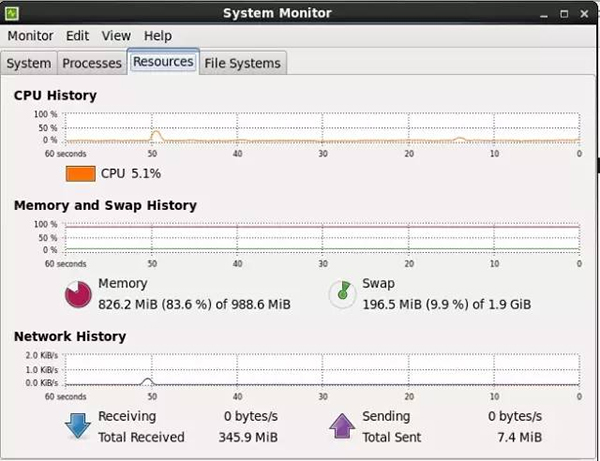
[root@localhost ~]# gnome-system-monitor将会出现图形化工具GNOME System Monitor,如下图所示:
监控CPU调度程序运行队列
linux可以使用vmstat命令
vmstat是Virtual Meomory Statistics(虚拟内存统计)的缩写, 是实时系统监控工具。该命令通过使用knlist子程序和/dev/kmen伪设备驱动器访问这些数据,输出信息直接打印在屏幕。vmstat反馈的与CPU相关的信息包括:
(1)多少任务在运行
(2)CPU使用的情况
(3)CPU收到多少中断
(4)发生多少上下文切换
下面只介绍 Vmstat与CPU相关的参数
vmstat的语法如下:
vmstat [delay [count]]参数的含义如下:
delay | 相邻的两次采样的间隔时间 |
count | 采样的次数,count只能和delay一起使用 |
当没有参数时,vmstat则显示系统启动以后所有信息的平均值。有delay时,第一行的信息自系统启动以来的平均信息。从第二行开始,输出为前一个delay时间段的平均信息。当系统有多个CPU时,输出为所有CPU的平均值。
从/proc/stat获得数据 | ||
在internal时间段里,运行队列里等待CPU的任务(任务)的个数,即不包含vmstat进程 | procs_running-1 | |
在internal时间段里,被资源阻塞的任务数(I/0,页面调度,等等.)通常情况下是接近0的 | procs_blocked | |
在internal时间段里,用户态的CPU时间(%),包含 nice值为负进程 | (user+nice)/total*100 | |
在internal时间段里,核心态的CPU时间(%) | (system+irq+softirq)/total*100 | |
在internal时间段里,cpu空闲的时间,不包括等待i/o的时间(%) | idle/total*100 | |
在internal时间段里,等待i/o的时间(%) | iowait/total*100 | |
在internal时间段里,每秒发生中断的次数 | intr/interval | |
在internal时间段里,每秒上下文切换的次数,即每秒内核任务交换的次数 | ctxt/interval |
total_cur = user + system + nice + idle + iowait + irq + softirq
   total_pre = pre_user + pre_system + pre_nice + pre_idle + pre_iowait + pre_irq + pre_softirq
   total = total_cur - total_pre
   [root@localhost ~]# vmstat
运行结果如下:

监控锁竞争
使用 sysstat包中的pidstat命令来监控
[root@localhost ~]# pidstat运行结果如下:
Linux 2.6.32-431.el6.x86_64 (localhost.localdomain) 05/07/15 _x86_64_ (1 CPU)
   09:58:18 PID %usr %system %guest %CPU CPU Command
   09:58:18 1 0.00 0.00 0.00 0.00 0 init
   09:58:18 4 0.00 0.00 0.00 0.00 0 ksoftirqd/0
   ……
   09:58:18 37143 0.00 0.00 0.00 0.00 0 dbus-launch
   09:58:18 37144 0.00 0.00 0.00 0.00 0 dbus-daemon
   09:58:18 37268 0.00 0.00 0.00 0.00 0 fprintd
   09:58:18 37272 0.00 0.00 0.00 0.00 0 pidstat
监控网络I/O使用率
nicstat原本是Solaris平台下显示网卡流量的工具,Tim Cook将它移植到linux平台
首先安装之,源码在这里下, 这里使用的版本是1.92。
安装make环境:
yum install gcc gcc-c++ make automake autoconf -y由于nicstat依赖32 bit glibc package,所以
yum install libgcc.i686 glibc.i686 glibc-devel.i686 -y下载文件并安装:
# wget -c http://nchc.dl.sourceforge.net/project/nicstat/nicstat-1.92.tar.gz
   # tar zxvf nicstat-1.92.tar.gz
   # cd nicstat-1.92
   # cp Makefile.Linux Makefile
   # uname -m
[root@localhost nicstat-1.92]# make
gcc -O3 -m32 nicstat.c -o nicstat
nicstat.c:99:1: warning: "DUPLEX_UNKNOWN" redefined
In file included from nicstat.c:84:
/usr/include/linux/ethtool.h:691:1: warning: this is the location of the previous definition
mv nicstat `./nicstat.sh --bin-name`[root@localhost nicstat-1.92]# ./nicstat.sh
磁盘I/O使用率
iostat [-t] [-c] [interval [count]]
参数的含义如下:
表示输出采用的时间 | |
表示只显示CPU的信息 | |
Internal | 相邻的两次采样的间隔时间 |
count | 采样的次数,count只能和delay一起使用 |
当没有参数时,iostat则显示系统启动以后所有信息的平均值。与CPU有关的输出的含义
从/proc/stat获得 | ||
处理器ID | ||
在internal时间段里,用户态的CPU时间(%) ,不包含 nice值为负进程 | usr/total*100 | |
在internal时间段里,nice值为负进程的CPU时间(%) | nice/total*100 | |
在internal时间段里,核心时间(%) | (system+irq+softirq)/total*100 | |
iowait | 在internal时间段里,硬盘IO等待时间(%) | iowait/total*100 |
在internal时间段里,CPU除去等待磁盘IO操作外的因为任何原因而空闲的时间闲置时间 (%) | idle/total*100 |
total_cur = user + system + nice + idle + iowait + irq + softirq
   total_pre = pre_user + pre_system + pre_nice + pre_idle + pre_iowait + pre_irq + pre_softirq
   total = total_cur - total_pre
有interval时,第一行的信息自系统启动以来的平均信息。从第二行开始,输出为前一个interval时间段的平均信息。
使用iostat命令
[root@localhost ~]# iostat运行结果如下:
Linux 2.6.32-431.el6.x86_64 (localhost.localdomain) 05/07/15 _x86_64_ (1 CPU)
avg-cpu: %user %nice %system %iowait %steal %idle
6.12 0.00 1.35 2.35 0.00 90.19
Device: tps Blk_read/s Blk_wrtn/s Blk_read Blk_wrtn
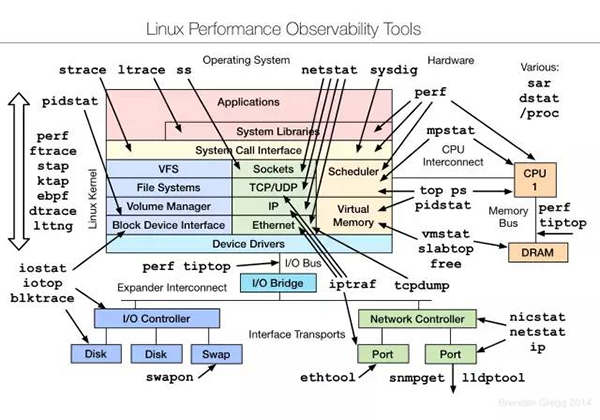
sda 6.03 267.11 272.53 26904430 27450404PS:附上Brendan Gregg 个人站点上分享了很多 Linux 性能相关的资源:
Linux observability tools | Linux 性能观测工具
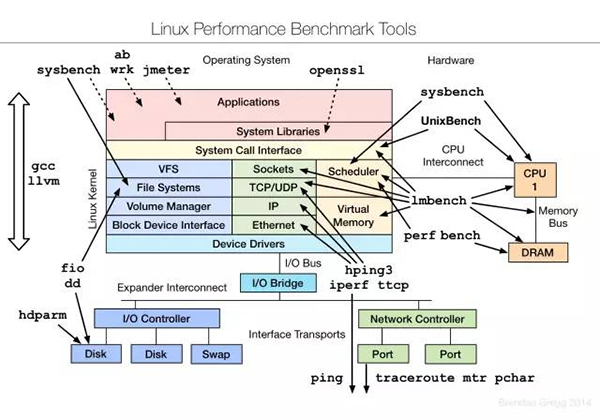
Linux benchmarking tools | Linux 性能测评工具
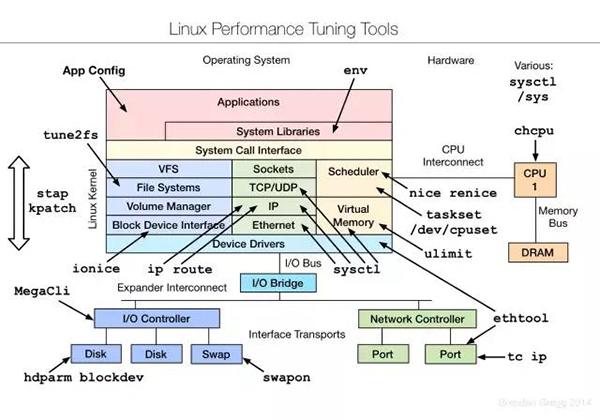
Linux tuning tools | Linux 性能调优工具
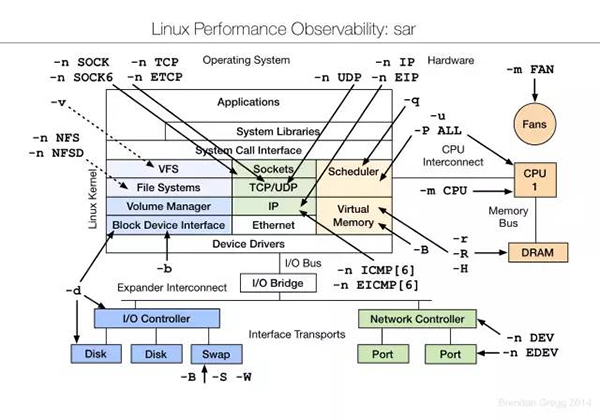
Linux observability sar
Recommend
About Joyk
Aggregate valuable and interesting links.
Joyk means Joy of geeK