

实现一个Prometheus exporter - iqsing
source link: https://www.cnblogs.com/qsing/p/16435570.html
Go to the source link to view the article. You can view the picture content, updated content and better typesetting reading experience. If the link is broken, please click the button below to view the snapshot at that time.
Prometheus 官方和社区提供了非常多的exporter,涵盖数据库、中间件、OS、存储、硬件设备等,具体可查看exporters、exporterhub.io,通过这些 exporter 基本可以覆盖80%的监控需求,依然有小部分需要通过自定义脚本或者定制、修改社区exporter实现。本文我们将学习如何通过go编写一个简单的expoter用于暴露OS的负载。
要实现的三个load指标如下:
exporter的核心是http服务,对外暴露exporter本身运行时指标和监控信息。我们可以直接通过net/http暴力实现,更好的方式是使用Prometheus 官方提供的client library 来简化一部分工作。
client library官方支持语言:
也有社区支持的其他语言库如C、C++、PHP等
获取数据源
在使用client library暴露数据之前,我们得先找到数据源,以linux为例要获取系统负载我们可以读取/proc目录下的loadavg文件。涉及到各类操作系统指标的获取可以参考官方的node-exporter,这里我们给他写成load包,等会直接调用GetLoad()就能拿到数据了。
package collect

import (
        "fmt"
        "io/ioutil"
        "strconv"
        "strings"
)

// The path of the proc filesystem.
var procPath = "/proc/loadavg"

// Read loadavg from /proc.
func GetLoad() (loads []float64, err error) {
        data, err := ioutil.ReadFile(procPath)
        if err != nil {
                return nil, err
        }
        loads, err = parseLoad(string(data))
        if err != nil {
                return nil, err
        }
        return loads, nil
}

// Parse /proc loadavg and return 1m, 5m and 15m.
func parseLoad(data string) (loads []float64, err error) {
        loads = make([]float64, 3)
        parts := strings.Fields(data)
        if len(parts) < 3 {
                return nil, fmt.Errorf("unexpected content in %s", procPath)
        }
        for i, load := range parts[0:3] {
                loads[i], err = strconv.ParseFloat(load, 64)
                if err != nil {
                        return nil, fmt.Errorf("could not parse load '%s': %w", load, err)
                }
        }
        return loads, nil
}
通过client_golang暴露指标
开通我们提到exporter要暴露的指标包含两部分,一是本身的运行时信息,另一个监控的metrics。而运行时信息client_golang已经帮我们实现了,我们要做的是通过client_golang包将监控数据转换为metrics后再暴露出来。
一个最基础使用client_golang包示例如下:
package main

import (
        "net/http"

        "github.com/prometheus/client_golang/prometheus/promhttp"
)

func main() {
        http.Handle("/metrics", promhttp.Handler())
        http.ListenAndServe(":2112", nil)
}
promhttp.Handler()封装了本身的 go 运行时 metrics,并按照metircs后接value的格式在前端输出。
当我们访问2112端口的metrics路径时得到如下数据:
# HELP go_gc_duration_seconds A summary of the pause duration of garbage collection cycles.
# TYPE go_gc_duration_seconds summary
go_gc_duration_seconds{quantile="0"} 0
go_gc_duration_seconds{quantile="0.25"} 0
go_gc_duration_seconds{quantile="0.5"} 0
go_gc_duration_seconds{quantile="0.75"} 0
go_gc_duration_seconds{quantile="1"} 0
go_gc_duration_seconds_sum 0
go_gc_duration_seconds_count 0
# HELP go_goroutines Number of goroutines that currently exist.
# TYPE go_goroutines gauge
go_goroutines 7
# HELP go_info Information about the Go environment.
# TYPE go_info gauge
go_info{version="go1.15.14"} 1
# HELP go_memstats_alloc_bytes Number of bytes allocated and still in use.
# TYPE go_memstats_alloc_bytes gauge
...
如何暴露自定义metrics呢?
先看如下的示例:
package main

import (
	"net/http"
	"time"
	"log"

	"github.com/prometheus/client_golang/prometheus"
	"github.com/prometheus/client_golang/prometheus/promhttp"
)

func recordMetrics() {
	go func() {
		for {
			opsProcessed.Inc()
			time.Sleep(2 * time.Second)
		}
	}()
}

var (
	opsProcessed = prometheus.NewCounter(prometheus.CounterOpts{
		Namespace: "myapp",
		Name:      "processed_ops_total",
		Help:      "The total number of processed events",
	})
)

func main() {
	prometheus.MustRegister(opsProcessed)
	recordMetrics()

	http.Handle("/metrics", promhttp.Handler())
	log.Print("export /metrics on port :8085")
	http.ListenAndServe(":8085", nil)
}
示例来自于官方仓库,做了稍加修改。可以看到使用NewCounter方法可以很快地帮我们创建一个Prometheus Counter数据类型实例。
Counter接口的定义包含了Counter本身的特性-只能增加即Inc和Add,同时还包含Meterics、Collector接口
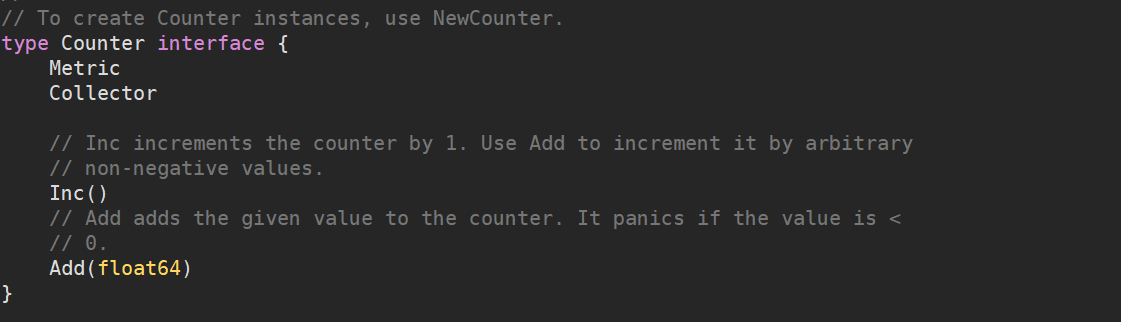
Collector还包含2个方法,待会我们写自己的Collector时需要实现这两个方法。
type Collector interface {
	Describe(chan<- *Desc)
	Collect(chan<- Metric)
}
CounterOpts 来源于metrics.go 的Ops结构体定义了构成metrics的基本结构。

接着将opsProcessed这个Counter进行注册,所谓注册也就是让Handler跟踪这个Counter中的metircs和collector
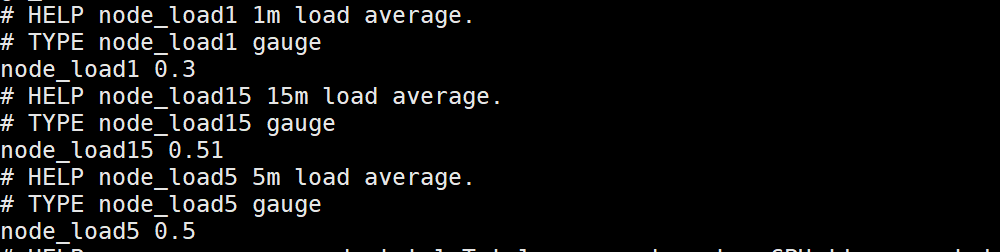
运行后,访问/metircs可以看到自定义指标myapp_processed_ops_total通过定时的Inc()调用来更新value
# HELP myapp_processed_ops_total The total number of processed events
# TYPE myapp_processed_ops_total counter
myapp_processed_ops_total 15
下面我们通过自定义collector实现一个简易的exporter
目录结构如下:
# tree .
.
├── collect
│   ├── collector.go
│   └── loadavg.go
├── go.mod
├── go.sum
└── main.go
loadavg.go即上面的获取数据源。
collector.go如下:
package collect

import (
	"log"

	"github.com/prometheus/client_golang/prometheus"
)

var namespace = "node"


type loadavgCollector struct {
	metrics []typedDesc
}

type typedDesc struct {
	desc      *prometheus.Desc
	valueType prometheus.ValueType
}


func NewloadavgCollector() *loadavgCollector {
	return &loadavgCollector{
		metrics: []typedDesc{
			{prometheus.NewDesc(namespace+"_load1", "1m load average.", nil, nil), prometheus.GaugeValue},
			{prometheus.NewDesc(namespace+"_load5", "5m load average.", , nil), prometheus.GaugeValue},
			{prometheus.NewDesc(namespace+"_load15", "15m load average.", nil, nil), prometheus.GaugeValue},
		},
	}
}

//Each and every collector must implement the Describe function.
//It essentially writes all descriptors to the prometheus desc channel.
func (collector *loadavgCollector) Describe(ch chan<- *prometheus.Desc) {

	//Update this section with the each metric you create for a given collector
	ch <- collector.metrics[1].desc
}

//Collect implements required collect function for all promehteus collectors
func (collector *loadavgCollector) Collect(ch chan<- prometheus.Metric) {

	//Implement logic here to determine proper metric value to return to prometheus
	//for each descriptor or call other functions that do so.
	loads, err := GetLoad()
	if err != nil {
		log.Print("get loadavg error: ", err)
	}

	//Write latest value for each metric in the prometheus metric channel.
	//Note that you can pass CounterValue, GaugeValue, or UntypedValue types here.

	for i, load := range loads {
		ch <- prometheus.MustNewConstMetric(collector.metrics[i].desc, prometheus.GaugeValue, load)
	}

}
collector中每一个要暴露的metrics都需要包含一个metrics描述即desc,都需要符合prometheus.Desc结构,我们可以直接使用NewDesc来创建。这里我们创建了三个metircs_name分别为node_load1、node_load5、node_15以及相应的描述,也可以加上对应的label。
接着实现collector的两个方法Describe、Collect分别写入对应的发送channel,其中prometheus.Metric的通道传入的值还包括三个load的value
最后在主函数中注册collector
prometheus.MustRegister(collect.NewloadavgCollector())
在Prometheus每个请求周期到达时都会使用GetLoad()获取数据,转换为metircs,发送给Metrics通道,http Handler处理和返回。
实现一个指标丰富、可靠性高的exporter感觉还是有一些困难的,需要对Go的一些特性以及Prometheus client包有较深入的了解。本文是对exporter编写的简单尝试,如实现逻辑、方式或理解不准确可参考开源exporter和官方文档。
文章涉及代码可查看:exporter
通过博客阅读:iqsing.github.io
Recommend
About Joyk
Aggregate valuable and interesting links.
Joyk means Joy of geeK