

PHP Opentelemetry Instrumentation
source link: https://signoz.io/docs/instrumentation/php
Go to the source link to view the article. You can view the picture content, updated content and better typesetting reading experience. If the link is broken, please click the button below to view the snapshot at that time.
PHP Opentelemetry Instrumentation

Introduction to SigNoz for PHP
SigNoz can help you monitor your PHP applications for application-related metrics like latency, request per second, error rates, etc. It can also monitor infrastructure metrics like CPU utilization and memory usage.
You can set alerts on metrics of your choice to stay on top of any issues arising in your deployed application.
Getting started for PHP with SigNoz
SigNoz uses OpenTelemetry for enabling your application code to generate telemetry data. OpenTelemetry provides a vendor-neutral specification to instrument your application so that you can export data to any backend of your choice, such as SigNoz.
Let us see how to instrument your application with OpenTelemetry, so that you can visualize the data with SigNoz.
Instrumenting a sample PHP application with OpenTelemetry
Install the following dependencies using composer
- open-telemetry/opentelemetry
- guzzlehttp/guzzle
- guzzlehttp/psr7
Import the required modules
use GuzzleHttp\Client;
use GuzzleHttp\Psr7\HttpFactory;
use OpenTelemetry\Contrib\OtlpHttp\Exporter as OTLPExporter;
use OpenTelemetry\SDK\Common\Attribute\Attributes;
use OpenTelemetry\SDK\Trace\SpanProcessor\SimpleSpanProcessor;
use OpenTelemetry\SDK\Trace\TracerProvider;
Define envs
Optionally, you can skip them in code and pass them via command line process args.
The IP of SigNozwill be localhost if you are running SigNoz on local. If you are not running SigNoz on the local machine, then please use the IP of the machine where SigNoz is installed.
putenv('OTEL_EXPORTER_OTLP_ENDPOINT=<IP of SigNoz>');
putenv('OTEL_SERVICE_NAME=<NAME OF YOUR SERVICE>');
Initialise Exporter and Tracer module
$exporter = new OTLPExporter(
    new Client(),
    new HttpFactory(),
    new HttpFactory()
);

$tracerProvider =  new TracerProvider(
    new SimpleSpanProcessor(
        $exporter
    )
);
$tracer = $tracerProvider->getTracer();
Create and activate root span
$root = $span = $tracer->spanBuilder('root')->startSpan();
$span->activate();
Start your first span, add attributes and events.
$span = $tracer->spanBuilder('loop-' . $i)->startSpan();

$span->setAttribute('remote_ip', '1.2.3.4')
        ->setAttribute('country', 'USA');

$span->addEvent('found_login' . $i, new Attributes([
        'id' => $i,
        'username' => 'otuser' . $i,
    ]));
    $span->addEvent('generated_session', new Attributes([
        'id' => md5((string) microtime(true)),
    ]));
End the spans in hierarchal order
$span->end();
$root->end();
Run and Visualize on SigNoz
OTEL_SERVICE_NAME=signoz-php-app php FILENAME.php
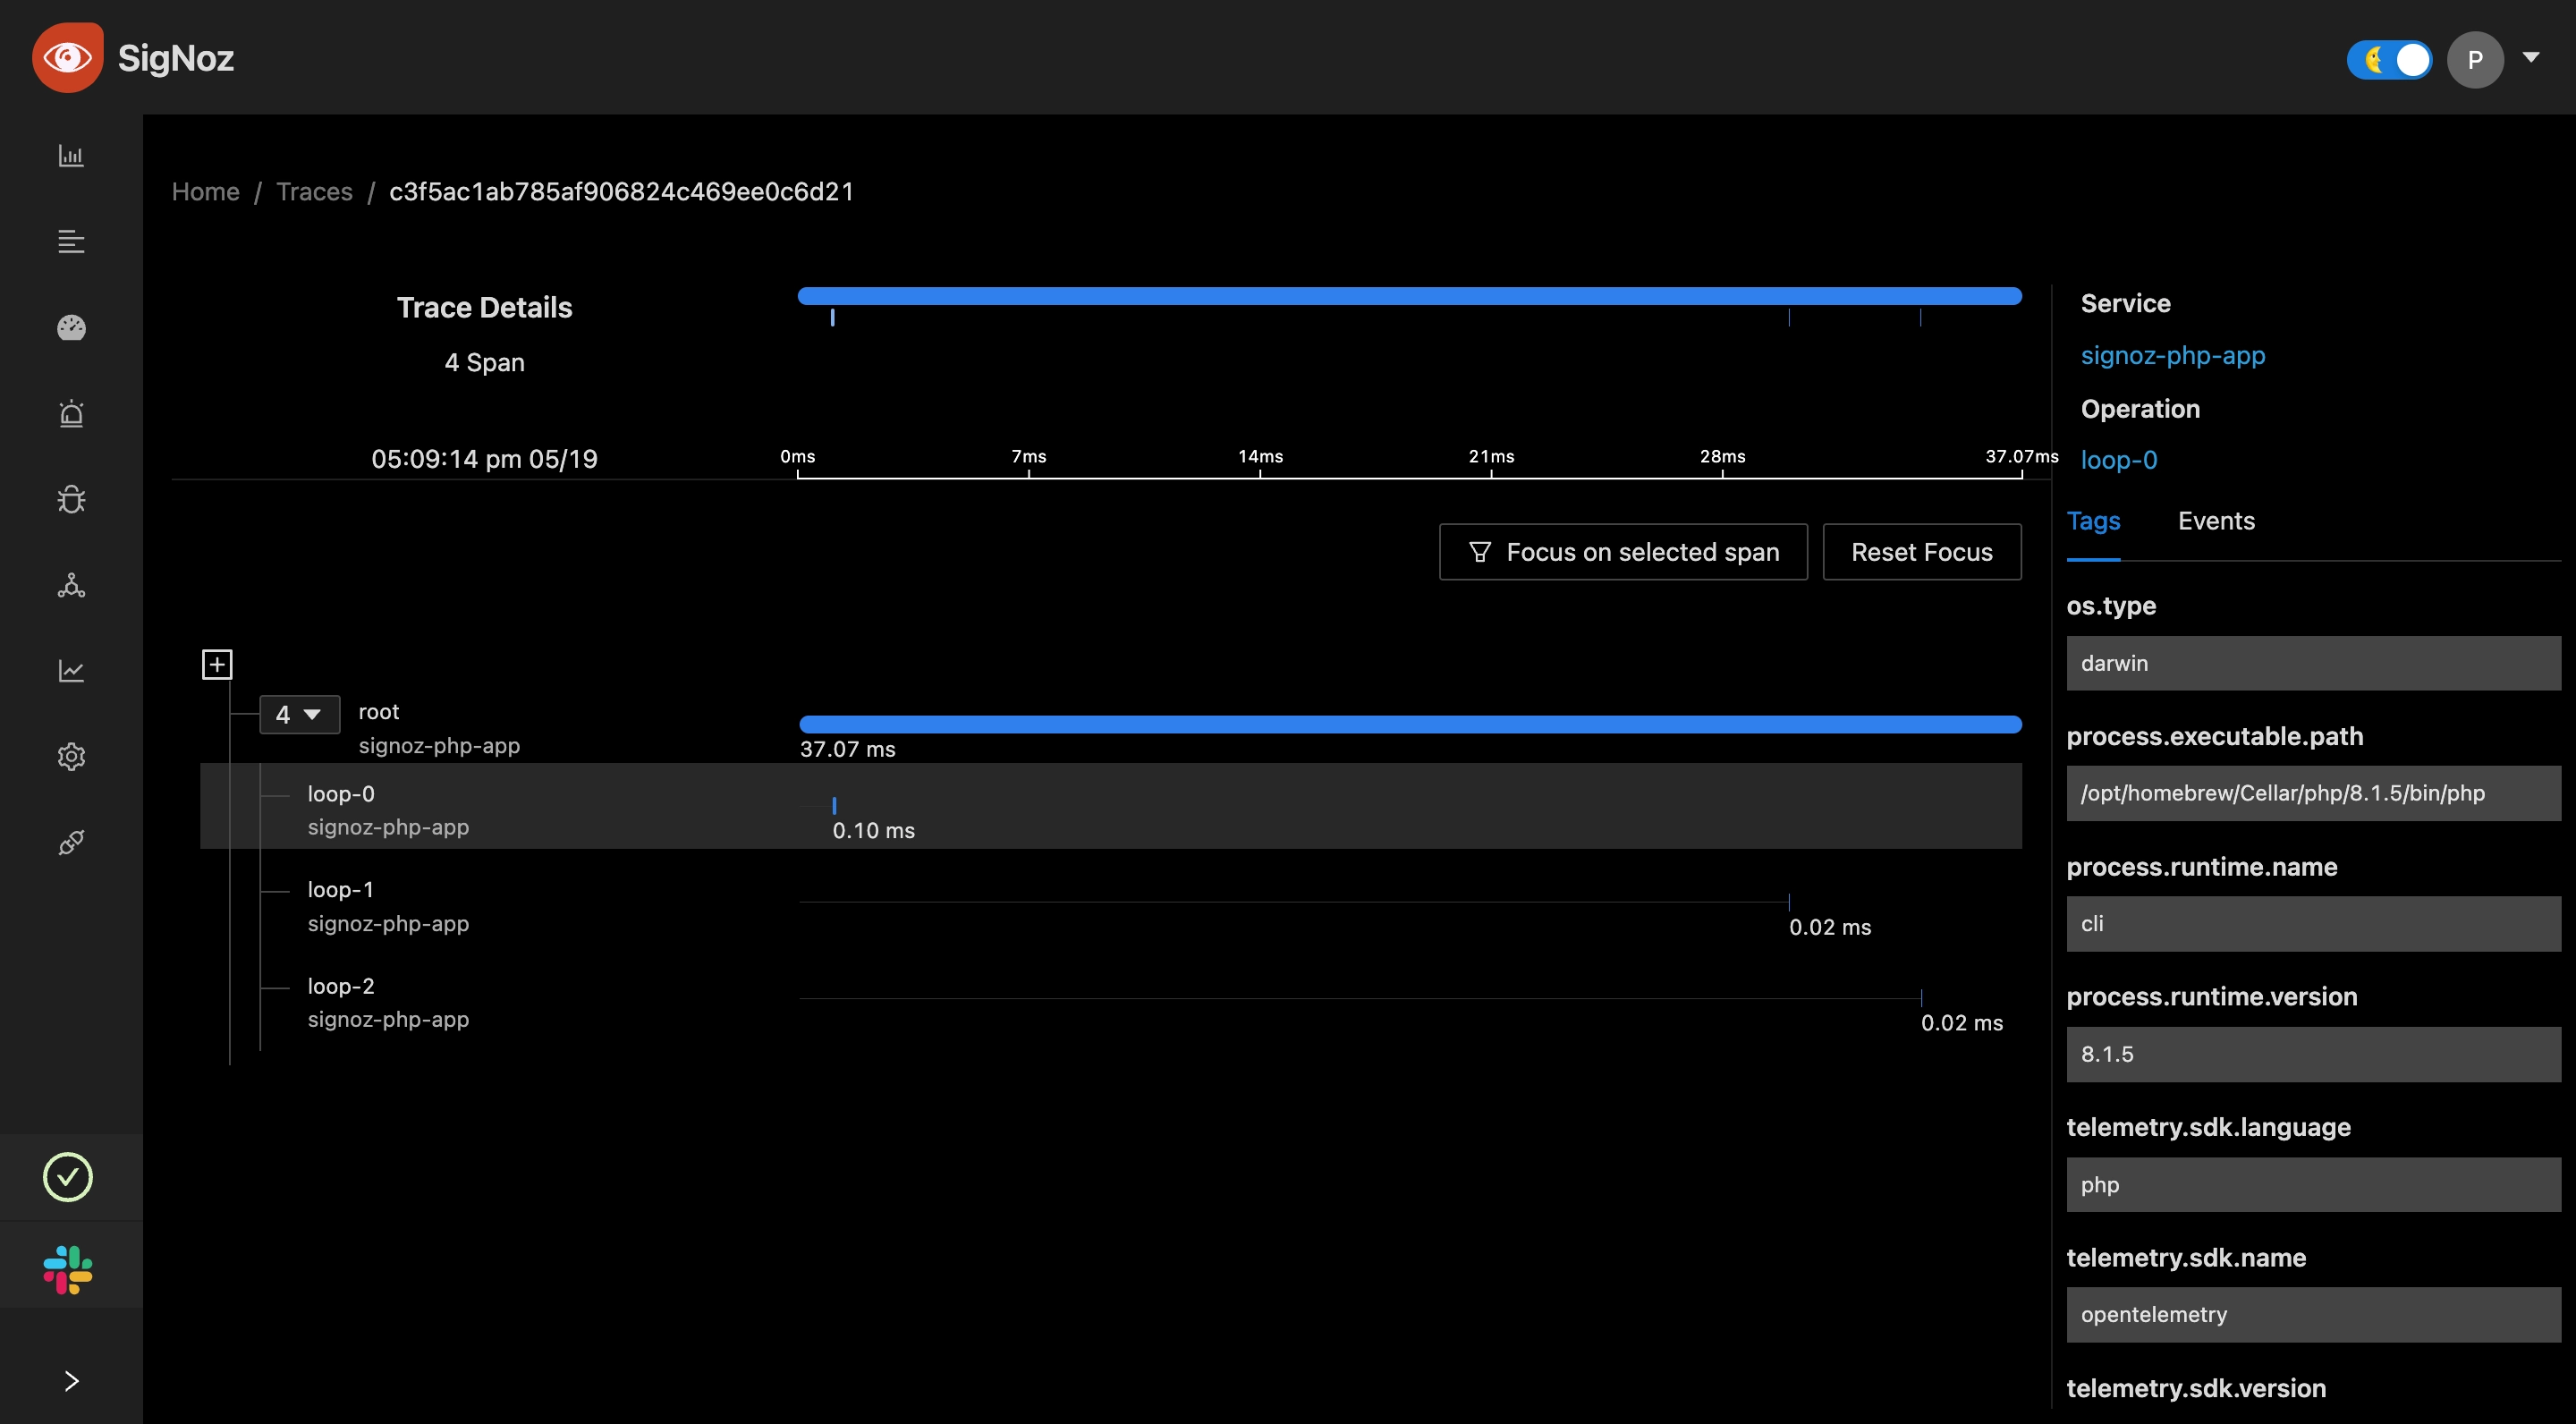
Detailed view of the Trace showing attached attributes/tags to the spans.
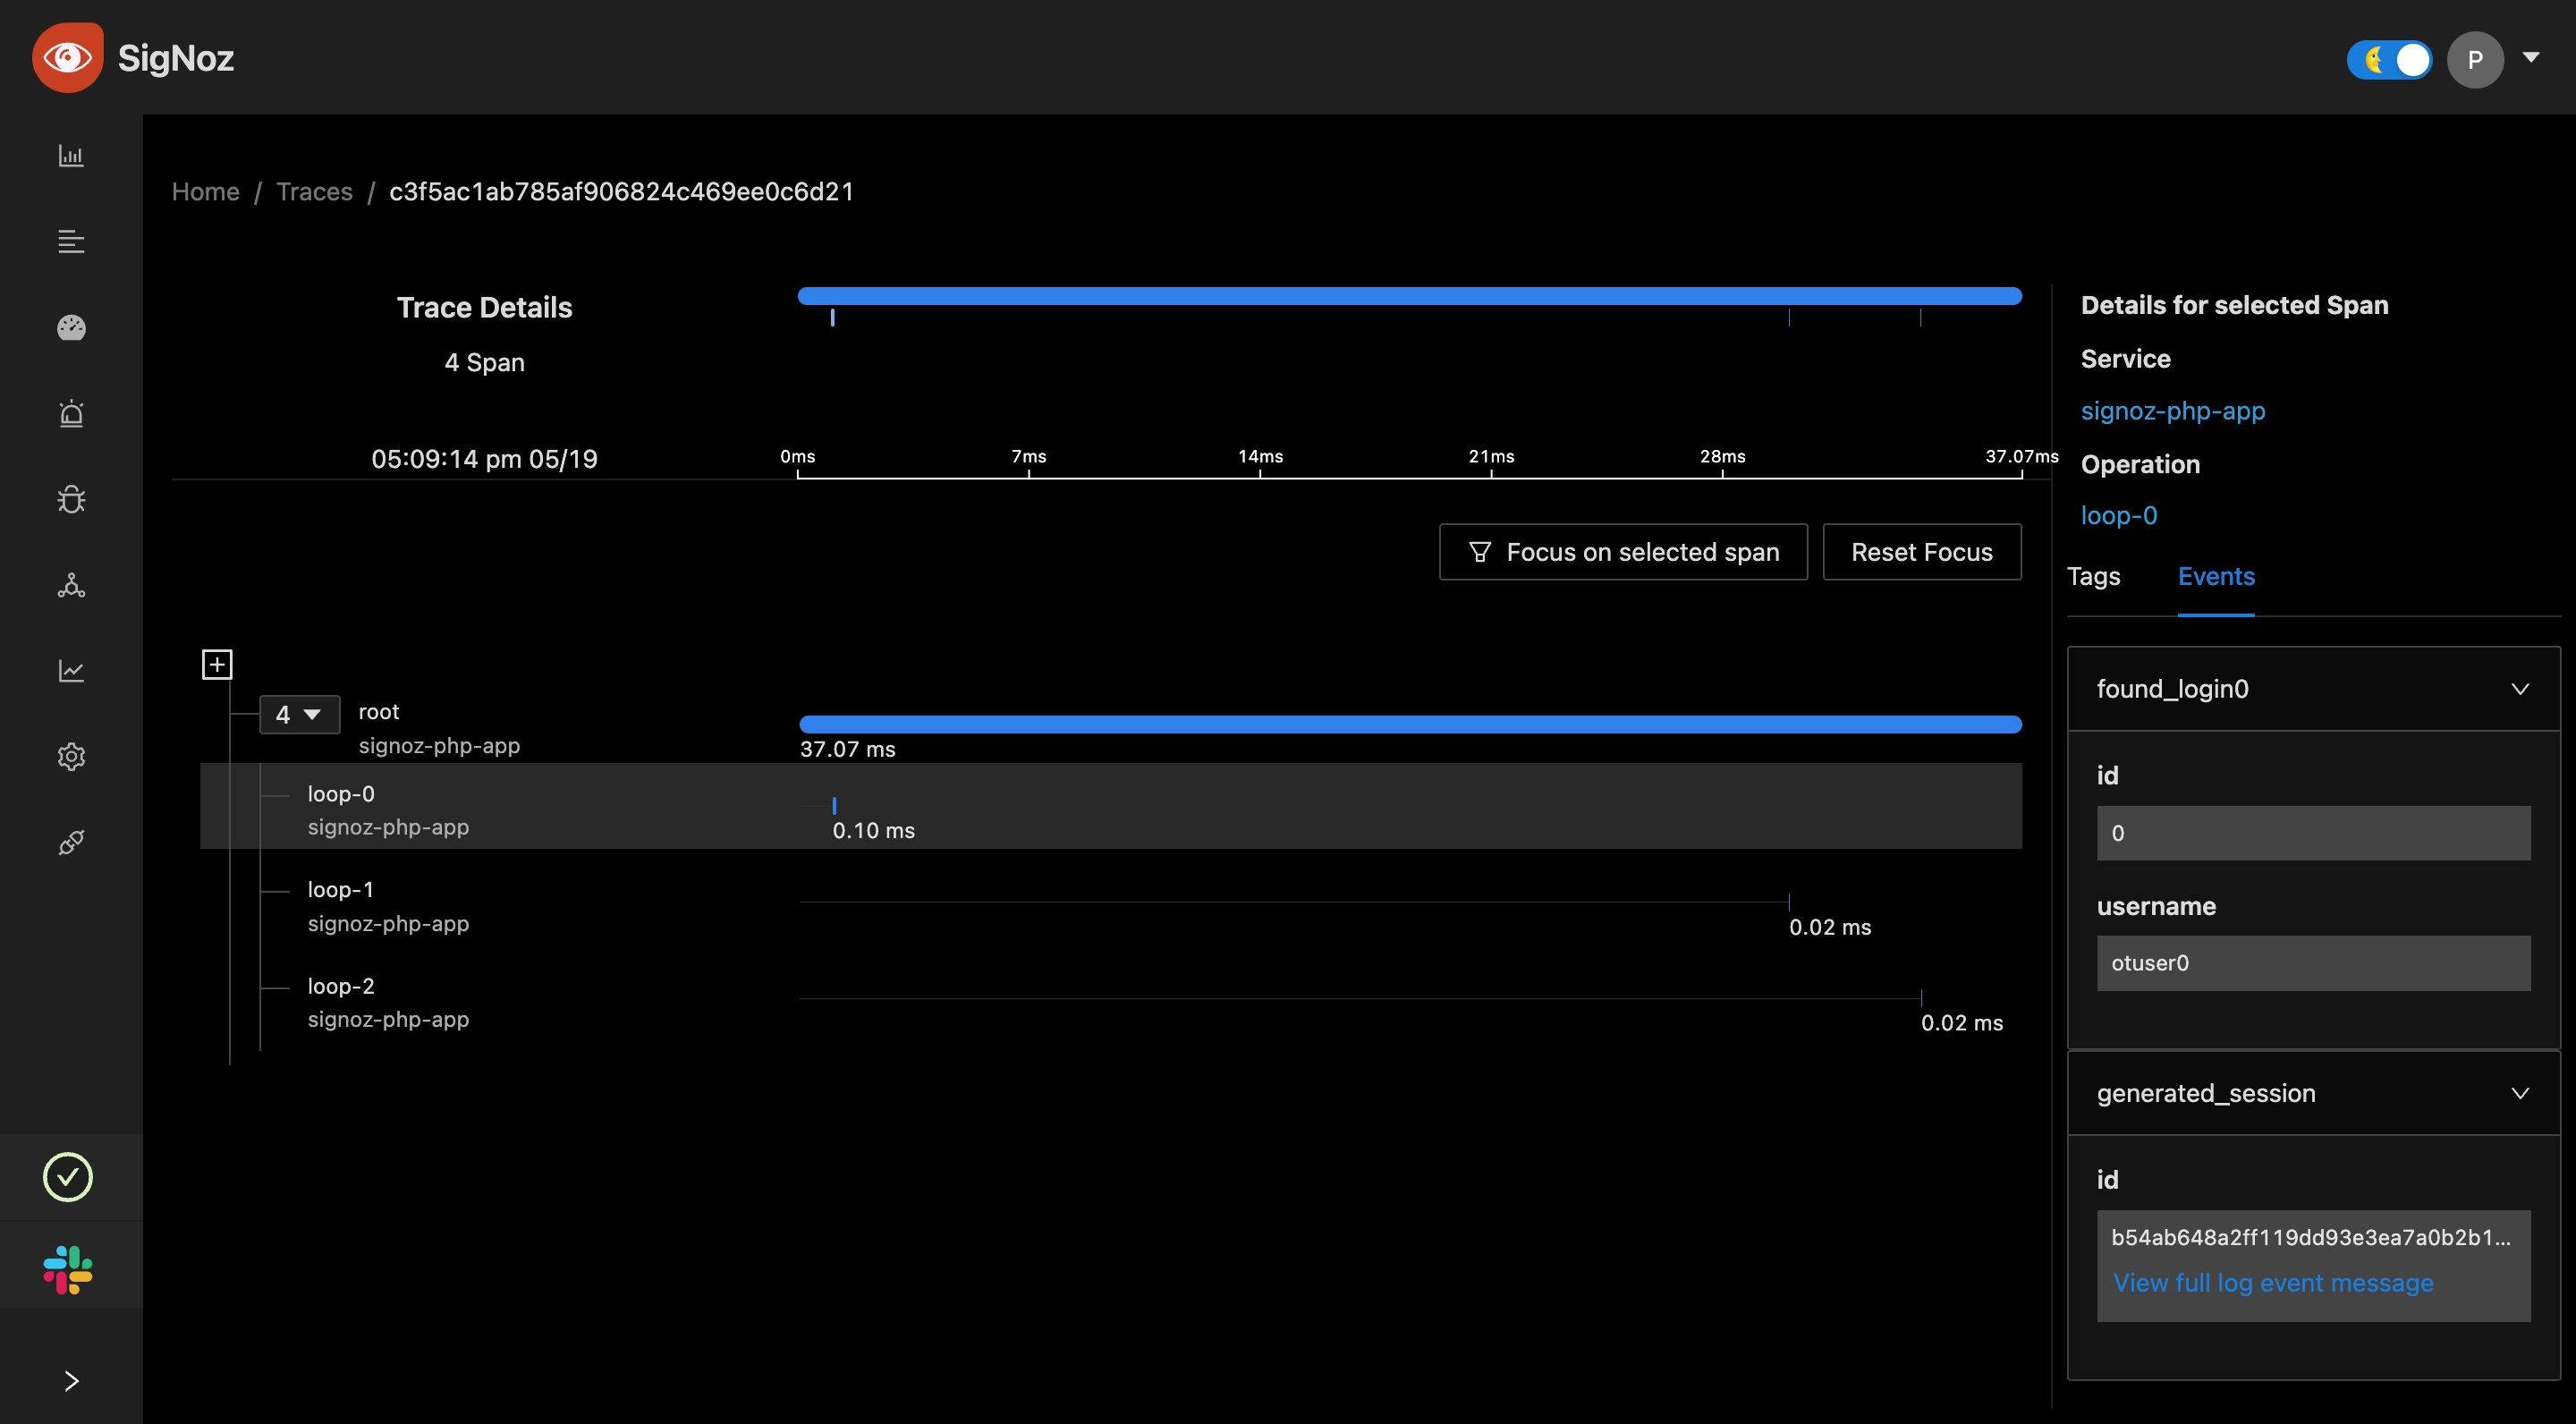
Detailed view of the Trace showing attached events to spans.
Testing with sample PHP application
If you want to test out how SigNoz works with a sample PHP application, check out a sample PHP application at this GitHub.
Frequently Asked Questions
How to find what to use in
IP of SigNozif I have installed SigNoz in Kubernetes cluster?Based on where you have installed your application and where you have installed SigNoz, you need to find the right value for this. Please use this grid to find the value you should use for
IP of SigNozI am sending data from my application to SigNoz, but I don't see any events or graphs in the SigNoz dashboard. What should I do?
This could be because of one of the following reasons:
Your application is generating telemetry data, but not able to connect with SigNoz installation
Please use this troubleshooting guide to find if your application is able to access SigNoz installation and send data to it.
Your application is not actually generating telemetry data
Please check if the application is generating telemetry data first. You can use
Console Exporterto just print your telemetry data in console first. Join our Slack Community if you need help on how to export your telemetry data in consoleYour SigNoz installation is not running or behind a firewall
Please double check if the pods in SigNoz installation are running fine.
docker psorkubectl get pods -n platformare your friends for this.
Recommend
About Joyk
Aggregate valuable and interesting links.
Joyk means Joy of geeK