

Blog | Audio Processing Using MATLAB | MATLAB Helper ®
source link: https://matlabhelper.com/blog/matlab/audio-processing-using-matlab/
Go to the source link to view the article. You can view the picture content, updated content and better typesetting reading experience. If the link is broken, please click the button below to view the snapshot at that time.
What is Sound?
Sound is a wave of air particles. Sound is a vibration of air particles that travel in a specific way, creating a pressure difference, and this sensation comes to human ears. Sound travels in the form of a wave, and for traveling, it needs a medium, such as air or water. Sound cannot travel in a vacuum. We will be using MATLAB to import a sound or an audio file and check out its properties.
What is Audio Signal Processing?
Audio Processing is the domain in science where an audio file is manipulated according to the end-users needs. It can be used to clean up the audio or amplify/enhance it before the transmission. This process can consider different algorithms, techniques, and complex mathematical calculations. For example, adding a low pass filter to an audio stream can be regarded as audio Processing. We have to design the filter and then apply it to our audio stream so that the low-frequency components can be heard, whereas the high-frequency components are attenuated.

Audio Processing
Why use MATLAB for Audio Processing?
MATLAB consists of toolboxes used in different domains like Deep Learning, Machine Learning, Image Processing, etc. Such an example of a toolbox is the Audio Toolbox. The audio toolbox hosts many tweaking for audio files, such as speech analysis, acoustic measurement, etc. It has a set of predefined algorithms used for audio Processing, such as equalization and extracting the audio pitch.
The audio toolbox can be used to import, label, analyze and experiment on datasets, and these can also be used for training models for machine learning and deep learning. So overall, a host of features can be done using the Audio Toolbox in MATLAB, which very few software provide.
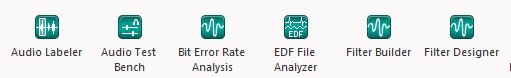
Audio Toolbox
Time-Domain Analysis of an Audio File:
Suppose we have an audio file that has a duration of 5 seconds. So when we do time-domain analysis on that audio file, it means we are analyzing the properties, be it the power in dB or the amplitude; we are doing it from time t=0 to t=5.
Importing an Audio File in MATLAB
MATLAB environment consists of many functions for audio Processing. But for carrying out experiments to an audio file, we need to import the audio file first. Now, audio files have many extensions, like ".wav", ".m4a", ".mp3", etc. Previously, the ".wav" format was used, but the audio quality was low. Presently, we use the ".mp3" format. Since the ".wav" format was followed for a long time, MATLAB had a function named wavread() to import and read an audio file. The problem with this function was that this could only be used to read ".wav" files; moreover, it is most likely not available in the present MATLAB versions.
So, a new function named audioread() was introduced, and the benefit of this function is that it could import and read audio files of all formats and give the necessary details in the workspace column. The syntax for writing the audioread() function is:
[x, fs] = audioread("audio.format")
It is necessary to mention "fs" the sampling frequency at which the audio will be stored. Generally, audio files have a default sampling frequency of 44,100Hz.
Plotting the Audio Signal in Time Domain
After reading the audio file, it is now required to plot the audio file in time-domain analysis. The audio file has two channels since it is in stereo mode, but we wish to generate a time-domain analysis for mono audio. So we will select all the rows and the first column  . Then we will obtain the length of the audio file using the length() function., which will show us the total number of data samples. Now, we have to convert it into a time sample; for that, we will take the time as
  . The length divided by the time sampling will give us the audio file's duration.
To plot the audio Signal, we will have to use the plot() function. To plot the time domain analysis, we will have to use the command plot(t,x) so that on the x-axis, our preferred time domain is present.
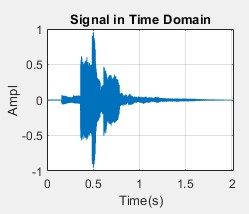
Time Domain
Plotting the spectrogram of the Signal
A spectrogram is a visual representation of the spectrum of frequencies of a signal as it varies with time. When applied to an audio signal, spectrograms are sometimes called sonography, voiceprints, or voicegrams. We will use the spectrogram() function, where we have to give the input, the window size, sampling frequency, and the number of FFT's which is 512 in our case. The x-axis should be in time, and the y-axis should be frequency. The blue value shows that higher power is present at that instant.
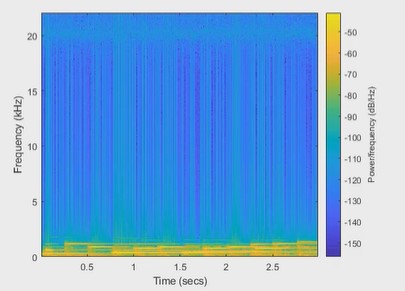
Spectrogram
Plotting the Periodogram:
In signal processing, a periodogram estimates the spectral density of a signal. It can be used for showing the power content for a particular frequency. We need to get a hanning window using the hanning() function. After the hanning window is created, we will input it into the periodogram() function, the audio input, the total number of samples, and the sampling rate.
[X,f]=periodogram(x, w, N, fs, 'power')
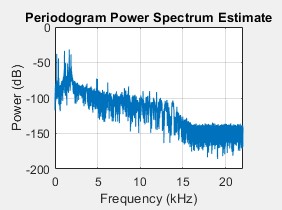
Periodogram
From the periodogram, we can see that the power decreases after 5kHz frequency. We can plot the same graph in a logarithmic scale, for that, we will be using the command:
X= 20* log10(sqrt(X)*sqrt(2));
subplot(2,2,3)
semilogx(f, X)
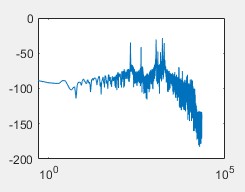
Logarithmic Periodogram
Plotting the Histogram of the Signal
A histogram is a graphical representation that organizes a group of data points into user-specified ranges. Like a bar graph, the histogram condenses a data series into an easily interpreted visual by taking many data points and grouping them into logical ranges or bins. We will use the histogram() function to generate the required plot to see the histogram.
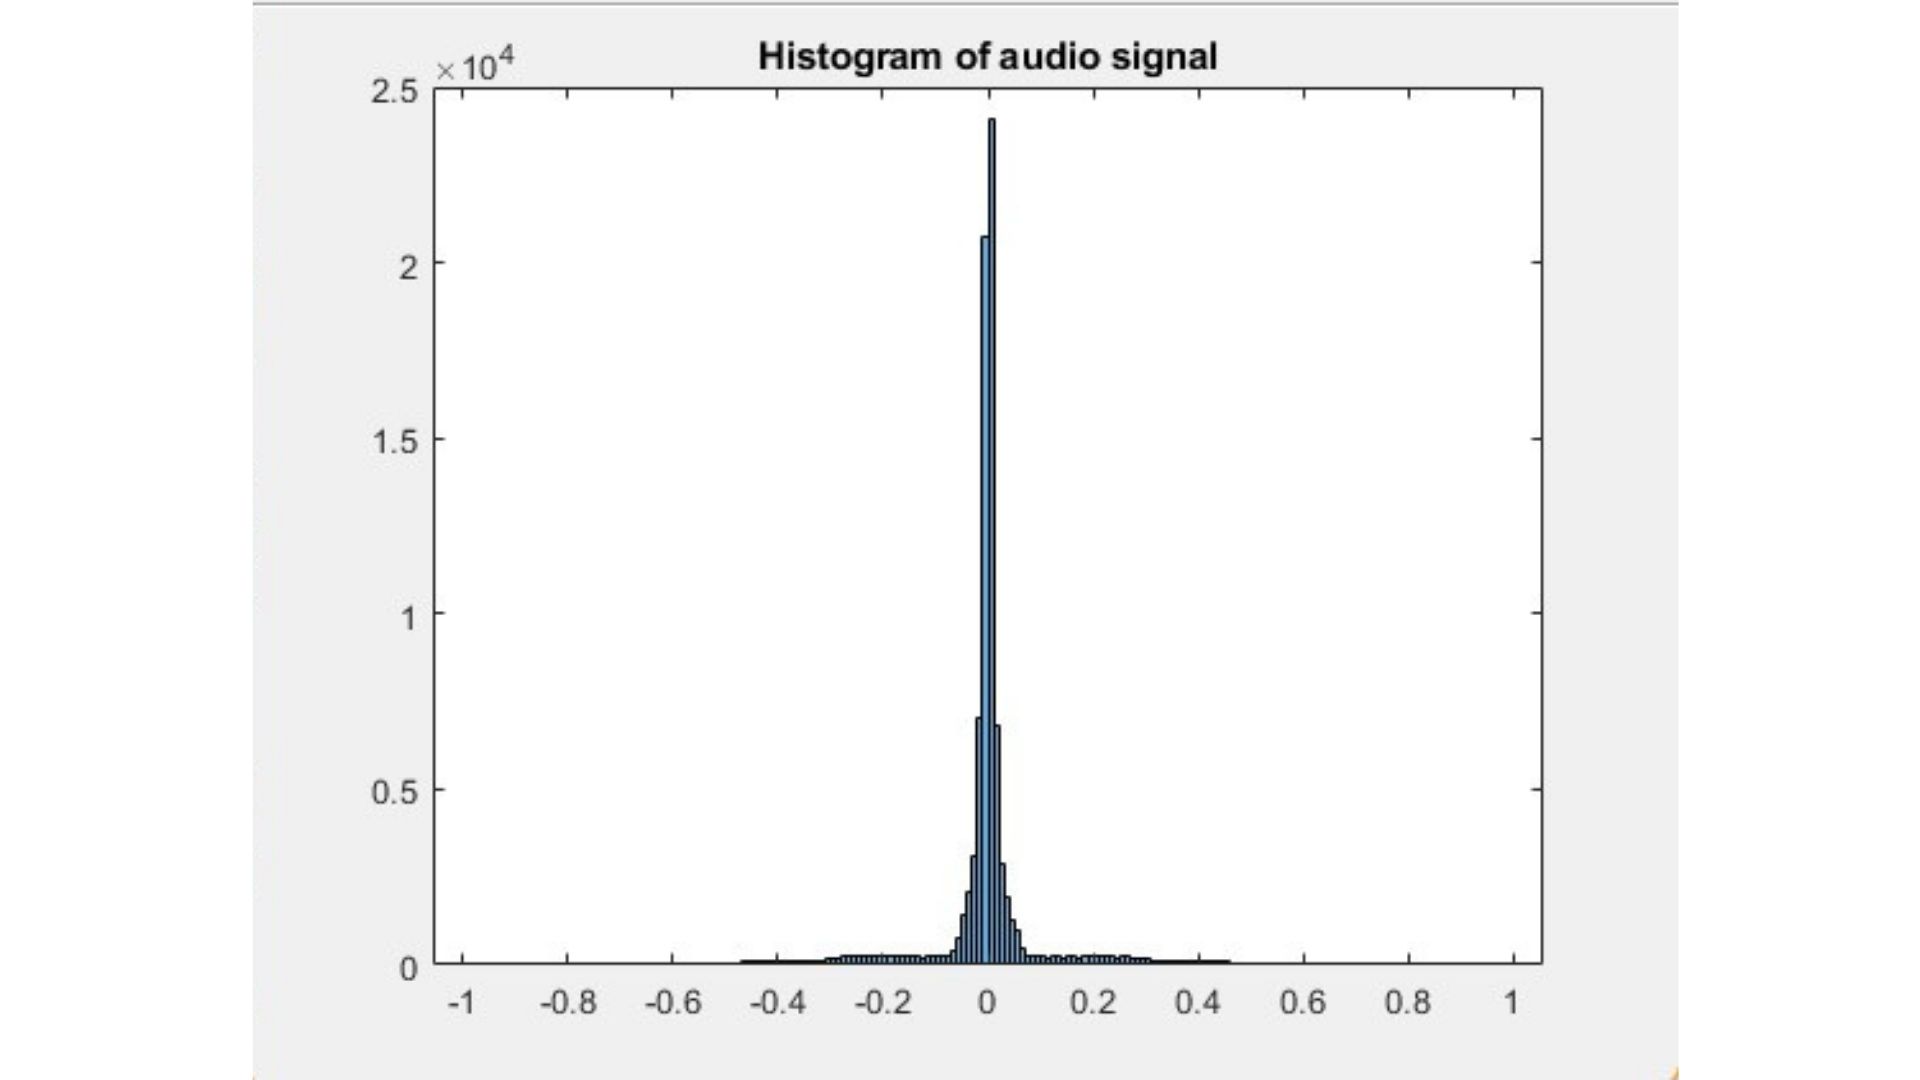
Histogram
From the plot, we can see that most of the content of the graph lies in the “0” of the x-axis, which means that the signal is an example of a normalised signal, and a perfect signal for the analysis.
MATLAB Code:
% we recorded.
%This will display the spectrogram and histogram of the audio signal
%Author: Ayush Sengupta, MATLAB Helper
%Topic: TimeDomain Analysis of Audio Signal
%Website: https://MATLABHelper.com
%Date:26/03/2022
clc;
clear all;
close all;
[x, fs] = audioread("notification.mp3")
x= x(:,1);
N=length(x);
t= (0: N-1)/fs;
N/fs
subplot(2,2,1)
plot(t,x)
grid on
xlabel("Time(s)")
ylabel("Ampl")
title("Signal in Time Domain")
maxval = max(x)
minval = min(x)
meanval= mean(x)
stdval= std(x)
subplot(2,2,2)
spectrogram(x, 1024, 512, 1024, fs, 'yaxis')
title("Spectrogram of signal")
w=hanning(N, 'periodic');
periodogram(x, w, N, fs, 'power')
[X,f]=periodogram(x, w, N, fs, 'power')
X= 20* log10(sqrt(X)*sqrt(2));
subplot(2,2,3)
semilogx(f, X)
subplot(2,2,4)
histogram(x)
title("Histogram of audio signal")
Conclusion:
This blog covered what sound is and how we can use MATLAB to perform audio Processing and analyze the time domain spectrum. After importing the audio file in MATLAB, the following plots were obtained using the respective functions:
Time Domain Analysis Spectrum
- Spectrogram
- Periodogram
- Periodogram in logarithmic scale
- Histogram
However, MATLAB is not just limited to these specific plots. Instead of time domain, frequency domain analysis can also be done, and different graphs can be obtained and analyzed.
Did you find some helpful content from our video or article and now looking for its code, model, or application? You can purchase the specific Title, if available, and instantly get the download link.
Thank you for reading this blog. Do share this blog if you found it helpful. If you have any queries, post them in the comments or contact us by emailing your questions to [email protected]. Follow us on LinkedIn Facebook, and Subscribe to our YouTube Channel. If you find any bug or error on this or any other page on our website, please inform us & we will correct it.
If you are looking for free help, you can post your comment below & wait for any community member to respond, which is not guaranteed. You can book Expert Help, a paid service, and get assistance in your requirement. If your timeline allows, we recommend you book the Research Assistance plan. If you want to get trained in MATLAB or Simulink, you may join one of our training modules.
If you are ready for the paid service, share your requirement with necessary attachments & inform us about any Service preference along with the timeline. Once evaluated, we will revert to you with more details and the next suggested step.
Education is our future. MATLAB is our feature. Happy MATLABing!
Recommend
About Joyk
Aggregate valuable and interesting links.
Joyk means Joy of geeK