

Enabling Code Profiler for Python on App Service Linux
source link: https://azureossd.github.io/2022/05/09/Enabling-Code-Profiler-for-Python-on-App-Service-Linux/index.html
Go to the source link to view the article. You can view the picture content, updated content and better typesetting reading experience. If the link is broken, please click the button below to view the snapshot at that time.
Enabling Code Profiler for Python on App Service Linux
2 minute read | By Kendrick Dubuisson
The App Service Linux Python images now come pre-configured with a code-profiler. This quickly allows us to collect traces for troubleshooting High Memory & High CPU against our running Python process without installing any additional packages within your application manually.
Once enabled & run, it’ll output our trace as a JSON file directly onto the file system for us to download. Additionally, we will use VizTracer to review the timeline & visualization of execution/utilization while providing insights into the active call stack.
This blog will walk through enabling the profiler on App Service Linux & reviewing locally.
Enabling & Gathering a trace on App Service Linux
-
To enable code profiler, first add the App Setting
WEBSITE_ENABLE_DEFAULT_CODE_PROFILER=trueto your App Service configuration. ⚠️ Adding this App Setting will restart your application. -
Validate the running process to profile. In this example, we’re using gunicorn running in forked mode so it’s expected to see multiple processes, but we can use variations of ps to target the process-id consuming cpu time. This same approach can be used if other python servers to serve your application.
 #checking for the running python process id
 ps -aux

 ps -C gunicorn fc -o ppid,pid,cmd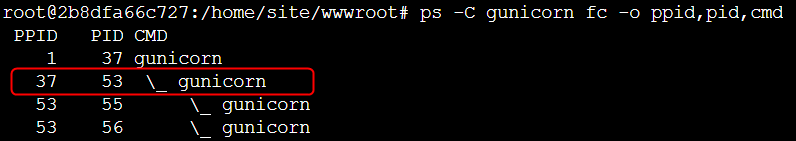
-
Use the following command to start the profile. Upon completion additional steps will be provided in the console that we will also cover in our next steps.
code-profiler --attach <PID> -t <Number of seconds to profile>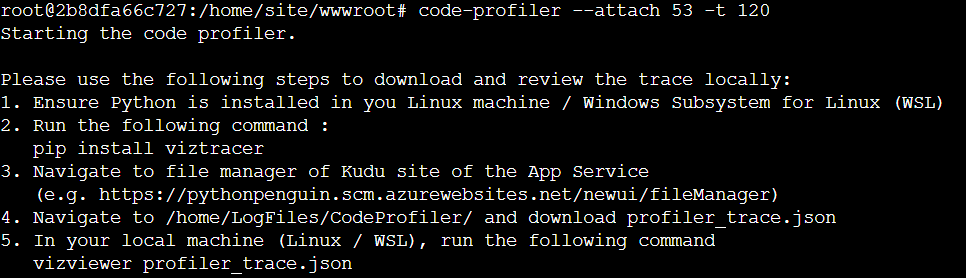
-
Navigate to file manager of Kudu site of the App Service & validate profiler output. This can be downloaded directly from the File manager to review locally.
- Kudu New UI:
https://<site-name>.scm.azurewebsites.net/newui/fileManager - Default Trace Location:
/home/LogFiles/CodeProfiler/profiler_trace.json
NOTE: If there is no profiler_trace.json present after running the code-profiler, this can be caused if the incorrect PID is choosen.
- Kudu New UI:
Reviewing the trace locally with VizTrace
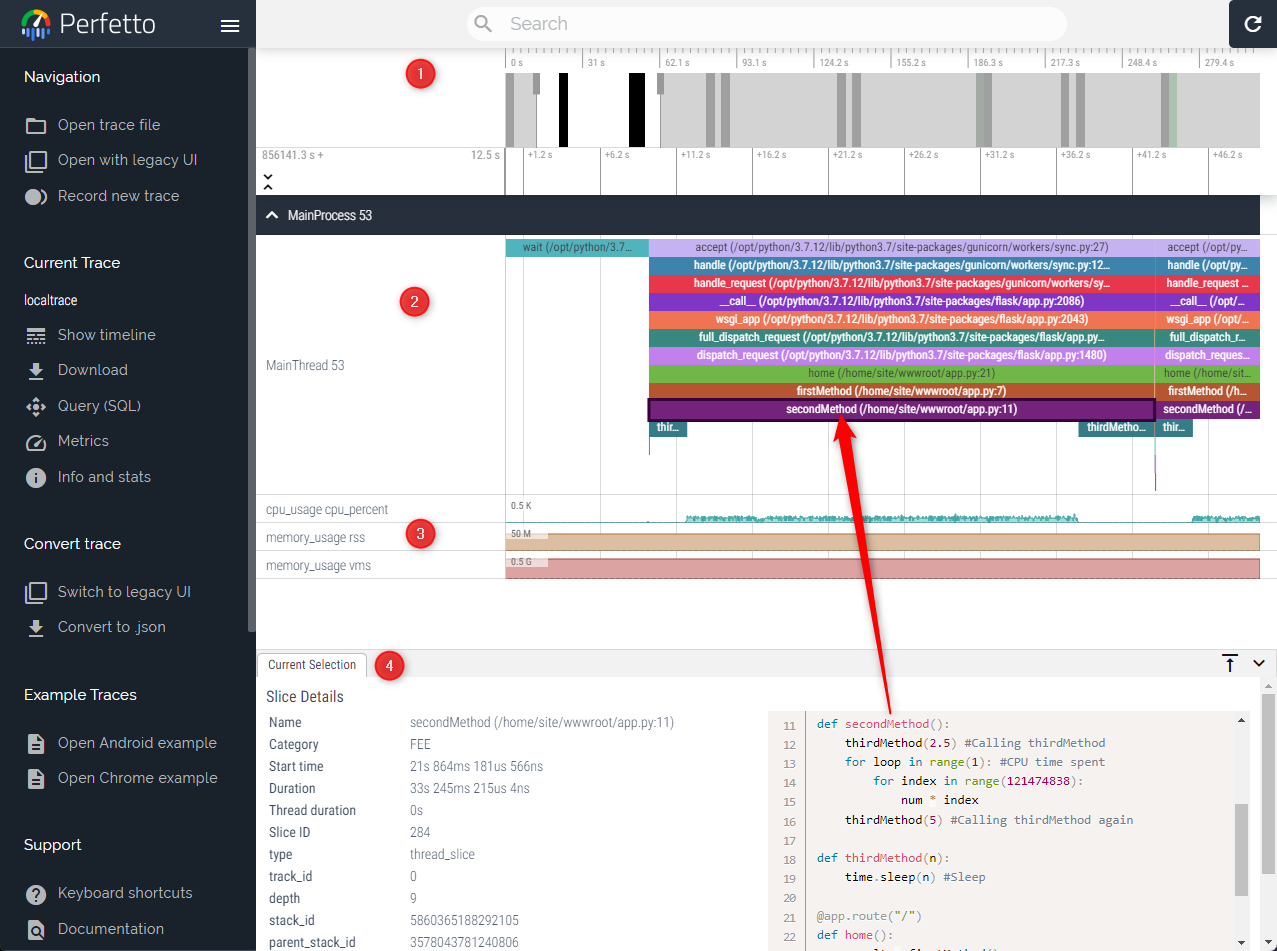
VizTracer is a low-overhead logging/debugging/profiling tool that can trace and visualize your python code execution. The front-end UI is powered by Perfetto.
-
Ensure Python is installed in your Linux machine / Windows Subsystem for Linux (WSL)
- Run the following command to install viztracer: pip install viztracer
- On your local machine (Linux / WSL), run the following command
vizviewer --port 8080 profiler_trace.json - This will open vizviewer & your trace. Below we can see the my “secondMethod” function was called which also consumed CPU visible in the timelime.
- Timeline
- Process Graph
- CPU & Memory Utilization
- Function Selection
Recommend
About Joyk
Aggregate valuable and interesting links.
Joyk means Joy of geeK