
Optimal and Fair Spatial Siting
source link: https://andrewpwheeler.com/2022/01/23/optimal-and-fair-spatial-siting/
Go to the source link to view the article. You can view the picture content, updated content and better typesetting reading experience. If the link is broken, please click the button below to view the snapshot at that time.
Optimal and Fair Spatial Siting
A bit of a belated MLK day post. Much of the popular news on predictive or machine learning algorithms has a negative connotation, often that they are racially biased. I tend to think about algorithms though in almost the exact opposite way – we can adjust them to suit our objectives. We just need to articulate what exactly we mean by fair. This goes for predictive policing (Circo & Wheeler, 2021; Liberatore et al., 2021; Mohler et al., 2018; Wheeler, 2020) as much as it does for any application.
I have been reading a bit about spatial fairness in siting health resources recently, one example is the Urban Institutes Equity Data tool. For this tool, you put in where your resources are currently located, and it tells you whether those locations are located in areas that have demographic breakdowns like the overall city. So this uses the container approach (not distance to the resources), which distance traveled to resources is probably a more typical way to evaluate fair spatial access to resources (Hassler & Ceccato, 2021; Koschinsky et al., 2021).
Here what I am going to show is instead of ex-ante saying whether the siting of resources is fair, I construct an integer linear program to site resources in a way we define to be fair. So imagine that we are siting 3 different locations to do rapid Covid testing around a city. Well, we do the typical optimization and minimize the distance traveled for everyone in the city on average to those 3 locations – on average 2 miles. But then we see that white people on average travel 1.9 miles, and minorities travel 2.2 miles. So it that does not seem so fair does it.
I created an integer linear program to take this difference into account, so instead of minimizing average distance, it minimizes:
White_distance + Minority_distance + |White_distance - Minority_distance|So in our example above, if we had a solution that was white travel 2.1 and minority 2.1, this would be a lower objective value than (4.2), than the original minimize overall travel (1.9 + 2.2 + 0.3 = 4.4). So this gives each minority groups equal weight, as well as penalizes if one group (either whites or minorities) has much larger differences.
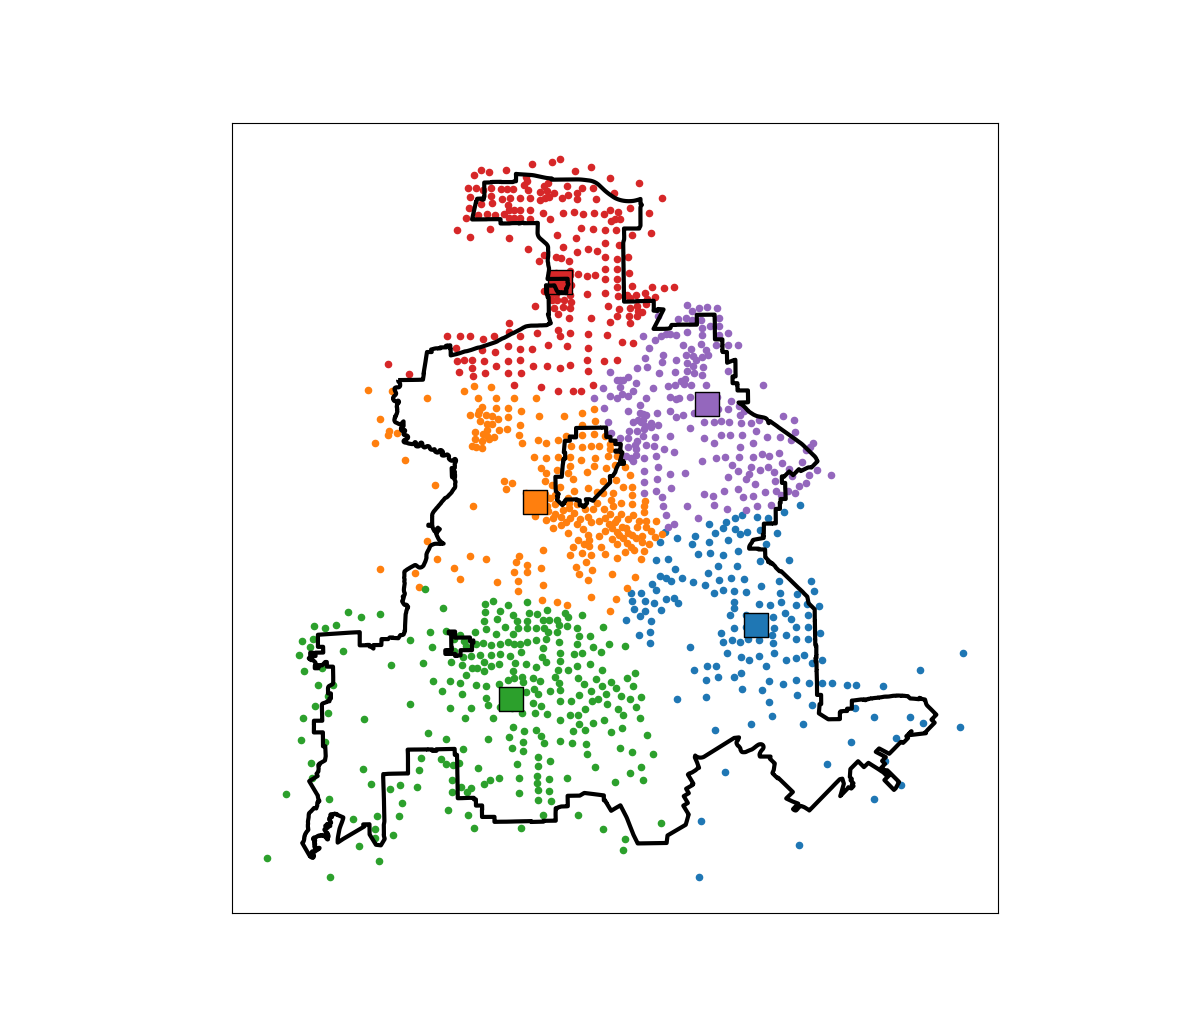
I am not going to go into all the details. I have python code that has the functions (it is very similar to my P-median model, Wheeler, 2018). The codes shows an example of siting 5 locations in Dallas (and uses census block group centroids for the demographic data). Here is a map of the results (it has points outside of the city, since block groups don’t perfectly line up with the city boundaries).

In this example, if we choose 5 locations in the city to minimize the overall distance, the average travel is just shy of 3.5 miles. The average travel for white people (not including Hispanics) is 3.25 miles, and for minorities is 3.6 miles. When I use my fair algorithm, the white average distance is 3.5 miles, and the minority average distance is 3.6 miles (minority on average travels under 200 more feet on average than white).
So this is ultimately a trade off – it ends up pushing up the average distance a white person will travel, and only slightly pushes down the minority travel, to balance the overall distances between the two groups. It is often the case though that one can be somewhat more fair, but in only results in slight trade-offs though in the overall objective function (Rodolfa et al., 2021). So that trade off is probably worth it here.
References
- Circo, G., & Wheeler, A. (2021). National Institute of Justice Recidivism Forecasting Challenge Team “MCHawks” Performance Analysis. CrimRxiv
- Hassler, J., & Ceccato, V. (2021). Socio-spatial disparities in access to emergency health care—A Scandinavian case study. PLoS ONE, 16(12), e0261319.
- Koschinsky, J., Marwell, N., & Mansour, R. (2021). Does Health Service Funding Go Where the Need Is? A Prototype Spatial Access Analysis for New Urban Contracts Data. BMC Health Services Research 22:45.
- Liberatore, F., Camacho-Collados, M., & Quijano-Sánchez, L. (2021). Equity in the Police Districting Problem: Balancing Territorial and Racial Fairness in Patrolling Operations. Journal of Quantitative Criminology, Online First.
- Mohler, G., Raje, R., Carter, J., Valasik, M., & Brantingham, J. (2018). A penalized likelihood method for balancing accuracy and fairness in predictive policing. IEEE international conference on systems, man, and cybernetics (SMC) (pp. 2454-2459)
- Rodolfa, K. T., Lamba, H., & Ghani, R. (2021). Empirical observation of negligible fairness–accuracy trade-offs in machine learning for public policy. Nature Machine Intelligence, 3(10), 896-904.
- Wheeler, A. P. (2018). Creating optimal patrol areas using the p-median model. Policing: An International Journal, 42(3), 318-333.
- Wheeler, A. P. (2020). Allocating police resources while limiting racial inequality. Justice Quarterly, 37(5), 842-868.
Recommend
About Joyk
Aggregate valuable and interesting links.
Joyk means Joy of geeK