
2

Security Monitoring with eBPF
source link: https://www.slideshare.net/AlexMaestretti/security-monitoring-with-ebpf
Go to the source link to view the article. You can view the picture content, updated content and better typesetting reading experience. If the link is broken, please click the button below to view the snapshot at that time.
Security Monitoring with eBPF
- 1. ALEX MAESTRETTI - MANAGER, SIRT BRENDAN GREGG - Sr ARCHITECT, PERFORMANCE Security Monitoring with eBPF
- 2. The Brief. Extended Berkley Packet Filter (eBPF) is a new Linux feature which allows safe and efficient monitoring of kernel functions. This has dramatic implications for security monitoring, especially at Netflix scale. We are encouraging the security community to leverage this new technology to all of our benefit.
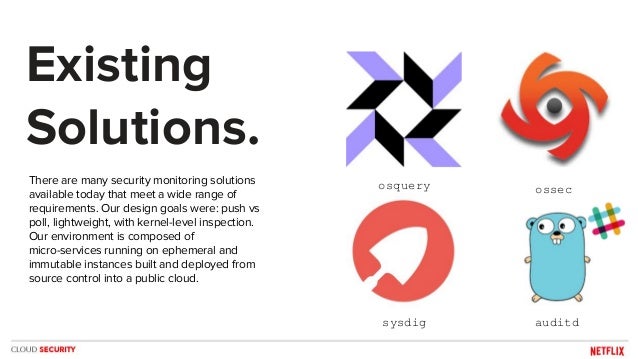
- 3. There are many security monitoring solutions available today that meet a wide range of requirements. Our design goals were: push vs poll, lightweight, with kernel-level inspection. Our environment is composed of micro-services running on ephemeral and immutable instances built and deployed from source control into a public cloud. Existing Solutions. auditd osquery ossec sysdig
- 4. A new Option.
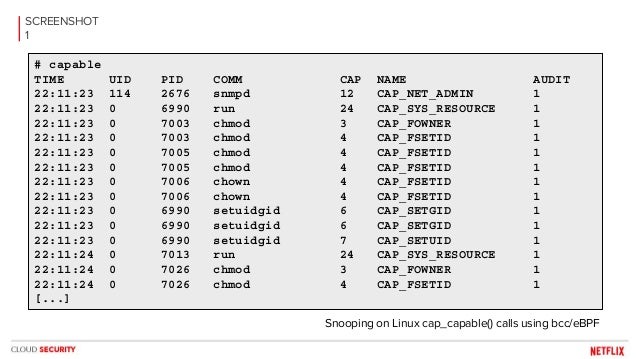
- 5. SCREENSHOT 1 # capable TIME UID PID COMM CAP NAME AUDIT 22:11:23 114 2676 snmpd 12 CAP_NET_ADMIN 1 22:11:23 0 6990 run 24 CAP_SYS_RESOURCE 1 22:11:23 0 7003 chmod 3 CAP_FOWNER 1 22:11:23 0 7003 chmod 4 CAP_FSETID 1 22:11:23 0 7005 chmod 4 CAP_FSETID 1 22:11:23 0 7005 chmod 4 CAP_FSETID 1 22:11:23 0 7006 chown 4 CAP_FSETID 1 22:11:23 0 7006 chown 4 CAP_FSETID 1 22:11:23 0 6990 setuidgid 6 CAP_SETGID 1 22:11:23 0 6990 setuidgid 6 CAP_SETGID 1 22:11:23 0 6990 setuidgid 7 CAP_SETUID 1 22:11:24 0 7013 run 24 CAP_SYS_RESOURCE 1 22:11:24 0 7026 chmod 3 CAP_FOWNER 1 22:11:24 0 7026 chmod 4 CAP_FSETID 1 [...] Snooping on Linux cap_capable() calls using bcc/eBPF
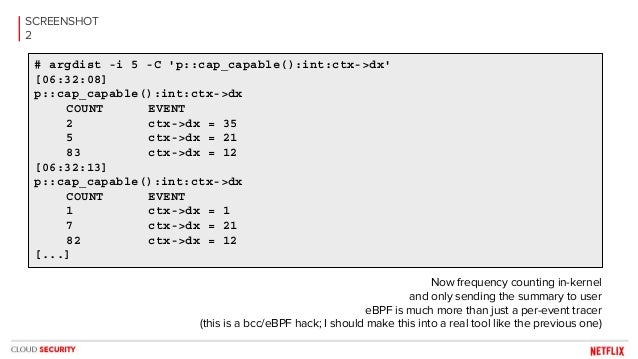
- 6. SCREENSHOT 2 # argdist -i 5 -C 'p::cap_capable():int:ctx->dx' [06:32:08] p::cap_capable():int:ctx->dx COUNT EVENT 2 ctx->dx = 35 5 ctx->dx = 21 83 ctx->dx = 12 [06:32:13] p::cap_capable():int:ctx->dx COUNT EVENT 1 ctx->dx = 1 7 ctx->dx = 21 82 ctx->dx = 12 [...] Now frequency counting in-kernel and only sending the summary to user eBPF is much more than just a per-event tracer (this is a bcc/eBPF hack; I should make this into a real tool like the previous one)
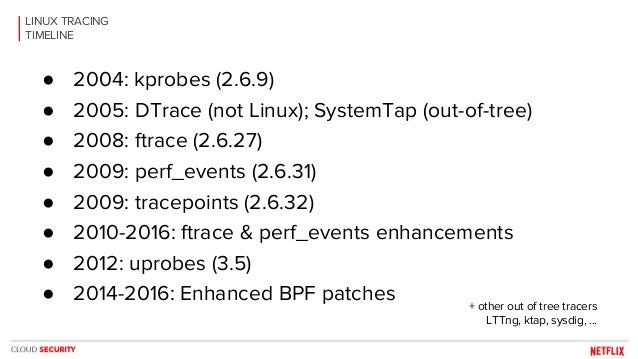
- 7. LINUX TRACING TIMELINE ● 2004: kprobes (2.6.9) ● 2005: DTrace (not Linux); SystemTap (out-of-tree) ● 2008: ftrace (2.6.27) ● 2009: perf_events (2.6.31) ● 2009: tracepoints (2.6.32) ● 2010-2016: ftrace & perf_events enhancements ● 2012: uprobes (3.5) ● 2014-2016: Enhanced BPF patches + other out of tree tracers LTTng, ktap, sysdig, ...
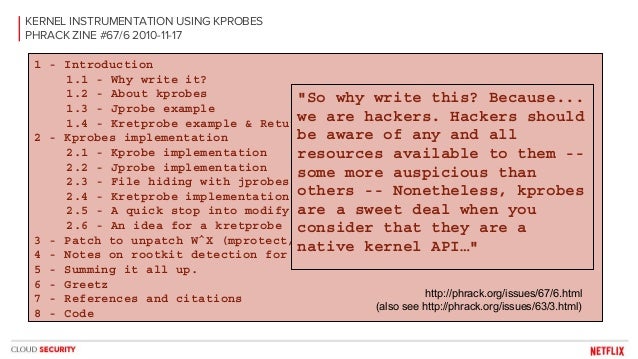
- 8. KERNEL INSTRUMENTATION USING KPROBES PHRACK ZINE #67/6 2010-11-17 1 - Introduction 1.1 - Why write it? 1.2 - About kprobes 1.3 - Jprobe example 1.4 - Kretprobe example & Return probe patching technique 2 - Kprobes implementation 2.1 - Kprobe implementation 2.2 - Jprobe implementation 2.3 - File hiding with jprobes/kretprobes and modifying kernel .text 2.4 - Kretprobe implementation 2.5 - A quick stop into modifying read-only kernel segments 2.6 - An idea for a kretprobe implementation for hackers 3 - Patch to unpatch W^X (mprotect/mmap restrictions) 4 - Notes on rootkit detection for kprobes 5 - Summing it all up. 6 - Greetz 7 - References and citations 8 - Code http://phrack.org/issues/67/6.html (also see http://phrack.org/issues/63/3.html) "So why write this? Because... we are hackers. Hackers should be aware of any and all resources available to them -- some more auspicious than others -- Nonetheless, kprobes are a sweet deal when you consider that they are a native kernel API…"
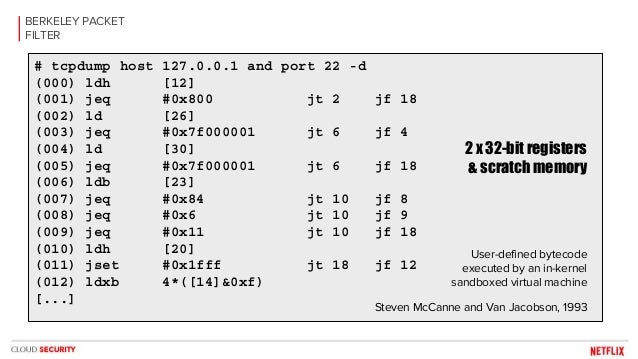
- 9. BERKELEY PACKET FILTER # tcpdump host 127.0.0.1 and port 22 -d (000) ldh [12] (001) jeq #0x800 jt 2 jf 18 (002) ld [26] (003) jeq #0x7f000001 jt 6 jf 4 (004) ld [30] (005) jeq #0x7f000001 jt 6 jf 18 (006) ldb [23] (007) jeq #0x84 jt 10 jf 8 (008) jeq #0x6 jt 10 jf 9 (009) jeq #0x11 jt 10 jf 18 (010) ldh [20] (011) jset #0x1fff jt 18 jf 12 (012) ldxb 4*([14]&0xf) [...] User-defined bytecode executed by an in-kernel sandboxed virtual machine Steven McCanne and Van Jacobson, 1993 2 x 32-bit registers & scratch memory
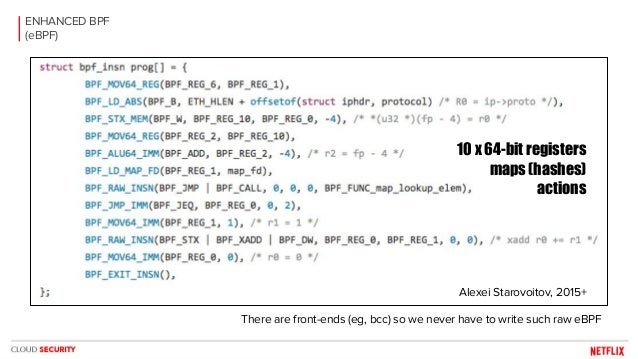
- 10. ENHANCED BPF (eBPF) There are front-ends (eg, bcc) so we never have to write such raw eBPF Alexei Starovoitov, 2015+ 10 x 64-bit registers maps (hashes) actions
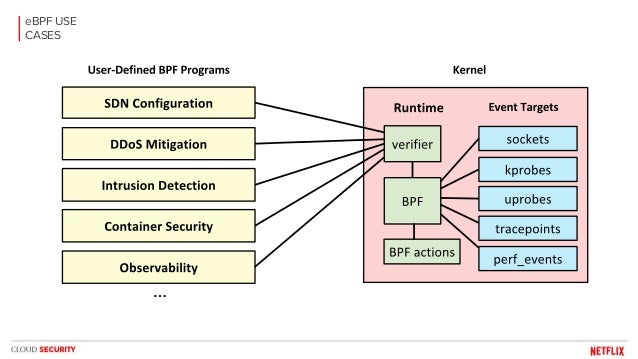
- 11. eBPF USE CASES …
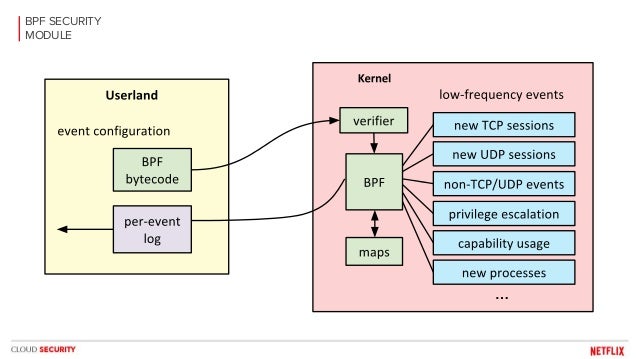
- 12. BPF SECURITY MODULE …
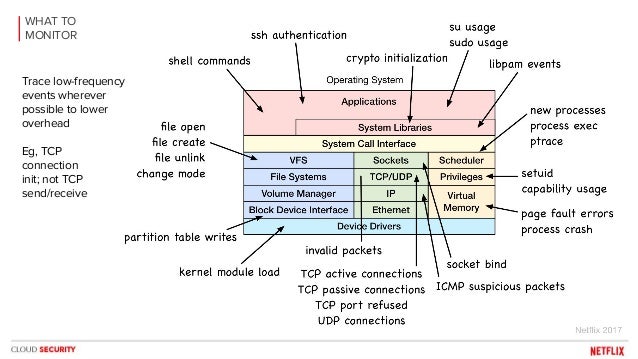
- 13. WHAT TO MONITOR Trace low-frequency events wherever possible to lower overhead Eg, TCP connection init; not TCP send/receive
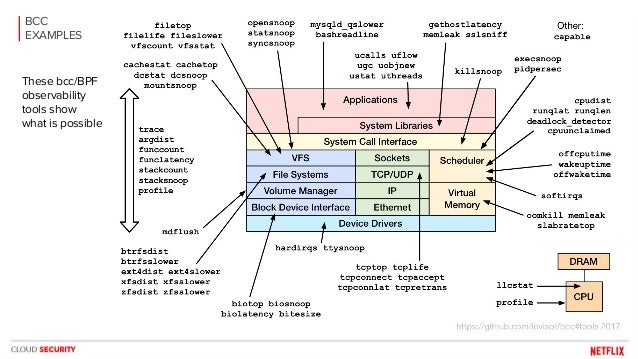
- 14. BCC EXAMPLES These bcc/BPF observability tools show what is possible
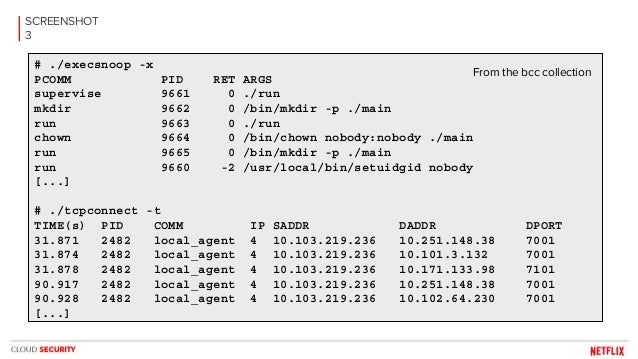
- 15. SCREENSHOT 3 # ./execsnoop -x PCOMM PID RET ARGS supervise 9661 0 ./run mkdir 9662 0 /bin/mkdir -p ./main run 9663 0 ./run chown 9664 0 /bin/chown nobody:nobody ./main run 9665 0 /bin/mkdir -p ./main run 9660 -2 /usr/local/bin/setuidgid nobody [...] # ./tcpconnect -t TIME(s) PID COMM IP SADDR DADDR DPORT 31.871 2482 local_agent 4 10.103.219.236 10.251.148.38 7001 31.874 2482 local_agent 4 10.103.219.236 10.101.3.132 7001 31.878 2482 local_agent 4 10.103.219.236 10.171.133.98 7101 90.917 2482 local_agent 4 10.103.219.236 10.251.148.38 7001 90.928 2482 local_agent 4 10.103.219.236 10.102.64.230 7001 [...] From the bcc collection
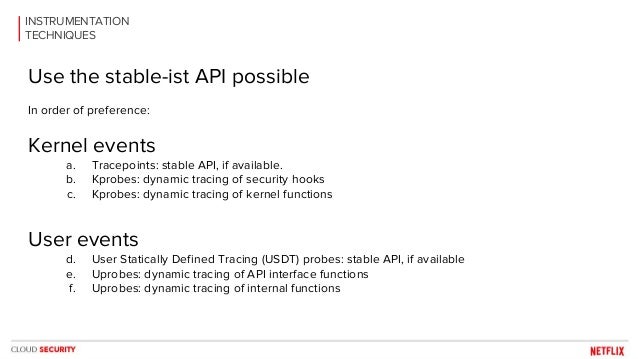
- 16. INSTRUMENTATION TECHNIQUES Use the stable-ist API possible In order of preference: Kernel events a. Tracepoints: stable API, if available. b. Kprobes: dynamic tracing of security hooks c. Kprobes: dynamic tracing of kernel functions User events d. User Statically Defined Tracing (USDT) probes: stable API, if available e. Uprobes: dynamic tracing of API interface functions f. Uprobes: dynamic tracing of internal functions
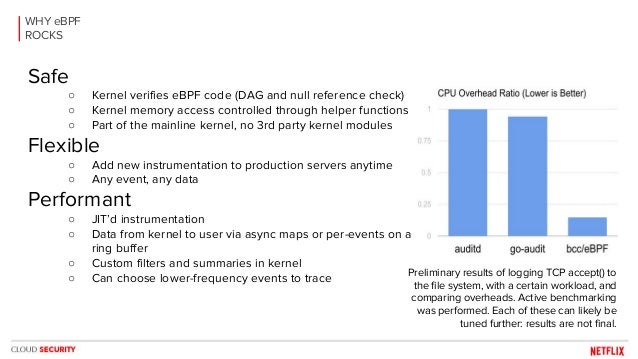
- 17. WHY eBPF ROCKS Safe ○ Kernel verifies eBPF code (DAG and null reference check) ○ Kernel memory access controlled through helper functions ○ Part of the mainline kernel, no 3rd party kernel modules Flexible ○ Add new instrumentation to production servers anytime ○ Any event, any data Performant ○ JIT’d instrumentation ○ Data from kernel to user via async maps or per-events on a ring buffer ○ Custom filters and summaries in kernel ○ Can choose lower-frequency events to trace Preliminary results of logging TCP accept() to the file system, with a certain workload, and comparing overheads. Active benchmarking was performed. Each of these can likely be tuned further: results are not final.
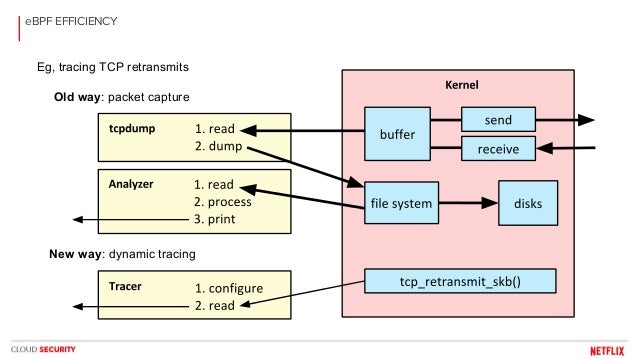
- 18. eBPF EFFICIENCY Old way: packet capture New way: dynamic tracing Eg, tracing TCP retransmits
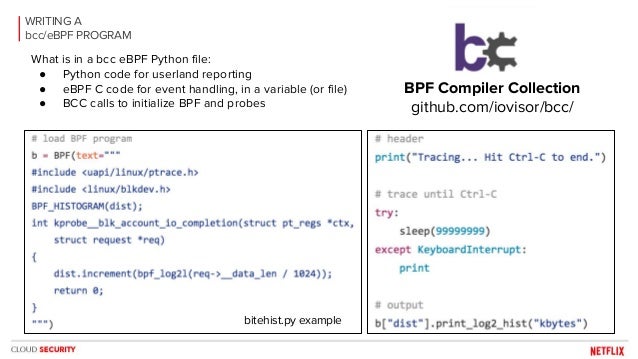
- 19. WRITING A bcc/eBPF PROGRAM BPF Compiler Collection github.com/iovisor/bcc/ What is in a bcc eBPF Python file: ● Python code for userland reporting ● eBPF C code for event handling, in a variable (or file) ● BCC calls to initialize BPF and probes bitehist.py example
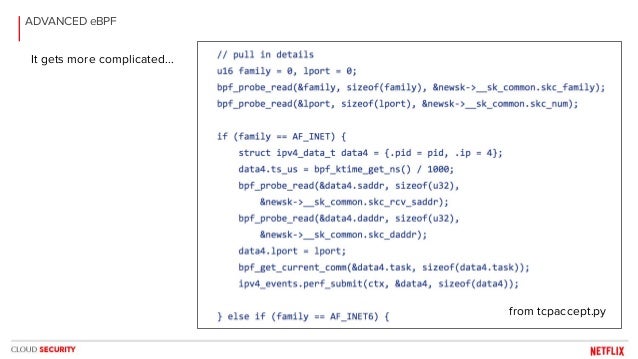
- 20. ADVANCED eBPF It gets more complicated... from tcpaccept.py
- 21. Summary.
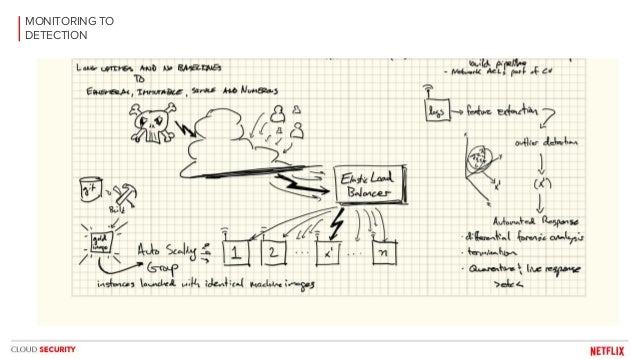
- 22. MONITORING TO DETECTION
- 23. Thank you.
- 24. Bonus round.
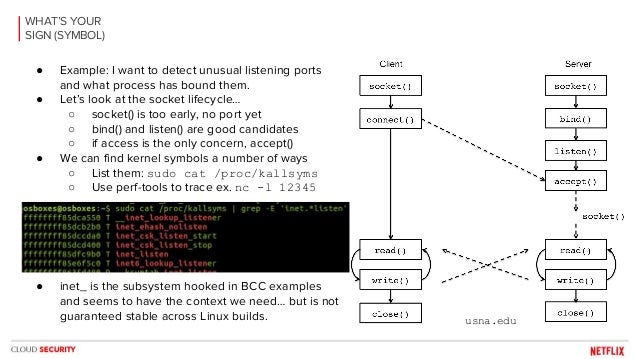
- 25. WHAT’S YOUR SIGN (SYMBOL) ● Example: I want to detect unusual listening ports and what process has bound them. ● Let’s look at the socket lifecycle… ○ socket() is too early, no port yet ○ bind() and listen() are good candidates ○ if access is the only concern, accept() ● We can find kernel symbols a number of ways ○ List them: sudo cat /proc/kallsyms ○ Use perf-tools to trace ex. nc -l 12345 usna.edu ● inet_ is the subsystem hooked in BCC examples and seems to have the context we need… but is not guaranteed stable across Linux builds.
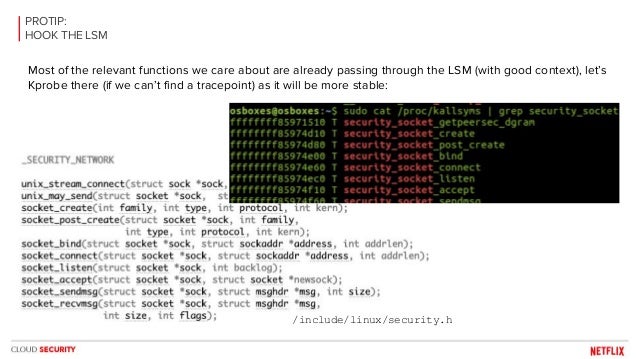
- 26. PROTIP: HOOK THE LSM Most of the relevant functions we care about are already passing through the LSM (with good context), let’s Kprobe there (if we can’t find a tracepoint) as it will be more stable: /include/linux/security.h
- 27. The end end.
Recommend
About Joyk
Aggregate valuable and interesting links.
Joyk means Joy of geeK