
8

Linux 4.x Tracing: Performance Analysis with bcc/BPF
source link: https://www.slideshare.net/brendangregg/linux-4x-tracing-performance-analysis-with-bccbpf
Go to the source link to view the article. You can view the picture content, updated content and better typesetting reading experience. If the link is broken, please click the button below to view the snapshot at that time.
Linux 4.x Tracing: Performance Analysis with bcc/BPF
- 1. Brendan Gregg Senior Performance Architect Mar 2017 Linux 4.x Tracing: Performance Analysis with bcc/BPF
- 2. Linux tracing in the last 3 years…
- 3. How do we use these superpowers?
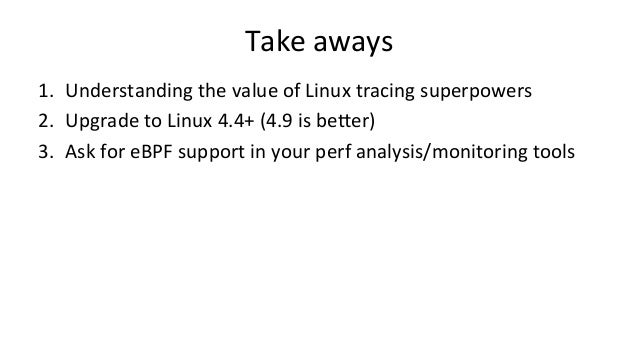
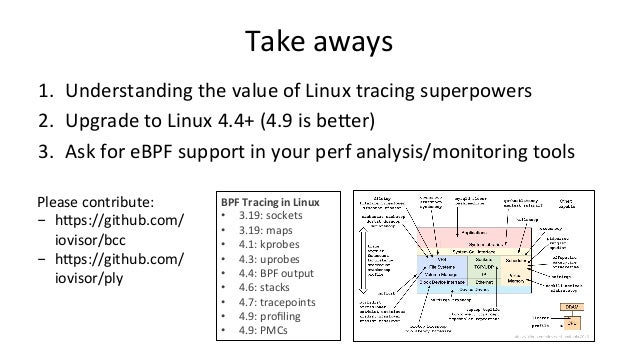
- 4. Take aways 1. Understanding the value of Linux tracing superpowers 2. Upgrade to Linux 4.4+ (4.9 is beDer) 3. Ask for eBPF support in your perf analysis/monitoring tools
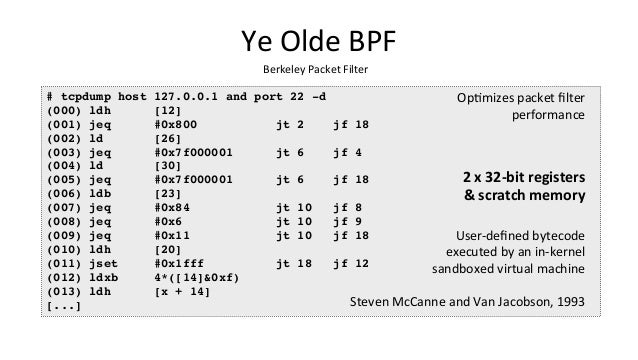
- 5. Ye Olde BPF Berkeley Packet Filter # tcpdump host 127.0.0.1 and port 22 -d (000) ldh [12] (001) jeq #0x800 jt 2 jf 18 (002) ld [26] (003) jeq #0x7f000001 jt 6 jf 4 (004) ld [30] (005) jeq #0x7f000001 jt 6 jf 18 (006) ldb [23] (007) jeq #0x84 jt 10 jf 8 (008) jeq #0x6 jt 10 jf 9 (009) jeq #0x11 jt 10 jf 18 (010) ldh [20] (011) jset #0x1fff jt 18 jf 12 (012) ldxb 4*([14]&0xf) (013) ldh [x + 14] [...] User-defined bytecode executed by an in-kernel sandboxed virtual machine Steven McCanne and Van Jacobson, 1993 2 x 32-bit registers & scratch memory OpVmizes packet filter performance
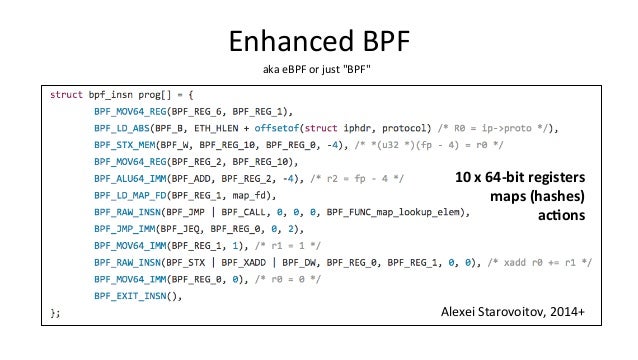
- 6. Enhanced BPF aka eBPF or just "BPF" Alexei Starovoitov, 2014+ 10 x 64-bit registers maps (hashes) acIons
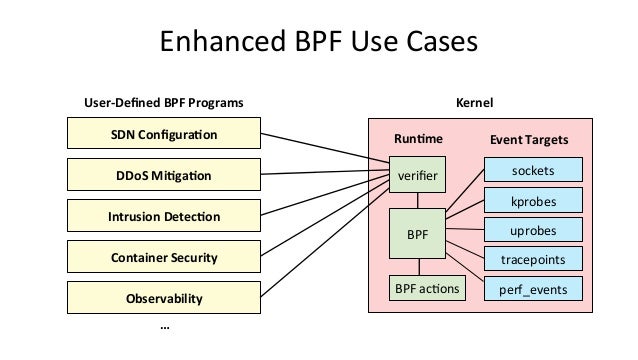
- 7. Enhanced BPF Use Cases Kernel kprobes uprobes tracepoints BPF sockets verifier SDN ConfiguraIon User-Defined BPF Programs DDoS MiIgaIon Intrusion DetecIon Container Security … Event Targets RunIme BPF acVons Observability perf_events
- 8. Enhanced BPF is in Linux
- 9. Demo
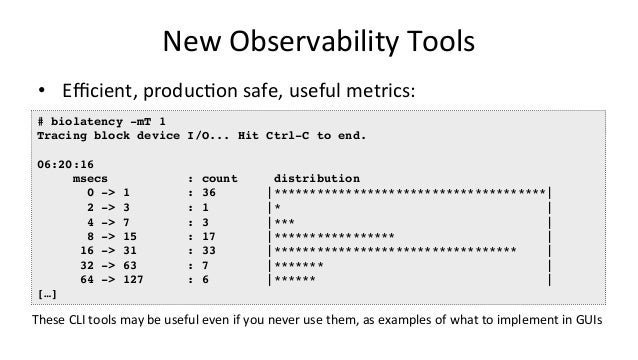
- 10. New Observability Tools • Efficient, producVon safe, useful metrics: # biolatency -mT 1 Tracing block device I/O... Hit Ctrl-C to end. 06:20:16 msecs : count distribution 0 -> 1 : 36 |**************************************| 2 -> 3 : 1 |* | 4 -> 7 : 3 |*** | 8 -> 15 : 17 |***************** | 16 -> 31 : 33 |********************************** | 32 -> 63 : 7 |******* | 64 -> 127 : 6 |****** | […] These CLI tools may be useful even if you never use them, as examples of what to implement in GUIs
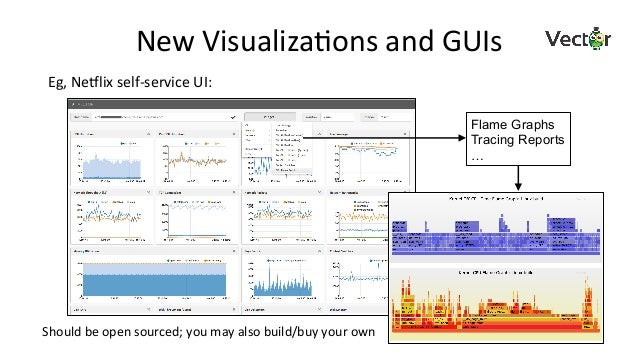
- 11. New VisualizaVons and GUIs Flame Graphs Tracing Reports … Eg, Neclix self-service UI: Should be open sourced; you may also build/buy your own
- 12. BPF TRACING Introducing enhanced BPF
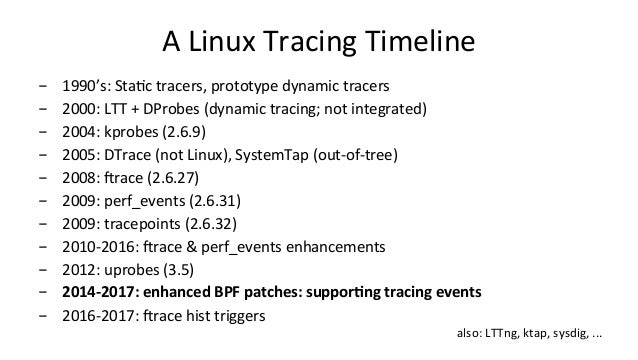
- 13. A Linux Tracing Timeline - 1990’s: StaVc tracers, prototype dynamic tracers - 2000: LTT + DProbes (dynamic tracing; not integrated) - 2004: kprobes (2.6.9) - 2005: DTrace (not Linux), SystemTap (out-of-tree) - 2008: irace (2.6.27) - 2009: perf_events (2.6.31) - 2009: tracepoints (2.6.32) - 2010-2016: irace & perf_events enhancements - 2012: uprobes (3.5) - 2014-2017: enhanced BPF patches: supporIng tracing events - 2016-2017: irace hist triggers also: LTTng, ktap, sysdig, ...
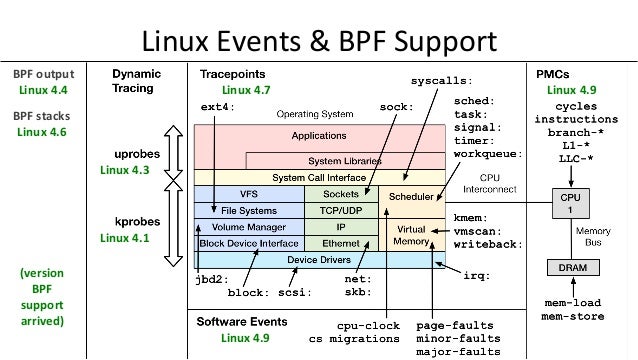
- 14. Linux Events & BPF Support Linux 4.3 Linux 4.7 Linux 4.9 Linux 4.9 Linux 4.1 BPF stacks Linux 4.6 BPF output Linux 4.4 (version BPF support arrived)
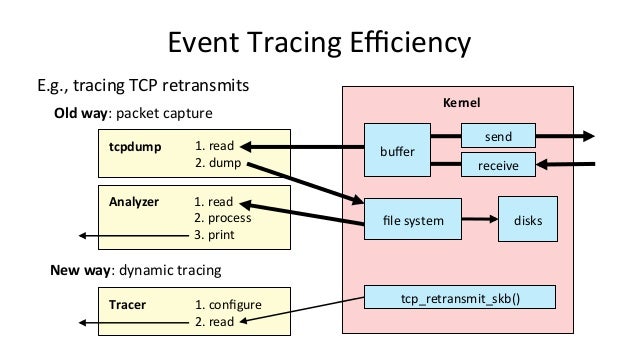
- 15. Event Tracing Efficiency send receive tcpdump Kernel buffer file system 1. read 2. dump Analyzer 1. read 2. process 3. print disks Old way: packet capture New way: dynamic tracing Tracer 1. configure 2. read tcp_retransmit_skb() E.g., tracing TCP retransmits
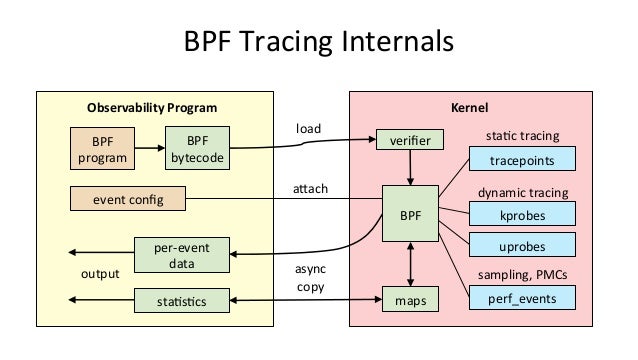
- 16. BPF Tracing Internals BPF bytecode Observability Program Kernel tracepoints kprobes uprobes BPF maps per-event data staVsVcs verifier output staVc tracing dynamic tracing async copy perf_events sampling, PMCs BPF program event config aDach load
- 17. BPF COMPILER COLLECTION Introducing bcc
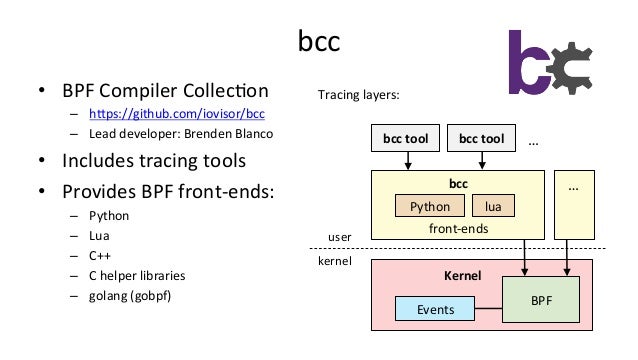
- 18. bcc • BPF Compiler CollecVon – hDps://github.com/iovisor/bcc – Lead developer: Brenden Blanco • Includes tracing tools • Provides BPF front-ends: – Python – Lua – C++ – C helper libraries – golang (gobpf) BPF Python Events Kernel lua bcc front-ends bcc tool bcc tool … … user kernel Tracing layers:
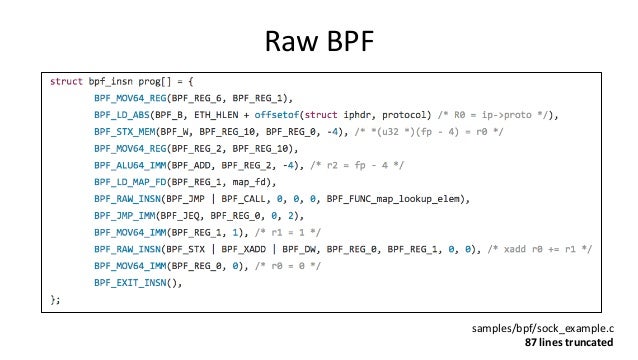
- 19. Raw BPF samples/bpf/sock_example.c 87 lines truncated
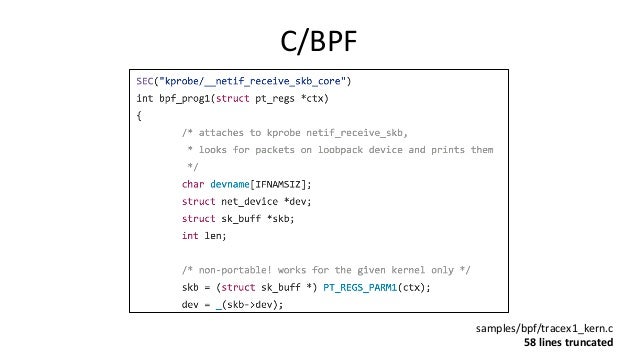
- 20. C/BPF samples/bpf/tracex1_kern.c 58 lines truncated
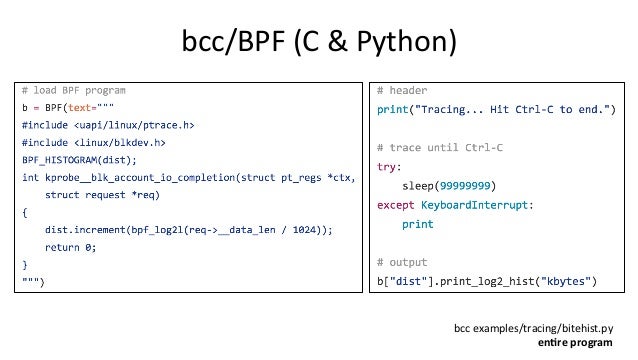
- 21. bcc/BPF (C & Python) bcc examples/tracing/bitehist.py enIre program
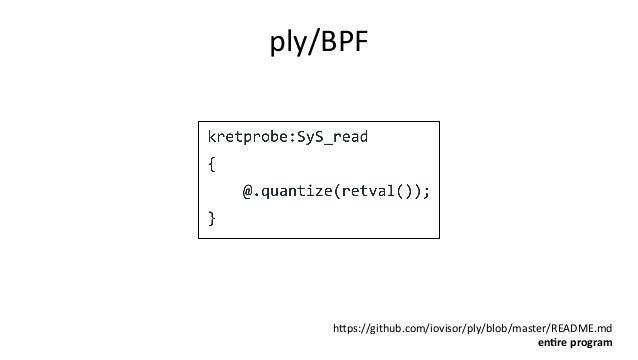
- 22. ply/BPF hDps://github.com/iovisor/ply/blob/master/README.md enIre program
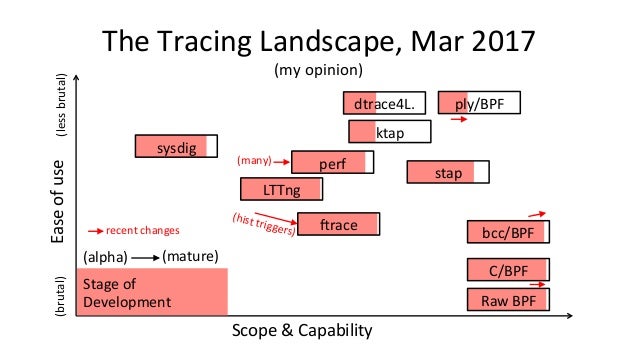
- 23. The Tracing Landscape, Mar 2017 Scope & Capability Ease of use sysdig perf irace C/BPF ktap stap Stage of Development (my opinion) dtrace4L. (brutal) (less brutal) (alpha) (mature) bcc/BPF ply/BPF Raw BPF LTTng (hist triggers) recent changes (many)
- 24. PERFORMANCE ANALYSIS WITH BCC/BPF For end-users
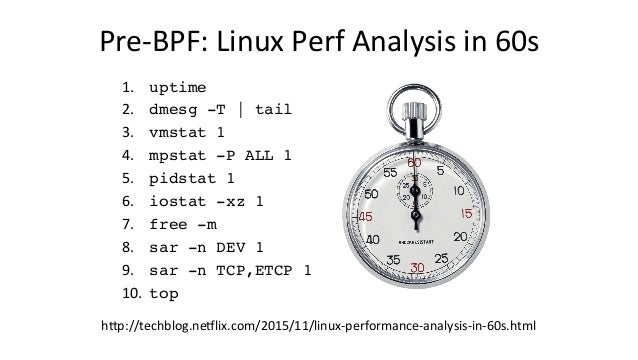
- 25. Pre-BPF: Linux Perf Analysis in 60s 1. uptime 2. dmesg -T | tail 3. vmstat 1 4. mpstat -P ALL 1 5. pidstat 1 6. iostat -xz 1 7. free -m 8. sar -n DEV 1 9. sar -n TCP,ETCP 1 10. top hDp://techblog.neclix.com/2015/11/linux-performance-analysis-in-60s.html
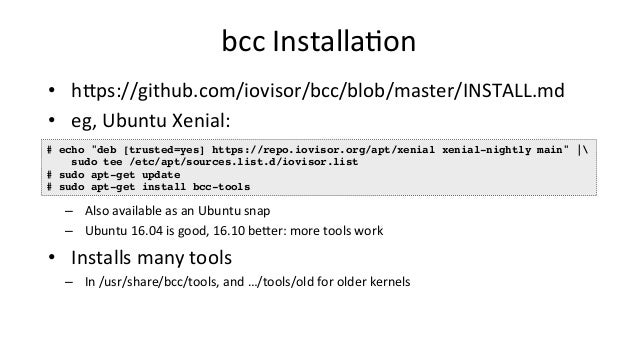
- 26. bcc InstallaVon • hDps://github.com/iovisor/bcc/blob/master/INSTALL.md • eg, Ubuntu Xenial: – Also available as an Ubuntu snap – Ubuntu 16.04 is good, 16.10 beDer: more tools work • Installs many tools – In /usr/share/bcc/tools, and …/tools/old for older kernels # echo "deb [trusted=yes] https://repo.iovisor.org/apt/xenial xenial-nightly main" | sudo tee /etc/apt/sources.list.d/iovisor.list # sudo apt-get update # sudo apt-get install bcc-tools
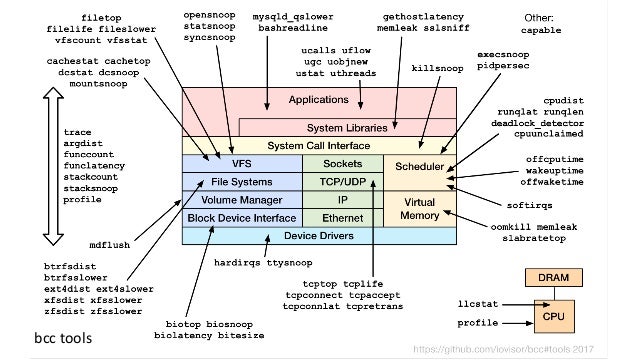
- 27. bcc tools
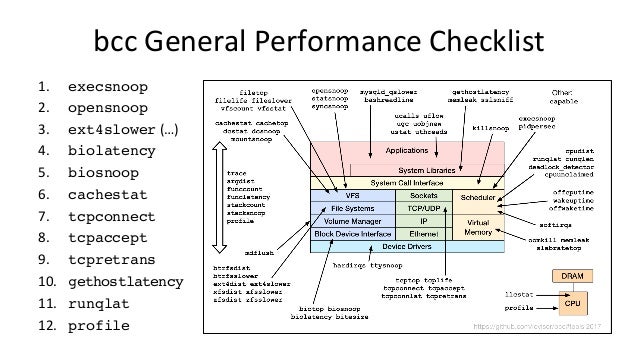
- 28. bcc General Performance Checklist 1. execsnoop 2. opensnoop 3. ext4slower (…) 4. biolatency 5. biosnoop 6. cachestat 7. tcpconnect 8. tcpaccept 9. tcpretrans 10. gethostlatency 11. runqlat 12. profile
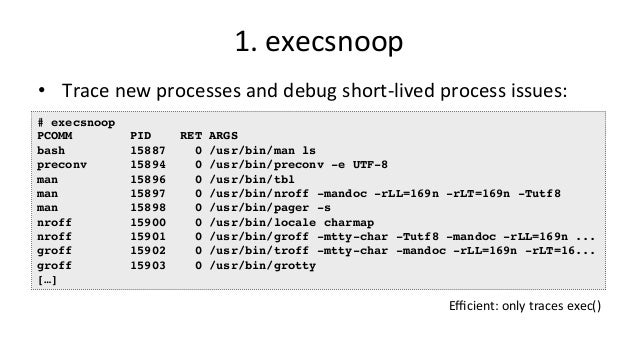
- 29. 1. execsnoop • Trace new processes and debug short-lived process issues: # execsnoop PCOMM PID RET ARGS bash 15887 0 /usr/bin/man ls preconv 15894 0 /usr/bin/preconv -e UTF-8 man 15896 0 /usr/bin/tbl man 15897 0 /usr/bin/nroff -mandoc -rLL=169n -rLT=169n -Tutf8 man 15898 0 /usr/bin/pager -s nroff 15900 0 /usr/bin/locale charmap nroff 15901 0 /usr/bin/groff -mtty-char -Tutf8 -mandoc -rLL=169n ... groff 15902 0 /usr/bin/troff -mtty-char -mandoc -rLL=169n -rLT=16... groff 15903 0 /usr/bin/grotty […] Efficient: only traces exec()
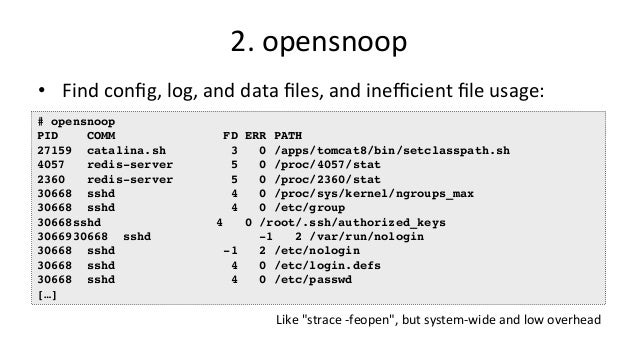
- 30. 2. opensnoop • Find config, log, and data files, and inefficient file usage: # opensnoop PID COMM FD ERR PATH 27159 catalina.sh 3 0 /apps/tomcat8/bin/setclasspath.sh 4057 redis-server 5 0 /proc/4057/stat 2360 redis-server 5 0 /proc/2360/stat 30668 sshd 4 0 /proc/sys/kernel/ngroups_max 30668 sshd 4 0 /etc/group 30668 sshd 4 0 /root/.ssh/authorized_keys 30669 30668 sshd -1 2 /var/run/nologin 30668 sshd -1 2 /etc/nologin 30668 sshd 4 0 /etc/login.defs 30668 sshd 4 0 /etc/passwd […] Like "strace -feopen", but system-wide and low overhead
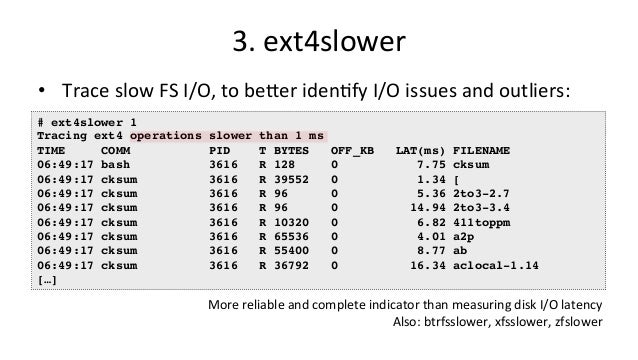
- 31. 3. ext4slower • Trace slow FS I/O, to beDer idenVfy I/O issues and outliers: # ext4slower 1 Tracing ext4 operations slower than 1 ms TIME COMM PID T BYTES OFF_KB LAT(ms) FILENAME 06:49:17 bash 3616 R 128 0 7.75 cksum 06:49:17 cksum 3616 R 39552 0 1.34 [ 06:49:17 cksum 3616 R 96 0 5.36 2to3-2.7 06:49:17 cksum 3616 R 96 0 14.94 2to3-3.4 06:49:17 cksum 3616 R 10320 0 6.82 411toppm 06:49:17 cksum 3616 R 65536 0 4.01 a2p 06:49:17 cksum 3616 R 55400 0 8.77 ab 06:49:17 cksum 3616 R 36792 0 16.34 aclocal-1.14 […] More reliable and complete indicator than measuring disk I/O latency Also: btrfsslower, xfsslower, zfslower
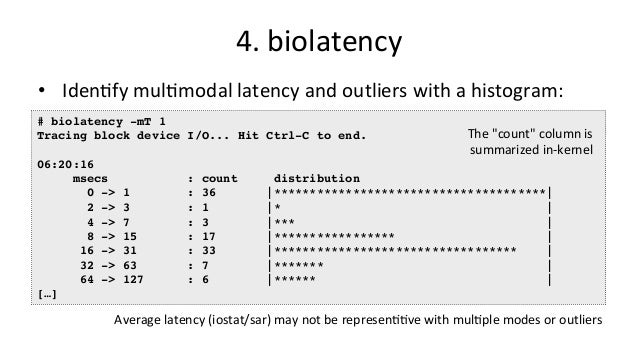
- 32. 4. biolatency • IdenVfy mulVmodal latency and outliers with a histogram: # biolatency -mT 1 Tracing block device I/O... Hit Ctrl-C to end. 06:20:16 msecs : count distribution 0 -> 1 : 36 |**************************************| 2 -> 3 : 1 |* | 4 -> 7 : 3 |*** | 8 -> 15 : 17 |***************** | 16 -> 31 : 33 |********************************** | 32 -> 63 : 7 |******* | 64 -> 127 : 6 |****** | […] Average latency (iostat/sar) may not be represenVVve with mulVple modes or outliers The "count" column is summarized in-kernel
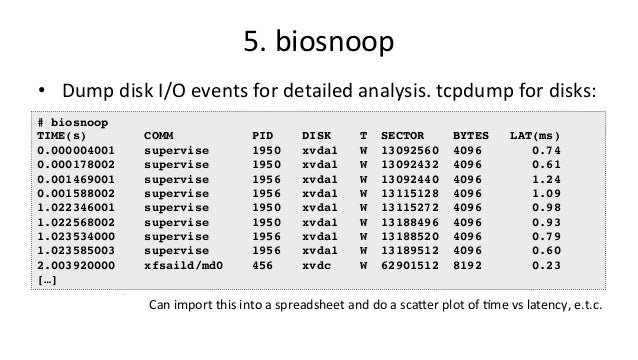
- 33. 5. biosnoop • Dump disk I/O events for detailed analysis. tcpdump for disks: # biosnoop TIME(s) COMM PID DISK T SECTOR BYTES LAT(ms) 0.000004001 supervise 1950 xvda1 W 13092560 4096 0.74 0.000178002 supervise 1950 xvda1 W 13092432 4096 0.61 0.001469001 supervise 1956 xvda1 W 13092440 4096 1.24 0.001588002 supervise 1956 xvda1 W 13115128 4096 1.09 1.022346001 supervise 1950 xvda1 W 13115272 4096 0.98 1.022568002 supervise 1950 xvda1 W 13188496 4096 0.93 1.023534000 supervise 1956 xvda1 W 13188520 4096 0.79 1.023585003 supervise 1956 xvda1 W 13189512 4096 0.60 2.003920000 xfsaild/md0 456 xvdc W 62901512 8192 0.23 […] Can import this into a spreadsheet and do a scaDer plot of Vme vs latency, e.t.c.
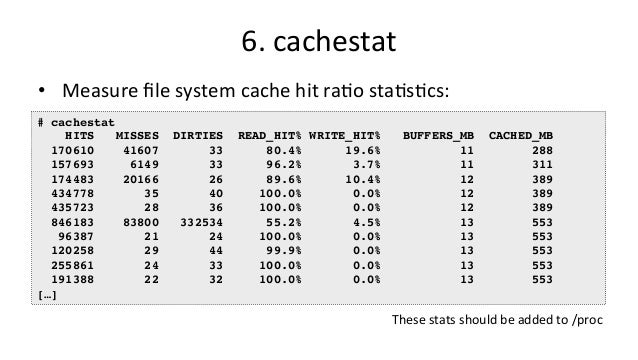
- 34. 6. cachestat • Measure file system cache hit raVo staVsVcs: # cachestat HITS MISSES DIRTIES READ_HIT% WRITE_HIT% BUFFERS_MB CACHED_MB 170610 41607 33 80.4% 19.6% 11 288 157693 6149 33 96.2% 3.7% 11 311 174483 20166 26 89.6% 10.4% 12 389 434778 35 40 100.0% 0.0% 12 389 435723 28 36 100.0% 0.0% 12 389 846183 83800 332534 55.2% 4.5% 13 553 96387 21 24 100.0% 0.0% 13 553 120258 29 44 99.9% 0.0% 13 553 255861 24 33 100.0% 0.0% 13 553 191388 22 32 100.0% 0.0% 13 553 […] These stats should be added to /proc
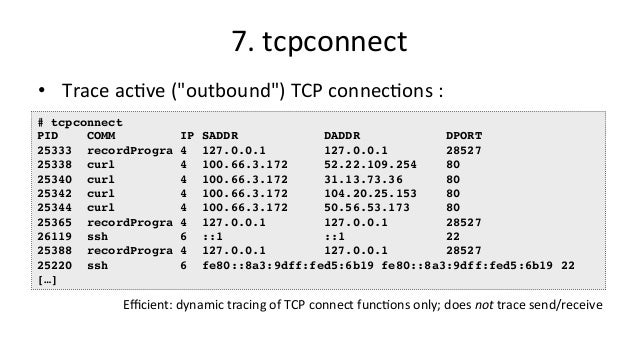
- 35. 7. tcpconnect • Trace acVve ("outbound") TCP connecVons : # tcpconnect PID COMM IP SADDR DADDR DPORT 25333 recordProgra 4 127.0.0.1 127.0.0.1 28527 25338 curl 4 100.66.3.172 52.22.109.254 80 25340 curl 4 100.66.3.172 31.13.73.36 80 25342 curl 4 100.66.3.172 104.20.25.153 80 25344 curl 4 100.66.3.172 50.56.53.173 80 25365 recordProgra 4 127.0.0.1 127.0.0.1 28527 26119 ssh 6 ::1 ::1 22 25388 recordProgra 4 127.0.0.1 127.0.0.1 28527 25220 ssh 6 fe80::8a3:9dff:fed5:6b19 fe80::8a3:9dff:fed5:6b19 22 […] Efficient: dynamic tracing of TCP connect funcVons only; does not trace send/receive
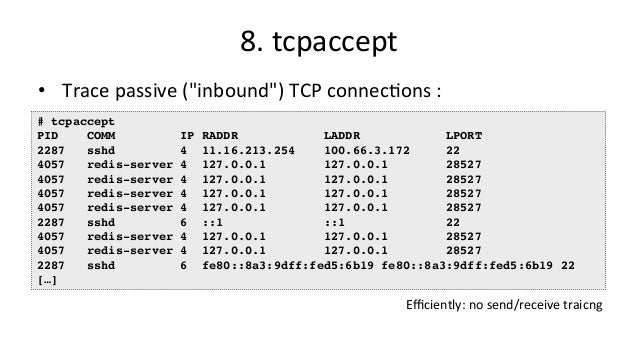
- 36. 8. tcpaccept • Trace passive ("inbound") TCP connecVons : # tcpaccept PID COMM IP RADDR LADDR LPORT 2287 sshd 4 11.16.213.254 100.66.3.172 22 4057 redis-server 4 127.0.0.1 127.0.0.1 28527 4057 redis-server 4 127.0.0.1 127.0.0.1 28527 4057 redis-server 4 127.0.0.1 127.0.0.1 28527 4057 redis-server 4 127.0.0.1 127.0.0.1 28527 2287 sshd 6 ::1 ::1 22 4057 redis-server 4 127.0.0.1 127.0.0.1 28527 4057 redis-server 4 127.0.0.1 127.0.0.1 28527 2287 sshd 6 fe80::8a3:9dff:fed5:6b19 fe80::8a3:9dff:fed5:6b19 22 […] Efficiently: no send/receive traicng
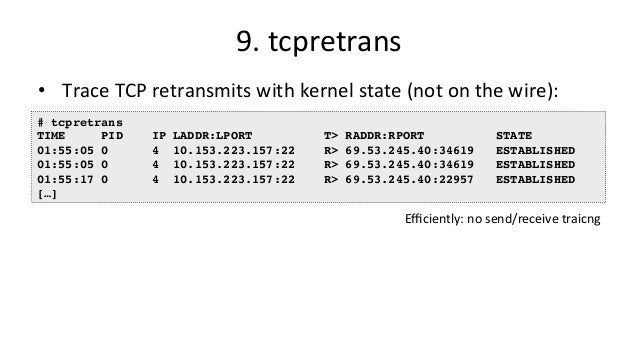
- 37. 9. tcpretrans • Trace TCP retransmits with kernel state (not on the wire): # tcpretrans TIME PID IP LADDR:LPORT T> RADDR:RPORT STATE 01:55:05 0 4 10.153.223.157:22 R> 69.53.245.40:34619 ESTABLISHED 01:55:05 0 4 10.153.223.157:22 R> 69.53.245.40:34619 ESTABLISHED 01:55:17 0 4 10.153.223.157:22 R> 69.53.245.40:22957 ESTABLISHED […] Efficiently: no send/receive traicng
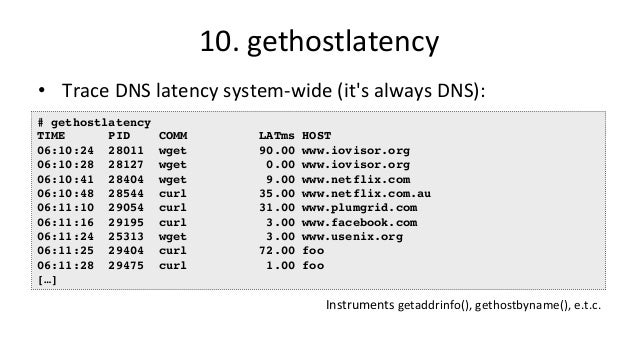
- 38. 10. gethostlatency • Trace DNS latency system-wide (it's always DNS): # gethostlatency TIME PID COMM LATms HOST 06:10:24 28011 wget 90.00 www.iovisor.org 06:10:28 28127 wget 0.00 www.iovisor.org 06:10:41 28404 wget 9.00 www.netflix.com 06:10:48 28544 curl 35.00 www.netflix.com.au 06:11:10 29054 curl 31.00 www.plumgrid.com 06:11:16 29195 curl 3.00 www.facebook.com 06:11:24 25313 wget 3.00 www.usenix.org 06:11:25 29404 curl 72.00 foo 06:11:28 29475 curl 1.00 foo […] Instruments getaddrinfo(), gethostbyname(), e.t.c.
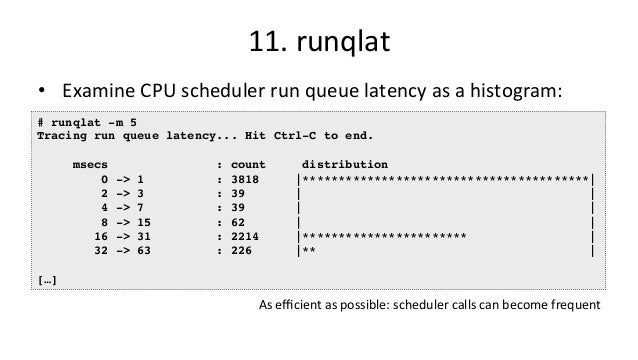
- 39. 11. runqlat • Examine CPU scheduler run queue latency as a histogram: # runqlat -m 5 Tracing run queue latency... Hit Ctrl-C to end. msecs : count distribution 0 -> 1 : 3818 |****************************************| 2 -> 3 : 39 | | 4 -> 7 : 39 | | 8 -> 15 : 62 | | 16 -> 31 : 2214 |*********************** | 32 -> 63 : 226 |** | […] As efficient as possible: scheduler calls can become frequent
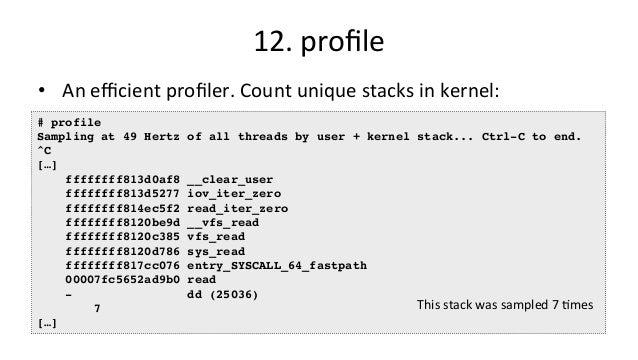
- 40. 12. profile • An efficient profiler. Count unique stacks in kernel: # profile Sampling at 49 Hertz of all threads by user + kernel stack... Ctrl-C to end. ^C […] ffffffff813d0af8 __clear_user ffffffff813d5277 iov_iter_zero ffffffff814ec5f2 read_iter_zero ffffffff8120be9d __vfs_read ffffffff8120c385 vfs_read ffffffff8120d786 sys_read ffffffff817cc076 entry_SYSCALL_64_fastpath 00007fc5652ad9b0 read - dd (25036) 7 […] This stack was sampled 7 Vmes
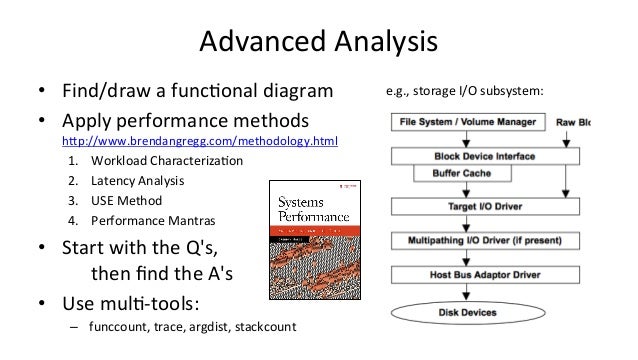
- 41. Advanced Analysis • Find/draw a funcVonal diagram • Apply performance methods hDp://www.brendangregg.com/methodology.html 1. Workload CharacterizaVon 2. Latency Analysis 3. USE Method 4. Performance Mantras • Start with the Q's, then find the A's • Use mulV-tools: – funccount, trace, argdist, stackcount e.g., storage I/O subsystem:
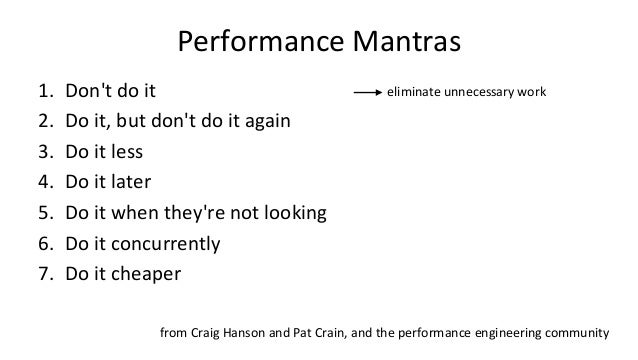
- 42. Performance Mantras 1. Don't do it 2. Do it, but don't do it again 3. Do it less 4. Do it later 5. Do it when they're not looking 6. Do it concurrently 7. Do it cheaper eliminate unnecessary work from Craig Hanson and Pat Crain, and the performance engineering community
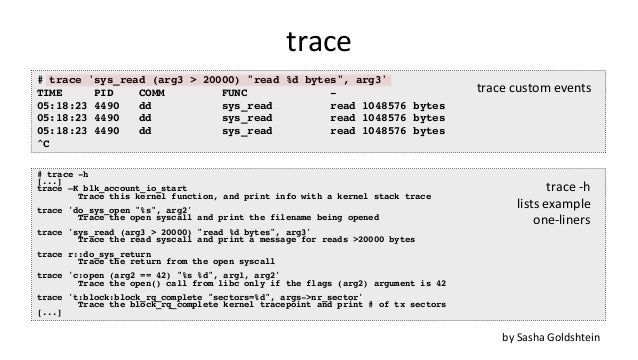
- 43. trace # trace 'sys_read (arg3 > 20000) "read %d bytes", arg3' TIME PID COMM FUNC - 05:18:23 4490 dd sys_read read 1048576 bytes 05:18:23 4490 dd sys_read read 1048576 bytes 05:18:23 4490 dd sys_read read 1048576 bytes ^C by Sasha Goldshtein # trace -h [...] trace –K blk_account_io_start Trace this kernel function, and print info with a kernel stack trace trace 'do_sys_open "%s", arg2' Trace the open syscall and print the filename being opened trace 'sys_read (arg3 > 20000) "read %d bytes", arg3' Trace the read syscall and print a message for reads >20000 bytes trace r::do_sys_return Trace the return from the open syscall trace 'c:open (arg2 == 42) "%s %d", arg1, arg2' Trace the open() call from libc only if the flags (arg2) argument is 42 trace 't:block:block_rq_complete "sectors=%d", args->nr_sector' Trace the block_rq_complete kernel tracepoint and print # of tx sectors [...] trace -h lists example one-liners trace custom events
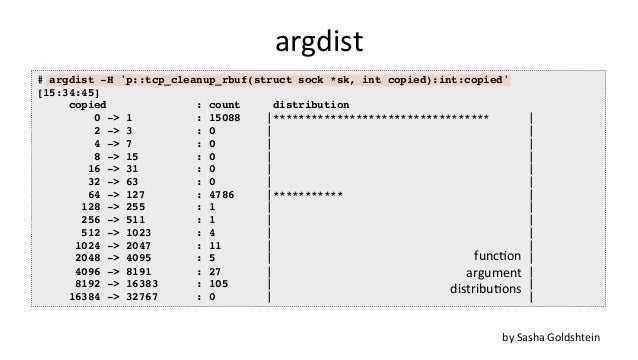
- 44. argdist # argdist -H 'p::tcp_cleanup_rbuf(struct sock *sk, int copied):int:copied' [15:34:45] copied : count distribution 0 -> 1 : 15088 |********************************** | 2 -> 3 : 0 | | 4 -> 7 : 0 | | 8 -> 15 : 0 | | 16 -> 31 : 0 | | 32 -> 63 : 0 | | 64 -> 127 : 4786 |*********** | 128 -> 255 : 1 | | 256 -> 511 : 1 | | 512 -> 1023 : 4 | | 1024 -> 2047 : 11 | | 2048 -> 4095 : 5 | | 4096 -> 8191 : 27 | | 8192 -> 16383 : 105 | | 16384 -> 32767 : 0 | | by Sasha Goldshtein funcVon argument distribuVons
- 45. BCC/BPF VISUALIZATIONS Coming to a GUI near you
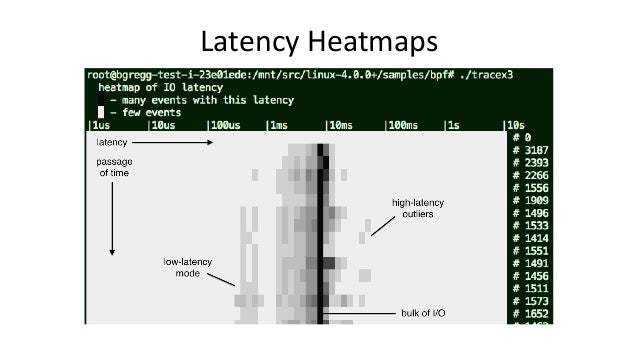
- 46. Latency Heatmaps
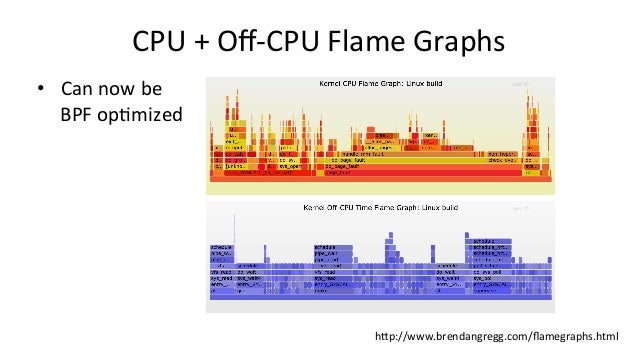
- 47. CPU + Off-CPU Flame Graphs hDp://www.brendangregg.com/flamegraphs.html • Can now be BPF opVmized
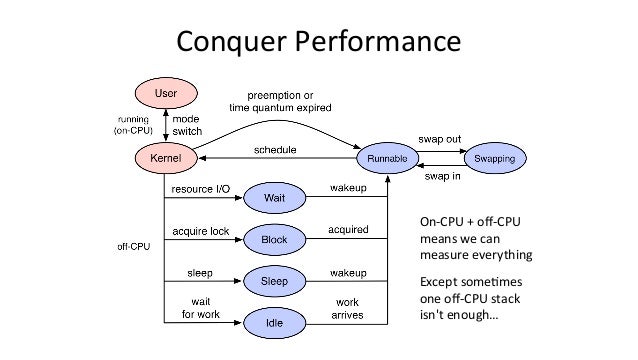
- 48. Conquer Performance On-CPU + off-CPU means we can measure everything Except someVmes one off-CPU stack isn't enough…
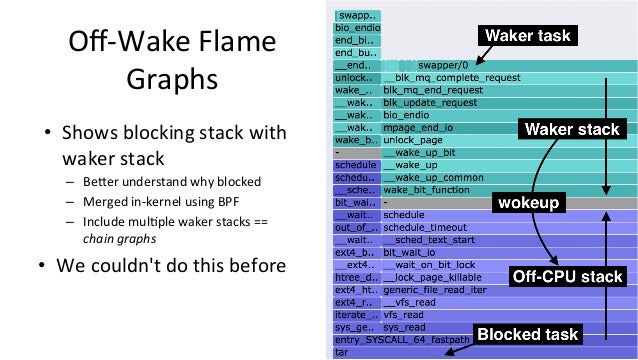
- 49. Off-Wake Flame Graphs • Shows blocking stack with waker stack – BeDer understand why blocked – Merged in-kernel using BPF – Include mulVple waker stacks == chain graphs • We couldn't do this before
- 50. HOW TO PROGRAM BCC/BPF Overview for tool developers
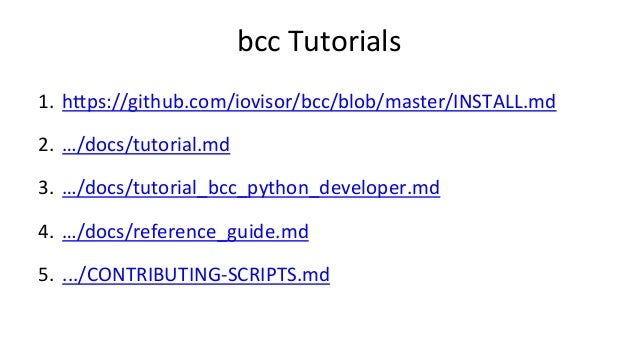
- 51. bcc Tutorials 1. hDps://github.com/iovisor/bcc/blob/master/INSTALL.md 2. …/docs/tutorial.md 3. …/docs/tutorial_bcc_python_developer.md 4. …/docs/reference_guide.md 5. .../CONTRIBUTING-SCRIPTS.md
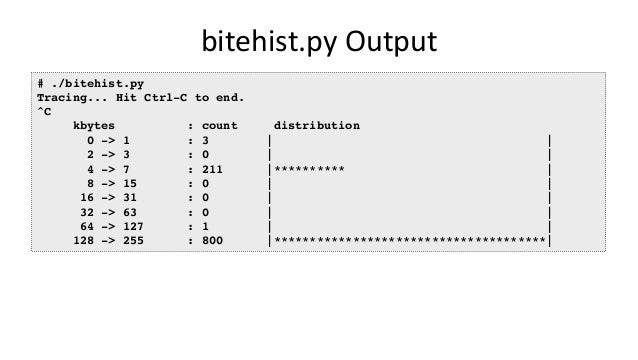
- 52. bitehist.py Output # ./bitehist.py Tracing... Hit Ctrl-C to end. ^C kbytes : count distribution 0 -> 1 : 3 | | 2 -> 3 : 0 | | 4 -> 7 : 211 |********** | 8 -> 15 : 0 | | 16 -> 31 : 0 | | 32 -> 63 : 0 | | 64 -> 127 : 1 | | 128 -> 255 : 800 |**************************************|
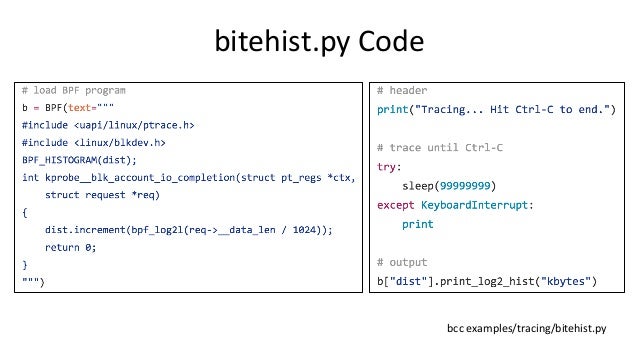
- 53. bitehist.py Code bcc examples/tracing/bitehist.py
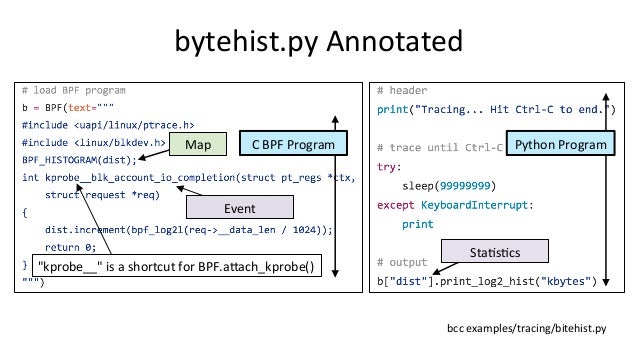
- 54. bytehist.py Annotated bcc examples/tracing/bitehist.py C BPF Program Python Program Map StaVsVcs "kprobe__" is a shortcut for BPF.aDach_kprobe() Event
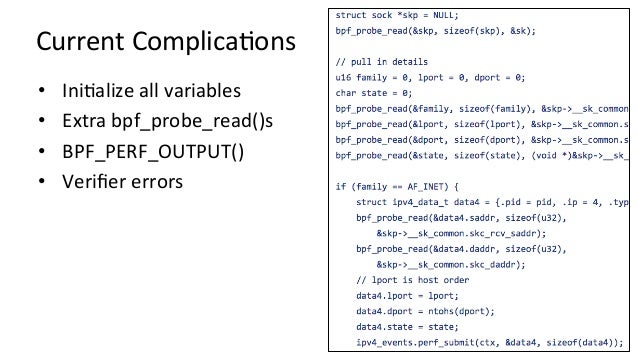
- 55. Current ComplicaVons • IniValize all variables • Extra bpf_probe_read()s • BPF_PERF_OUTPUT() • Verifier errors
- 56. PLY Bonus Round
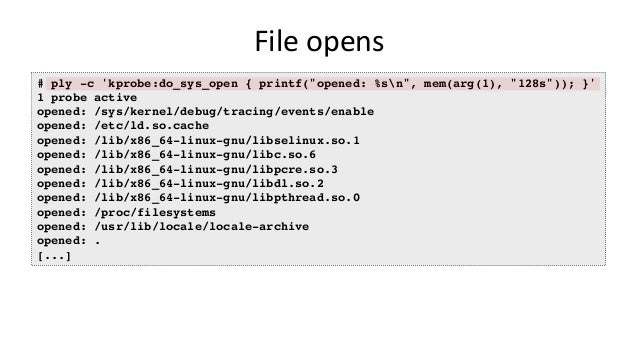
- 57. File opens # ply -c 'kprobe:do_sys_open { printf("opened: %sn", mem(arg(1), "128s")); }' 1 probe active opened: /sys/kernel/debug/tracing/events/enable opened: /etc/ld.so.cache opened: /lib/x86_64-linux-gnu/libselinux.so.1 opened: /lib/x86_64-linux-gnu/libc.so.6 opened: /lib/x86_64-linux-gnu/libpcre.so.3 opened: /lib/x86_64-linux-gnu/libdl.so.2 opened: /lib/x86_64-linux-gnu/libpthread.so.0 opened: /proc/filesystems opened: /usr/lib/locale/locale-archive opened: . [...]
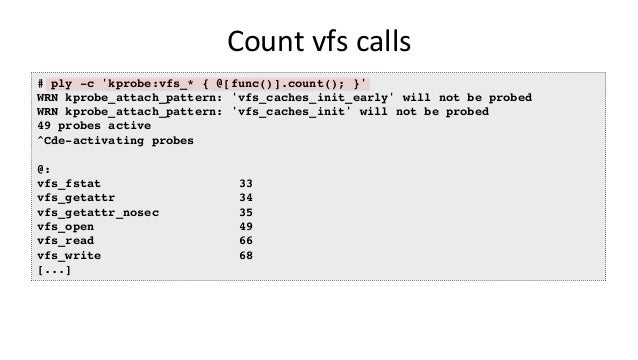
- 58. Count vfs calls # ply -c 'kprobe:vfs_* { @[func()].count(); }' WRN kprobe_attach_pattern: 'vfs_caches_init_early' will not be probed WRN kprobe_attach_pattern: 'vfs_caches_init' will not be probed 49 probes active ^Cde-activating probes @: vfs_fstat 33 vfs_getattr 34 vfs_getattr_nosec 35 vfs_open 49 vfs_read 66 vfs_write 68 [...]
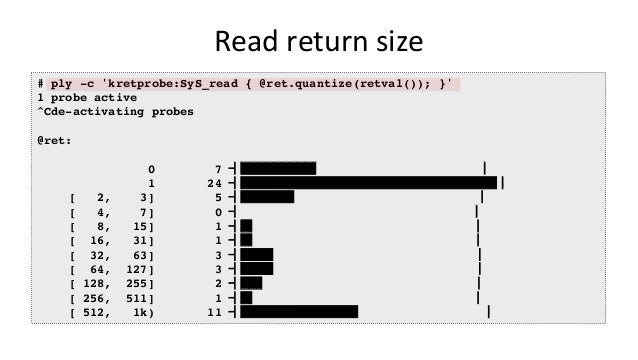
- 59. Read return size # ply -c 'kretprobe:SyS_read { @ret.quantize(retval()); }' 1 probe active ^Cde-activating probes @ret: 0 7 1 24 [ 2, 3] 5 [ 4, 7] 0 [ 8, 15] 1 [ 16, 31] 1 [ 32, 63] 3 [ 64, 127] 3 [ 128, 255] 2 [ 256, 511] 1 [ 512, 1k) 11
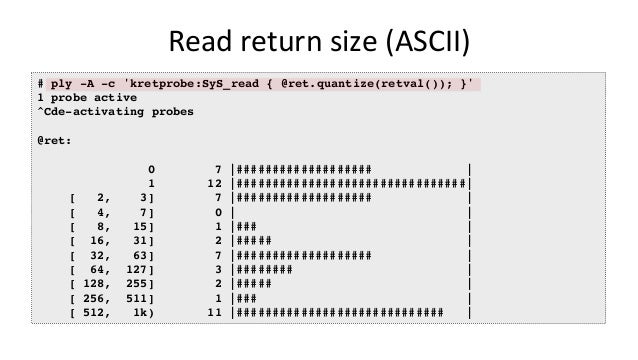
- 60. Read return size (ASCII) # ply -A -c 'kretprobe:SyS_read { @ret.quantize(retval()); }' 1 probe active ^Cde-activating probes @ret: 0 7 |################### | 1 12 |################################| [ 2, 3] 7 |################### | [ 4, 7] 0 | | [ 8, 15] 1 |### | [ 16, 31] 2 |##### | [ 32, 63] 7 |################### | [ 64, 127] 3 |######## | [ 128, 255] 2 |##### | [ 256, 511] 1 |### | [ 512, 1k) 11 |############################# |
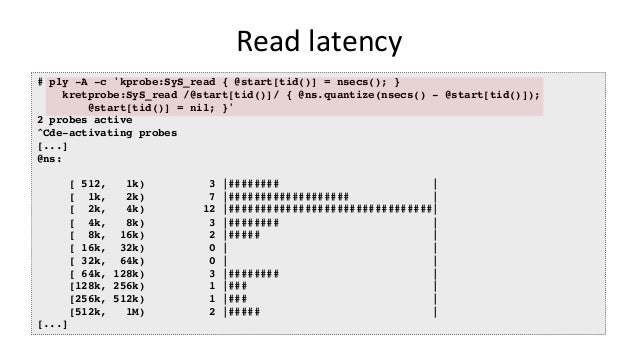
- 61. Read latency # ply -A -c 'kprobe:SyS_read { @start[tid()] = nsecs(); } kretprobe:SyS_read /@start[tid()]/ { @ns.quantize(nsecs() - @start[tid()]); @start[tid()] = nil; }' 2 probes active ^Cde-activating probes [...] @ns: [ 512, 1k) 3 |######## | [ 1k, 2k) 7 |################### | [ 2k, 4k) 12 |################################| [ 4k, 8k) 3 |######## | [ 8k, 16k) 2 |##### | [ 16k, 32k) 0 | | [ 32k, 64k) 0 | | [ 64k, 128k) 3 |######## | [128k, 256k) 1 |### | [256k, 512k) 1 |### | [512k, 1M) 2 |##### | [...]
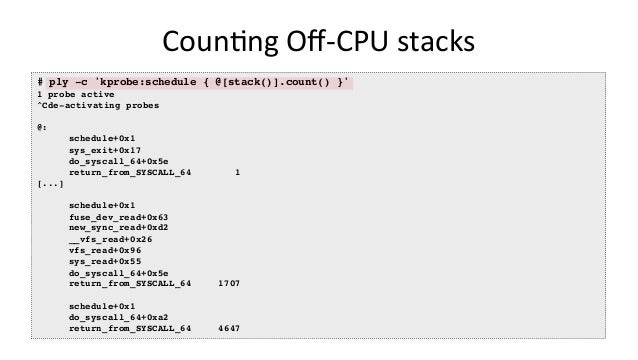
- 62. CounVng Off-CPU stacks # ply -c 'kprobe:schedule { @[stack()].count() }' 1 probe active ^Cde-activating probes @: schedule+0x1 sys_exit+0x17 do_syscall_64+0x5e return_from_SYSCALL_64 1 [...] schedule+0x1 fuse_dev_read+0x63 new_sync_read+0xd2 __vfs_read+0x26 vfs_read+0x96 sys_read+0x55 do_syscall_64+0x5e return_from_SYSCALL_64 1707 schedule+0x1 do_syscall_64+0xa2 return_from_SYSCALL_64 4647
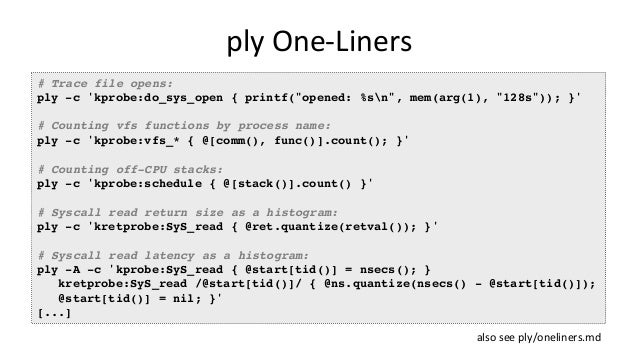
- 63. ply One-Liners # Trace file opens: ply -c 'kprobe:do_sys_open { printf("opened: %sn", mem(arg(1), "128s")); }' # Counting vfs functions by process name: ply -c 'kprobe:vfs_* { @[comm(), func()].count(); }' # Counting off-CPU stacks: ply -c 'kprobe:schedule { @[stack()].count() }' # Syscall read return size as a histogram: ply -c 'kretprobe:SyS_read { @ret.quantize(retval()); }' # Syscall read latency as a histogram: ply -A -c 'kprobe:SyS_read { @start[tid()] = nsecs(); } kretprobe:SyS_read /@start[tid()]/ { @ns.quantize(nsecs() - @start[tid()]); @start[tid()] = nil; }' [...] also see ply/oneliners.md
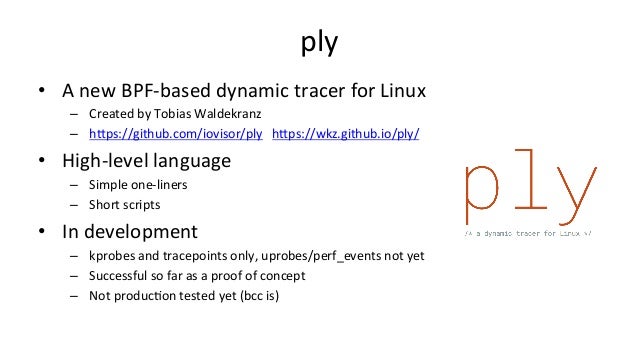
- 64. ply • A new BPF-based dynamic tracer for Linux – Created by Tobias Waldekranz – hDps://github.com/iovisor/ply hDps://wkz.github.io/ply/ • High-level language – Simple one-liners – Short scripts • In development – kprobes and tracepoints only, uprobes/perf_events not yet – Successful so far as a proof of concept – Not producVon tested yet (bcc is)
- 65. CHALLENGES Future work
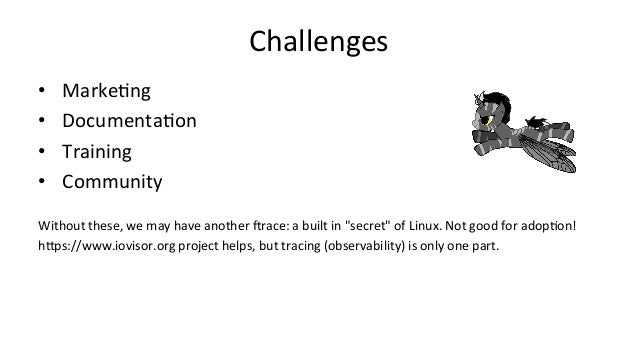
- 66. Challenges • MarkeVng • DocumentaVon • Training • Community Without these, we may have another irace: a built in "secret" of Linux. Not good for adopVon! hDps://www.iovisor.org project helps, but tracing (observability) is only one part.
- 67. Take aways 1. Understanding the value of Linux tracing superpowers 2. Upgrade to Linux 4.4+ (4.9 is beDer) 3. Ask for eBPF support in your perf analysis/monitoring tools BPF Tracing in Linux • 3.19: sockets • 3.19: maps • 4.1: kprobes • 4.3: uprobes • 4.4: BPF output • 4.6: stacks • 4.7: tracepoints • 4.9: profiling • 4.9: PMCs Please contribute: - hDps://github.com/ iovisor/bcc - hDps://github.com/ iovisor/ply
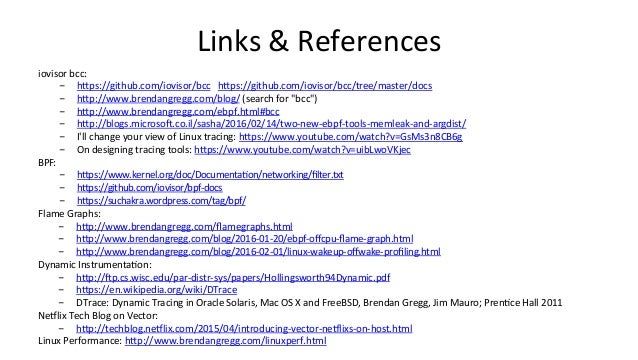
- 68. Links & References iovisor bcc: - hDps://github.com/iovisor/bcc hDps://github.com/iovisor/bcc/tree/master/docs - hDp://www.brendangregg.com/blog/ (search for "bcc") - hDp://www.brendangregg.com/ebpf.html#bcc - hDp://blogs.microsoi.co.il/sasha/2016/02/14/two-new-ebpf-tools-memleak-and-argdist/ - I'll change your view of Linux tracing: hDps://www.youtube.com/watch?v=GsMs3n8CB6g - On designing tracing tools: hDps://www.youtube.com/watch?v=uibLwoVKjec BPF: - hDps://www.kernel.org/doc/DocumentaVon/networking/filter.txt - hDps://github.com/iovisor/bpf-docs - hDps://suchakra.wordpress.com/tag/bpf/ Flame Graphs: - hDp://www.brendangregg.com/flamegraphs.html - hDp://www.brendangregg.com/blog/2016-01-20/ebpf-offcpu-flame-graph.html - hDp://www.brendangregg.com/blog/2016-02-01/linux-wakeup-offwake-profiling.html Dynamic InstrumentaVon: - hDp://ip.cs.wisc.edu/par-distr-sys/papers/Hollingsworth94Dynamic.pdf - hDps://en.wikipedia.org/wiki/DTrace - DTrace: Dynamic Tracing in Oracle Solaris, Mac OS X and FreeBSD, Brendan Gregg, Jim Mauro; PrenVce Hall 2011 Neclix Tech Blog on Vector: - hDp://techblog.neclix.com/2015/04/introducing-vector-neclixs-on-host.html Linux Performance: hDp://www.brendangregg.com/linuxperf.html
- 69. Thanks – QuesVons? – iovisor bcc: hDps://github.com/iovisor/bcc – hDp://www.brendangregg.com – hDp://slideshare.net/brendangregg – [email protected] – @brendangregg Thanks to Alexei Starovoitov (Facebook), Brenden Blanco (PLUMgrid/ VMware), Sasha Goldshtein (Sela), Daniel Borkmann (Cisco), Wang Nan (Huawei), and other BPF and bcc contributors!
Recommend
About Joyk
Aggregate valuable and interesting links.
Joyk means Joy of geeK