

kube-prometheus搭建
source link: https://www.bboy.app/2021/08/05/kube-prometheus%E6%90%AD%E5%BB%BA/
Go to the source link to view the article. You can view the picture content, updated content and better typesetting reading experience. If the link is broken, please click the button below to view the snapshot at that time.

之前搞过prometheus去监控家里的一些服务,但是因为一些原因,比如nas的断线,或者主机突然断线会造成监控数据不完整,而且单节点的prometheus横向扩容会不太方便,虽然我本地没有特别多值得监控的地方,所以就想着使用prometheus加thanos去监控本地的服务,最主要就是加了thanos
kube-prometheus帮助我们解决了挺多问题的,一个就是告警规则,相对于k8s的告警规则其实做的比较完善,我们就没有必要想着怎么去做规则了,还有就是prometheus,alertmanager都是高可用的,减少了挂掉的风险,搭建部署也比较方便把,如果你操作过一次之后
需要监控的地方
- 所有主机的基本信息
- 树莓派温度
介绍下thanos几个组件
其实只要知道thanos组件的用处就好了,其他的可以忽略,二进制部署的时候都是同一个二进制文件,只不过启动的命令不一样而已
还有就是记住官方的架构图https://thanos.io/tip/thanos/quick-tutorial.md/这样可以清楚知道各个组件作用
- query 查询组件使用grpc协议从storeapi去读取指标数据,并且对外暴露一个查询api,之后grafana中填写的地址就是query组件查询api地址
- sidecar sidecar组件如果你是二进制部署的话就需要部署到和prometheus一个主机节点,或者说可以读取到prometheus数据文件的节点中,因为sidecar有两个功能,一个是上传数据到对象存储,另外一个是暴露一个grpc接口,来让如query组件去查询他的数据,值得注意的是上传到对象存储不是实时上传的默认两小时上传一次,当然你也可以配置prometheus的参数
--storage.tsdb.min-block-duration and --storage.tsdb.max-block-duration来修改上传时间,具体的可以看https://thanos.io/tip/components/sidecar.md/
The --storage.tsdb.min-block-duration and --storage.tsdb.max-block-duration must be set to equal values to disable local compaction on order to use Thanos sidecar upload, otherwise leave local compaction on if sidecar just exposes StoreAPI and your retention is normal. The default of 2h is recommended. Mentioned parameters set to equal values disable the internal Prometheus compaction, which is needed to avoid the uploaded data corruption when Thanos compactor does its job, this is critical for data consistency and should not be ignored if you plan to use Thanos compactor. Even though you set mentioned parameters equal, you might observe Prometheus internal metric prometheus_tsdb_compactions_total being incremented, don’t be confused by that: Prometheus writes initial head block to filesystem via its internal compaction mechanism, but if you have followed recommendations - data won’t be modified by Prometheus before the sidecar uploads it. Thanos sidecar will also check sanity of the flags set to Prometheus on the startup and log errors or warning if they have been configured improperly (#838).
- store store组件是用来读取对象存储中的数据的,因为sidecar不是实时上传数据的,所以到时候和query组件对接的话需要sidecar和store两个组件
- 其他的比如compactor ruler就没啥可说的了,我也不是特别需要
安装kube-prometheus
下载kube-prometheus
wget https://github.com/prometheus-operator/kube-prometheus/archive/refs/tags/v0.8.0.zip
注意自己的k8s版本和对应的kube-prometheus版本
unzip v0.8.0.zip
创建crd等
kubectl create -f manifests/setup
kubectl create -f manifests/
之后就是修改镜像为本地的镜像,这样当集群重启或者什么的就不用去外部去拉取了
还有就是注意prometheus-operator-deployment.yaml中
- --prometheus-config-reloader=registry.bboysoul.cn/prometheus-operator/prometheus-config-reloader:v0.47.0
也需要修改
接着把prometheus和grafana的svc改为loadbalancer
vim grafana-service.yaml
加入 type: LoadBalancer
vim prometheus-service.yaml
type: LoadBalancer
访问prometheus的时候会发现有三个告警
一个是Watchdog这个是始终保持告警状态的,可以不用理
另外两个一个是KubeControllerManagerDown 还有一个是KubeSchedulerDown
KubeControllerManagerDown是因为没有创建KubeControllerManager的svc
vim KubeControllerManager-svc.yaml
apiVersion: v1
kind: Service
metadata:
  name: kube-controller-manager
  namespace: kube-system
  labels:
    app.kubernetes.io/name: kube-controller-manager
spec:
  selector:
    component: kube-controller-manager
  ports:
  - port: 10257
    targetPort: 10257
    name: https-metrics
KubeSchedulerDown 也是一样的原因
vim KubeScheduler-svc.yaml
apiVersion: v1
kind: Service
metadata:
  name: kube-scheduler
  namespace: kube-system
  labels:
    app.kubernetes.io/name: kube-scheduler
spec:
  selector:
    component: kube-scheduler
  ports:
  - port: 10259
    targetPort: 10259
    name: https-metrics
具体这个svc要打什么label要selector什么label可以看
kubernetes-serviceMonitorKubeScheduler.yaml
kubernetes-serviceMonitorKubeControllerManager.yaml
这两个文件
部署thanos sidecar
详细可以看https://prometheus-operator.dev/docs/operator/thanos/
在prometheus-prometheus.yaml中spec下加入
thanos:
  baseImage: quay.io/thanos/thanos
  version: v0.8.1
  objectStorageConfig:
    key: thanos.yaml
    name: thanos-objstore-config
接着配置对象存储我这里使用的是minio,当然你可以直接使用volume挂载到本地,然后把数据放到本地,但是这样可能会造成一些问题,推荐使用minio去做存储网关
type: s3
config:
  bucket: thanos
  endpoint: ams3.digitaloceanspaces.com
  access_key: XXX
  secret_key: XXX
创建sec
kubectl -n monitoring create secret generic thanos-objstore-config --from-file=./thanos-config.yaml
之后重新apply,sidecar就自动安装好了
部署thanos query
之后部署thanos query组件
clone 下面这个项目
git clone https://github.com/thanos-io/kube-thanos.git
kubectl create ns thanos
cd manifests
修改thanos-query-deployment.yaml的store参数,如果显示没有找到的话可以直接找个prometheus 然后看他的hosts就可以了
- --store=dnssrv+_grpc._tcp.prometheus-operated.monitoring.svc.cluster.local
之后apply query 相关的部分
thanos-query-deployment.yamlthanos-query-serviceAccount.yamlthanos-query-serviceMonitor.yamlthanos-query-service.yaml
值得注意的是默认prometheus不会监控其他namespace的服务,你需要修改
prometheus-roleConfig.yaml
prometheus-roleBindingConfig.yaml
因为他们使用的是role和RoleBinding,为了简单我直接把prometheus-k8s这个ServiceAccount改为ClusterRole这样就不受ns的限制了
prometheus-roleBindingConfig.yaml
apiVersion: rbac.authorization.k8s.io/v1
kind: ClusterRoleBinding
metadata:
  labels:
    app.kubernetes.io/component: prometheus
    app.kubernetes.io/name: prometheus
    app.kubernetes.io/part-of: kube-prometheus
    app.kubernetes.io/version: 2.26.0
  name: prometheus-k8s-config
roleRef:
  apiGroup: rbac.authorization.k8s.io
  kind: ClusterRole
  name: prometheus-k8s-config
subjects:
- kind: ServiceAccount
  name: prometheus-k8s
  namespace: monitoring
prometheus-roleConfig.yaml
apiVersion: rbac.authorization.k8s.io/v1
kind: ClusterRole
metadata:
  labels:
    app.kubernetes.io/component: prometheus
    app.kubernetes.io/name: prometheus
    app.kubernetes.io/part-of: kube-prometheus
    app.kubernetes.io/version: 2.26.0
  name: prometheus-k8s-config
rules:
- apiGroups:
  - ""
  resources:
  - configmaps

- services
  - endpoints
  - pods


  verbs:
  - get
  - list
  - watch
之后去prometheus web页面就可以看到thanos-query的监控了
部署thanos store
store负责从对象存储读取数据
OBJSTORE_CONFIG
- name: OBJSTORE_CONFIG
  valueFrom:
    secretKeyRef:
      key: thanos.yaml
      name: thanos-objstore-config
所以我们要在thaos上创建相同的sec
type: s3
config:
  bucket: thanos
  endpoint: ams3.digitaloceanspaces.com
  access_key: XXX
  secret_key: XXX
kubectl -n thanos create secret generic thanos-objstore-config --from-file=thanos.yaml=./thanos-config.yaml
之后在thanos-store-statefulSet.yaml尾部添加
storageClassName: "managed-nfs-storage"
来自动创建pv
继续配置query
- --store=dnssrv+_grpc._tcp.thanos-store.thanos.svc.cluster.local
grafana数据持久化
首先添加pvc
apiVersion: v1
kind: PersistentVolumeClaim
metadata:
    name: grafana-pvc
    namespace: monitoring
spec:
  accessModes:
  - ReadWriteOnce
  resources:
    requests:
      storage: 10Gi
  storageClassName: managed-nfs-storage
之后把grafana-deployment.yaml中
#- emptyDir: {}
#  name: grafana-storage
- name: grafana-storage
  persistentVolumeClaim:
    claimName: grafana-pvc
添加额外的配置
因为我还有一些集群外部的监控项目,比如树莓派的温度什么的,所以就直接添加额外的配置文件了
详细的可以看下面
https://github.com/prometheus-operator/prometheus-operator/blob/master/Documentation/additional-scrape-config.md
在prometheus-prometheus.yaml添加
additionalScrapeConfigs:
  name: additional-scrape-configs
  key: prometheus-additional.yaml
之后使用额外的配置文件创建一个secret
- job_name: "other-hosts"
  static_configs:
  - targets: ["10.10.100.5:9100"]
    labels:
      instance: '10.10.100.5'
  static_configs:
  - targets: ["10.10.100.41:9100"]
    labels:
      instance: '10.10.100.41'
创建sec
kubectl create secret generic additional-scrape-configs --from-file=prometheus-additional.yaml --dry-run -oyaml > additional-scrape-configs.yaml
apply一下
kubectl apply -f additional-scrape-configs.yaml
之后applyprometheus-prometheus.yaml
kubectl apply -f prometheus-prometheus.yaml
部署PrometheusAlert
PrometheusAlert是一个很好用的运维告警中心消息转发系统
https://github.com/feiyu563/PrometheusAlert/releases
大家可以下载
wget https://github.com/feiyu563/PrometheusAlert/releases/download/v4.5.0/kubernetes.zip
修改配置文件对应的选项来部署
修改alertmanager
修改alertmanager-secret.yaml
"receiver": "Default"
"receiver": "web.hook.prometheusalert"
receivers下添加
- name: 'web.hook.prometheusalert'
  webhook_configs:
  - url: 'http://[prometheusalert_url]:8080/prometheus/alert'
重新apply
kubectl apply -f alertmanager-secret.yaml
添加自定义告警规则
比如温度到55度告警
prometheus-prometheusRule.yaml
- alert: RpiTempHot
  annotations:
    description: (instance {{ $labels.instance }}) temperature is greater than 55 degrees
    summary: Raspberry Pi temperature is greater than 55 degrees
  expr: Temputrue > 55
  for: 10m
  labels:
    severity: critical
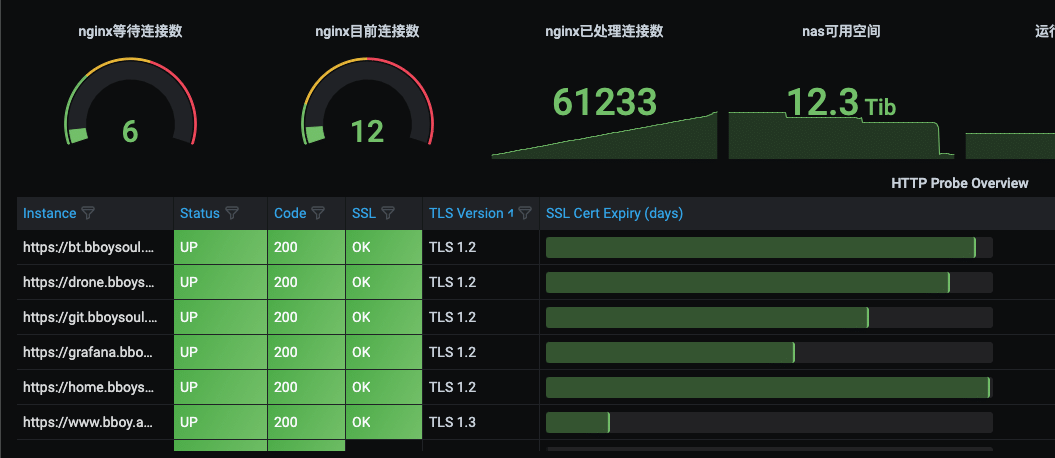
监控一些url
之后使用probe资源去监控url
apiVersion: monitoring.coreos.com/v1
kind: Probe
metadata:
  name: blackbox-exporter
  namespace: monitoring
spec:
  jobName: http-get
  interval: 60s
  module: http_2xx
  prober:
    url: blackbox-exporter.monitoring.svc:19115
    scheme: http
    path: /probe
  targets:
    staticConfig:
      static:
      - http://www.baidu.com
关于operator的一些其他的用处可以看下面
https://github.com/prometheus-operator/prometheus-operator/blob/master/Documentation/api.md#prometheusspec
欢迎关注我的博客www.bboy.app
Have Fun
Recommend
-
47
Kube-Scheduler 主要工作是为需要运行的 Pod 选择合适的 Node,从阶段上讲分为两个阶段: 预选 Predicates 挑选出符合调度条件的 Node 列表 优选 Prioritizing 从已...
-
14
kube-prometheus监控集群外部主机 发表于 2021-05-27...
-
6
V2EX › Kubernetes kube-prometheus-0.7 部署出错问题求助 ice2016 · 20 小时 11 分钟前 · 294...
-
8
Prometheus kube-state-metrics 监控指标介绍 兰玉磊 • 3天前 • 其他 • 阅读 33Deployment
-
6
使用 kube-vip 搭建高可用 Kubernetes 集群-阳明的博客|Kubernetes|Istio|Prometheus|Python|Golang|云原生 https://unsplash.com/photos/QsgE8vzTTSo kube-vip 可以在你的控制平...
-
6
Prometheus监控K8S--通过kube-prometheus 原创 清风明月li 2022-04-21 22:18:11...
-
13
使用 kube-prometheus 安装的 prometheus 只会监控 default kube-system monitoring(kube-prometheus 自己创建的ns)三个命名空间,而如果想要...
-
9
Kube-prometheus grafana安装插件和grafana-image-renderer 原创 清风明月li
-
5
Monitoring of each Kubernetes component is very important, and Calico is not exception. Today I learned that Calico provides capabilities to export Prometheus metrics out of the box. However,
-
8
Kube-prometheus 监控 K8s 集群外服务的两种方式 精选 原创 liubin0505star 2...
About Joyk
Aggregate valuable and interesting links.
Joyk means Joy of geeK