

kube-prometheus监控集群外部主机
source link: https://www.bboy.app/2021/05/27/kube-prometheus%E7%9B%91%E6%8E%A7%E9%9B%86%E7%BE%A4%E5%A4%96%E9%83%A8%E4%B8%BB%E6%9C%BA/
Go to the source link to view the article. You can view the picture content, updated content and better typesetting reading experience. If the link is broken, please click the button below to view the snapshot at that time.
kube-prometheus监控集群外部主机
发表于
2021-05-27 分类于 kubernetes
家里的k8s使用的是kube-prometheus监控的,除了kube-prometheus外,家里还有一套使用docker搭建的prometheus来监控k8s集群外部的主机,最近想整合下,让kube-prometheus也可以去监控其他的集群外部的主机和监控项目
网上有的人是创建endpoint,然后使用serviceMonitor去监控的,也就是说如果我有100台主机,那么就要创建100个serviceMonitor,这显然不是最佳做法,百度了一下发现prometheus可以添加额外的配置文件,详细的可以看下面
https://github.com/prometheus-operator/prometheus-operator/blob/master/Documentation/additional-scrape-config.md
那么思路就有了,在additional-scrape-config里面添加job,然后使用file_sd去发现主机就可以了,而file直接创建成configmap挂载到容器里面,之后添加新的监控主机的话直接修改configmap就可以了
添加下面这些就好
# 挂载配置
  volumes:
  - name: prometheus-external-node-exporter-hosts-cm
    configMap:
      name: prometheus-external-node-exporter-hosts-cm
  - name: prometheus-external-temp-cm
    configMap:
      name: prometheus-external-temp-cm
  - name: prometheus-external-windows-cm
    configMap:
      name: prometheus-external-windows-cm
  volumeMounts:
  - name: prometheus-external-node-exporter-hosts-cm
    mountPath: "/hosts"
    readOnly: true
  - name: prometheus-external-temp-cm
    mountPath: "/temp"
    readOnly: true
  - name: prometheus-external-windows-cm
    mountPath: "/windows"
    readOnly: true
# 额外的配置
  additionalScrapeConfigs:
    name: additional-scrape-configs
    key: prometheus-additional.yaml
我mount了3个configmap分别对应3个job 树莓派温度job linux主机监控job windows主机监控job
之后就是生成additional-scrape-configs这个secret
首先编辑prometheus-additional.yaml
- job_name: 'node-exporter'
  file_sd_configs:
    - files: ['/hosts/hosts.yaml']
      refresh_interval: 5s
- job_name: 'traefik'
  static_configs:
  - targets: ['10.10.100.17:8082']
- job_name: 'rpi_temp'
  file_sd_configs:
    - files: ['/temp/temp.yaml']
      refresh_interval: 5s
- job_name: 'tplink'
  static_configs:
  - targets: ['10.10.100.17:8212']
- job_name: 'windows'
  file_sd_configs:
    - files: ['/windows/windows.yaml']
      refresh_interval: 5s
添加了需要添加的job
之后创建secret
kubectl create secret generic additional-scrape-configs --from-file=prometheus-additional.yaml --dry-run -oyaml -n monitoring > additional-scrape-configs.yaml
apply一下
kubectl apply -f additional-scrape-configs.yaml
之后创建我们的configmap
下面是我的配置
- targets: ['10.10.100.10:9100']
  labels:
    instance: 10.10.100.10
- targets: ['10.10.100.11:9100']
  labels:
    instance: 10.10.100.11
- targets: ['10.10.100.12:9100']
  labels:
    instance: 10.10.100.12
- targets: ['10.10.100.13:9100']
  labels:
    instance: 10.10.100.13
kubectl create cm prometheus-external-node-exporter-hosts-cm --from-file=hosts.yaml --dry-run -o yaml -n monitoring > prometheus-external-node-exporter-hosts-cm.yaml
apply下
kubectl apply -f prometheus-external-node-exporter-hosts-cm.yaml
还有blackbox监控项目
我还监控了一些url
这个我就直接使用probe资源就好了
apiVersion: monitoring.coreos.com/v1
kind: Probe
metadata:
  name: blackbox-exporter
  namespace: monitoring
spec:
  jobName: http-get
  interval: 60s
  module: http_2xx
  prober:
    url: blackbox-exporter.monitoring.svc:19115
    scheme: http
    path: /probe
  targets:
    staticConfig:
      static:
      - https://www.baidu.com
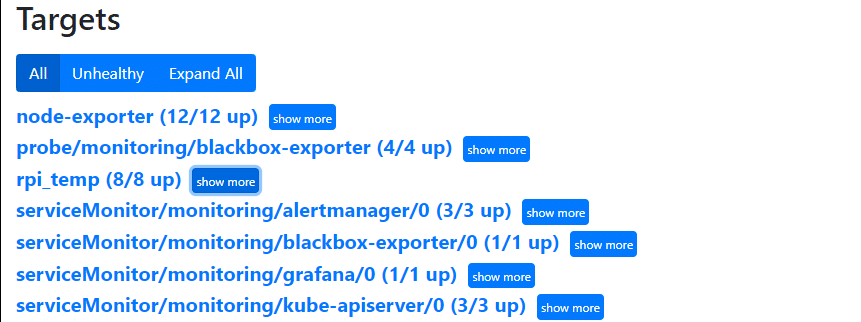
之后看下prometheus里面是不是添加了这些监控项目就好了
欢迎关注我的博客www.bboy.app
Have Fun
Recommend
About Joyk
Aggregate valuable and interesting links.
Joyk means Joy of geeK