
1

【Isomap】理论与实现
source link: https://www.guofei.site/2017/12/20/Isomap.html
Go to the source link to view the article. You can view the picture content, updated content and better typesetting reading experience. If the link is broken, please click the button below to view the snapshot at that time.
【Isomap】理论与实现
2017年12月20日Author: Guofei
文章归类: 3-1-降维 ,文章编号: 322
版权声明:本文作者是郭飞。转载随意,但需要标明原文链接,并通知本人
原文链接:https://www.guofei.site/2017/12/20/Isomap.html
简介
Isomap算法是在MDS算法的基础上衍生出的一种算法,MDS算法是保持降维后的样本间距离不变,Isomap算法引进了邻域图,样本只与其相邻的样本连接,他们之间的距离可直接计算,较远的点可通过最小路径算出距离,在此基础上进行降维保距。
from time import time
import matplotlib.pyplot as plt
from mpl_toolkits.mplot3d import Axes3D
from matplotlib.ticker import NullFormatter
from sklearn import manifold, datasets
# Next line to silence pyflakes. This import is needed.
Axes3D
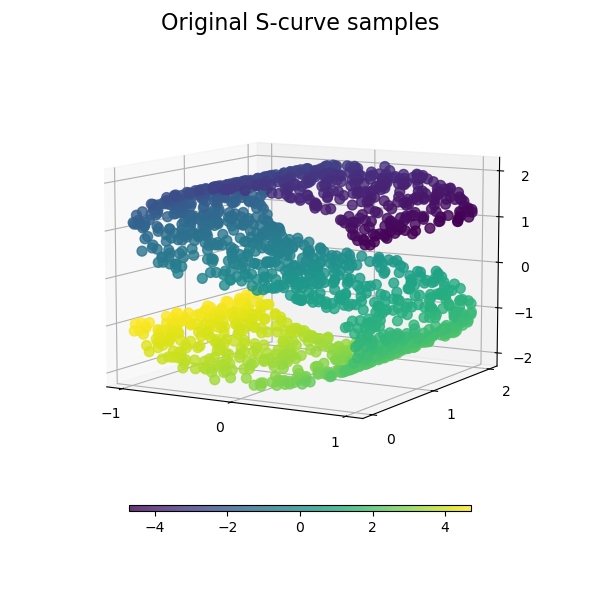
n_points = 1000
X, color = datasets.samples_generator.make_s_curve(n_points, random_state=0)
n_neighbors = 10
n_components = 2
fig = plt.figure(figsize=(15, 8))
plt.suptitle("Manifold Learning with %i points, %i neighbors"
% (1000, n_neighbors), fontsize=14)
ax = fig.add_subplot(251, projection='3d')
ax.scatter(X[:, 0], X[:, 1], X[:, 2], c=color, cmap=plt.cm.Spectral)
ax.view_init(4, -72)
methods = ['standard', 'ltsa', 'hessian', 'modified']
labels = ['LLE', 'LTSA', 'Hessian LLE', 'Modified LLE']
for i, method in enumerate(methods):
t0 = time()
Y = manifold.LocallyLinearEmbedding(n_neighbors, n_components,
eigen_solver='auto',
method=method).fit_transform(X)
t1 = time()
print("%s: %.2g sec" % (methods[i], t1 - t0))
ax = fig.add_subplot(252 + i)
plt.scatter(Y[:, 0], Y[:, 1], c=color, cmap=plt.cm.Spectral)
plt.title("%s (%.2g sec)" % (labels[i], t1 - t0))
ax.xaxis.set_major_formatter(NullFormatter())
ax.yaxis.set_major_formatter(NullFormatter())
plt.axis('tight')
t0 = time()
Y = manifold.Isomap(n_neighbors, n_components).fit_transform(X)
t1 = time()
print("Isomap: %.2g sec" % (t1 - t0))
ax = fig.add_subplot(257)
plt.scatter(Y[:, 0], Y[:, 1], c=color, cmap=plt.cm.Spectral)
plt.title("Isomap (%.2g sec)" % (t1 - t0))
ax.xaxis.set_major_formatter(NullFormatter())
ax.yaxis.set_major_formatter(NullFormatter())
plt.axis('tight')
t0 = time()
mds = manifold.MDS(n_components, max_iter=100, n_init=1)
Y = mds.fit_transform(X)
t1 = time()
print("MDS: %.2g sec" % (t1 - t0))
ax = fig.add_subplot(258)
plt.scatter(Y[:, 0], Y[:, 1], c=color, cmap=plt.cm.Spectral)
plt.title("MDS (%.2g sec)" % (t1 - t0))
ax.xaxis.set_major_formatter(NullFormatter())
ax.yaxis.set_major_formatter(NullFormatter())
plt.axis('tight')
t0 = time()
se = manifold.SpectralEmbedding(n_components=n_components,
n_neighbors=n_neighbors)
Y = se.fit_transform(X)
t1 = time()
print("SpectralEmbedding: %.2g sec" % (t1 - t0))
ax = fig.add_subplot(259)
plt.scatter(Y[:, 0], Y[:, 1], c=color, cmap=plt.cm.Spectral)
plt.title("SpectralEmbedding (%.2g sec)" % (t1 - t0))
ax.xaxis.set_major_formatter(NullFormatter())
ax.yaxis.set_major_formatter(NullFormatter())
plt.axis('tight')
t0 = time()
tsne = manifold.TSNE(n_components=n_components, init='pca', random_state=0)
Y = tsne.fit_transform(X)
t1 = time()
print("t-SNE: %.2g sec" % (t1 - t0))
ax = fig.add_subplot(2, 5, 10)
plt.scatter(Y[:, 0], Y[:, 1], c=color, cmap=plt.cm.Spectral)
plt.title("t-SNE (%.2g sec)" % (t1 - t0))
ax.xaxis.set_major_formatter(NullFormatter())
ax.yaxis.set_major_formatter(NullFormatter())
plt.axis('tight')
plt.show()
参考文献
http://blog.csdn.net/zhangweiguo_717/article/details/69802312
您的支持将鼓励我继续创作!
Recommend
About Joyk
Aggregate valuable and interesting links.
Joyk means Joy of geeK