
11

使用Calc进行线性拟合
source link: https://www.lujun9972.win/blog/2020/02/06/%E4%BD%BF%E7%94%A8calc%E8%BF%9B%E8%A1%8C%E7%BA%BF%E6%80%A7%E6%8B%9F%E5%90%88/index.html
Go to the source link to view the article. You can view the picture content, updated content and better typesetting reading experience. If the link is broken, please click the button below to view the snapshot at that time.

使用Calc进行线性拟合
今天又发现Calc的一个牛逼功能:进行线性拟合,其步骤如下:
以矩阵的形式输入待拟合的数据,其中每一行表示一个自变量的值,最后一行表示因变量的值。
比如,对于公式
Y=aX_1 + bX_2 + bX_3 +d, 那么输入的矩阵就应该是这样的:[[ x1_1, x1_2, x1_3, x1_4 ...] [ x2_1, x2_2, x2_3, x2_4 ...] [ x3_1, x3_2, x3_3, x3_4 ...] [ y_1 , y_2 , y_3 , y_4 ...]]
为了简单,我这里假设数据为
[[ 1, 2, 3, 4,  5  ]
  [ 5, 7, 9, 11, 13 ]]
(可选操作)我们可以调用gnuplot来根据这些数据画出散点图
按下
v u将矩阵分解成多个数组,Calc显示如下2: [1, 2, 3, 4, 5] 1: [5, 7, 9, 11, 13] .按下
g f进行快速做图,得到结果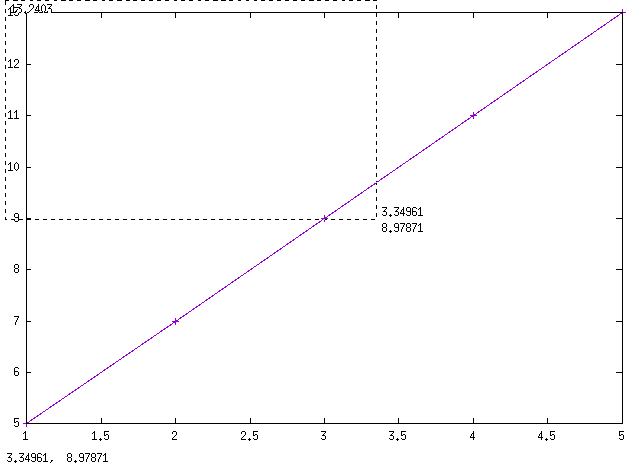
可以看出这些数据可以很好的你合成一个直线
- 按下
U回退成原始数据
- 按下
a F(calc-curve-fit) 调用拟合命令, 选择拟合模型
Calc的拟合命令支持多种拟合模型,因此会要求我们选择想要的拟合模型(按?可以查看支持的模型),我们这里选
1表示线性拟合选择自变量和参数的表示符号
这里直接回车,选择默认的符号(
x;a,b, 分号前的符号为自变量符号,分号后的符号为参数符号,符号之间用逗号分隔)。- 得出结果
2. x + 3.
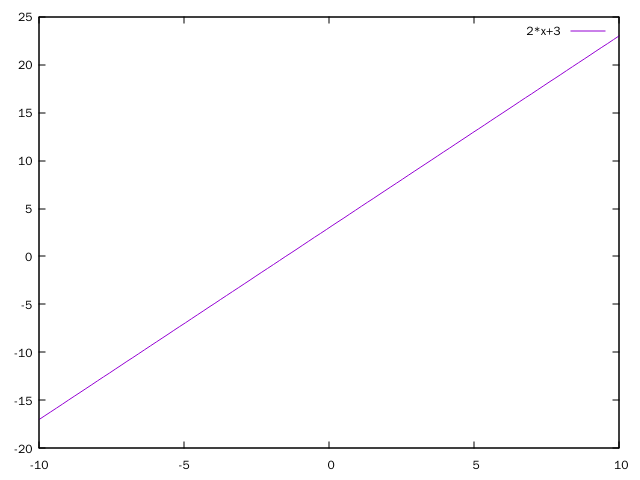
我们还可以在Calc中调用gnuplot进行做图:
- 按下
g C(calc-graph-command) - 输入
plot 2*x+3回车得到图片
Recommend
About Joyk
Aggregate valuable and interesting links.
Joyk means Joy of geeK