

What's New in vRealize Log Insight 8.4 - VMware Cloud Management
source link: https://blogs.vmware.com/management/2021/04/whats-new-in-vrealize-log-insight-8-4.html
Go to the source link to view the article. You can view the picture content, updated content and better typesetting reading experience. If the link is broken, please click the button below to view the snapshot at that time.
I am thrilled to announce the release of vRealize Log Insight 8.4 – it’s packed with new features. This release includes Log Sources with details on how to configure log collection for your containerized apps, enhanced log processing options including log masking and filtering, archival based on index partitions, alert definitions by subscription, a new web-based sizing calculator, and one of my favorite updates – built-in Webhook integration. You no longer need to use a shim server to send alerts to other sources! There are also several content pack updates for the VMware stack.
Log Sources
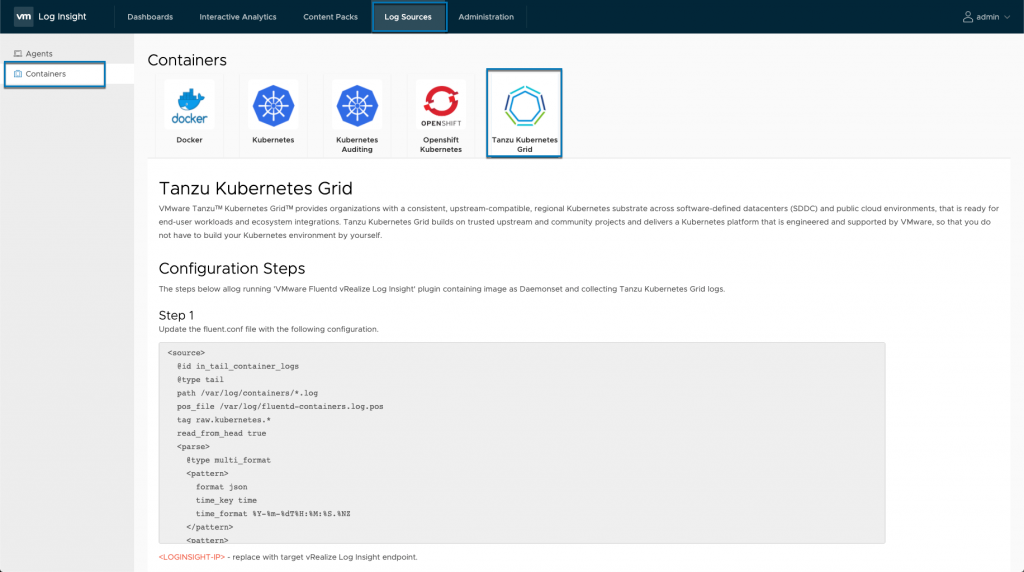
Log Sources is a repository for instructions on how to configure various applications to send logs to Log Insight. It is a new feature in this release and for this initial version, we’ve added the containerized log sources with details on how to configure sending logs using Fluentd.
Available Applications:
If we take a look at the Tanzu Kubernetes Grid configuration, we’ll find a detailed step-by step guide:
If you want to see this in action, there is a hands-on lab VMware TKGI – VMware Tanzu Kubernetes Grid Integrated (Enterprise PKS) – Getting Started, with Kubernetes logging configured using Fluentd. This is covered in Module 8 “Using Log Insight with TKGI”. The lab is not running the 8.4 version of Log Insight, but it’s a great lab to see the troubleshooting and monitoring capabilities. Thanks to Kevin Brady for creating the lab!
Log Management
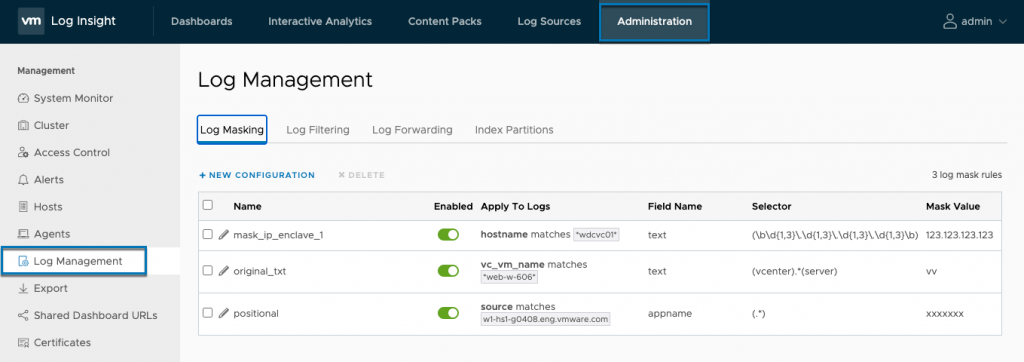
The UI has been updated with a new Log Management section. Previously configuring index partitions and log forwarding were separate items in the administration navigation pane. Now we have all of our log management options in one place, with two new options: log masking and log filtering. With this release, there are APIs available via Tech Preview to configure forwarding, partitioning, filters, and masking. The APIs can be found at <li-server>/internal/rest-api.
Log Masking
Log masking allows you to remove sensitive data in log messages. This can include personal information such as phone numbers or email addresses, Payment Card Industry (PCI) data, or simply sensitive environment info. Log masking occurs on log injection. If you mask data in a message, the log will be stored with the masked value. You will not be able to retrieve the original value. If you have forwarding configured for these logs, the forwarded logs will also have the masked value. This is by design; the sensitive data will not be available on log storage or any archives. This can help address compliance regulations.
There are three types of fields you can mask: non-positional fields, positional fields, and original text. Let’s go over each option.
Original Text
There are cases where you may want to hide information in log message by using a regular expression (regex) to pattern match the data for email address, phone numbers, or things like social security numbers. Why would these come through in log messages? You’d be surprised at what some applications are logging! Obviously, some of this data should never get to a log message, but as I know from working with customers over the years, it happens.
Common RegEx Examples:
Email Address: \b[A-Z0-9._%+-]+@[A-Z0-9.-]+\.[A-Z]{2,}\b
Social Security Number: \d{3}-\d{2}-\d{4}
IP Address: \b\d{1,3}\.\d{1,3}\.\d{1,3}\.\d{1,3}\b
Phone Number: various formats
^[1-9]\d{2}-\d{3}-\d{4}
^\(\d{3}\)\s\d{3}-\d{4}
^[1-9]\d{2}\s\d{3}\s\d{4}
^[1-9]\d{2}\.\d{3}\.\d{4}
Sometimes log messages include specific data that should be protected. In one example, a user updates their phone number in a system, the log message includes the value they changed it to. Most companies require that Personal Identifiable Information (PII) is protected. A log message containing this info is valuable, even with the data masked because you still know that the phone number data was updated.
Before Masking:

We want to make sure that all messages that are flagged as “PII” have this info redacted. Notice the regex value is enclosed with parenthesis. We are using the regex for a phone number with dashes, [1-9]\d{2}-\d{3}-\d{4}.
Now the phone number is masked from the log message.
Positional Field
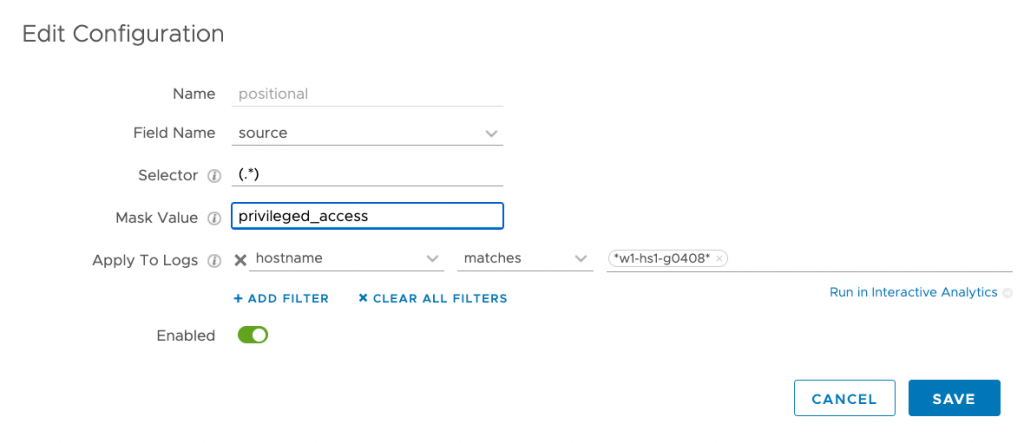
A positional field can be masked by simply selecting the field. You can use static fields or tags for filtering. For this example, I want to mask the source in log message for a specific host because it is in a high-security enclave. For the selector, use the expression .*, because I want everything in the field to be masked. Alternately, I could mask part of the field.
In this example, I want to mask the source info for a specific ESX host. Giving a description of why it’s masked can help locate that information if required.
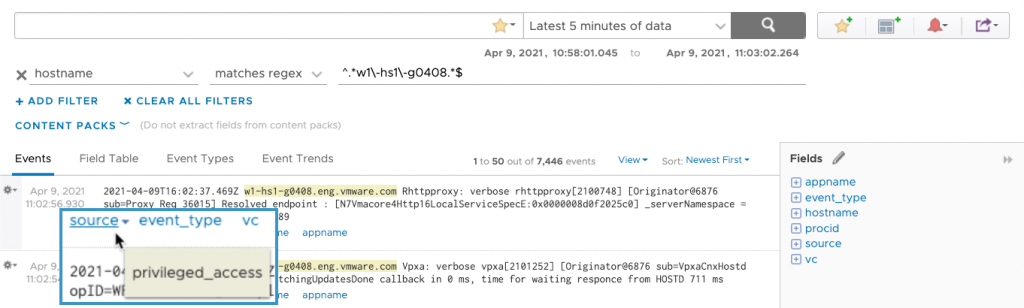
The source info is no longer included in the message and it’s replaced with a description of why it was removed.
Non-Positional Field
There may be a case where I want to remove specific text that comes through in a log message. If there is a specific username or server you want to mask you could use a 1 for 1 replacement.
For this example, I will use a name with a dash separating the values. We’ll use vcenter-server. This text will be replaced with “vc”.

I will no longer find vcenter-server in my log messages. (I used this value because it is present in the bulk of the log messages I am ingesting.)
After enabling the filter my query will no longer return results with this value.
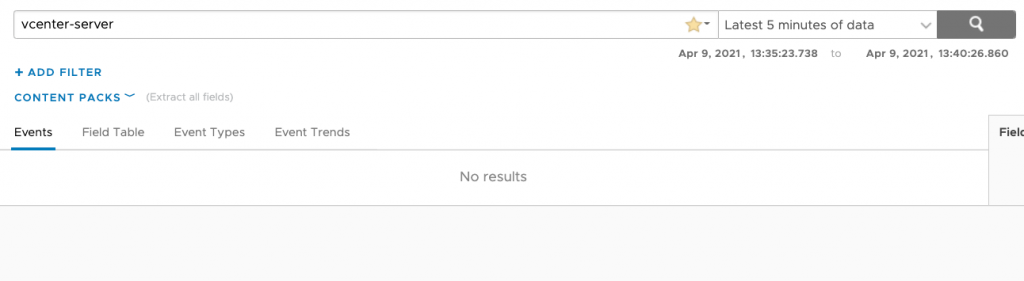
Instead, the values are replaced with vc.

Once I disable the mask configuration, the original value will be present in new log messages. The messages ingested while it was enabled will be stored with the masked value.

Log Filtering
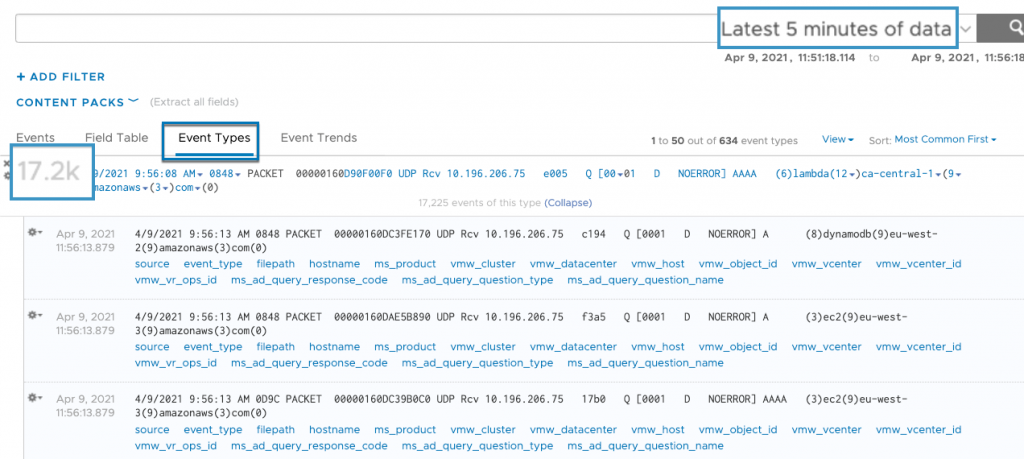
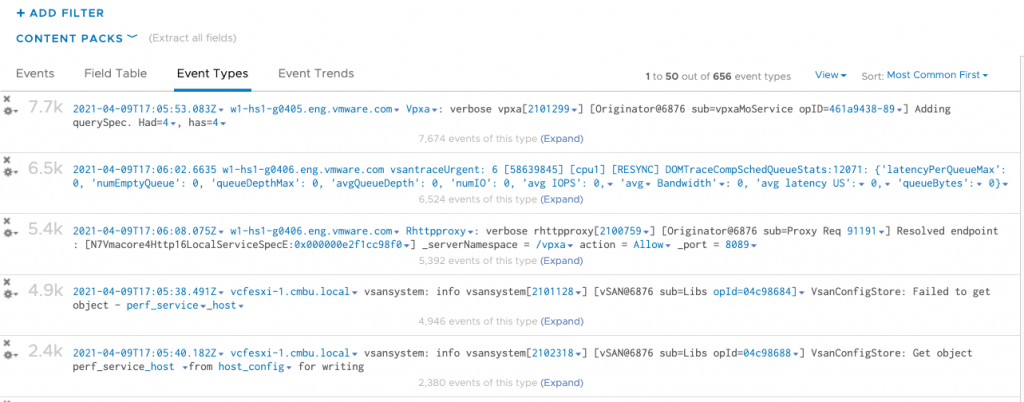
In working with logs over the years, it’s clear that some log messages are very chatty and specific logs don’t always have a lot of value or need to be retained. Log filtering allows you to drop log messages so they are not ingested. This frees up storage space and can increase search performance because there is less data to search. If you want to see what logs are most prevalent in your environment, you can go into Interactive Analytics and click on the Event Types tab.
In the last 5 minutes, there have been 17.2k log messages containing DNS lookups. If I don’t need these logs, I can drop them to free up resources.
In Log Management I’ve created several filters for log messages that I don’t need.

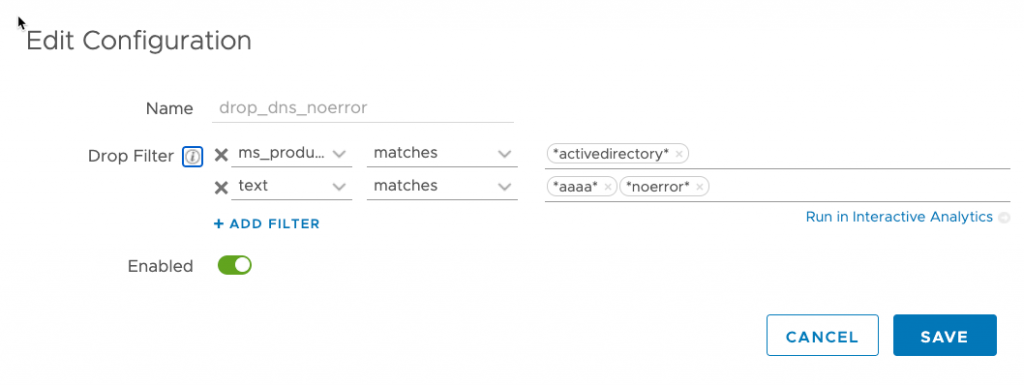
For our DNS filter I’m selecting the ms_product matches *activedirectory* since we use Active Directory integrated DNS. I’m also filtering on the text *aaaa* and *noerror*. Notice the asterisk on either end. This signifies I want to match zero or more leading and trailing characters. For more information on configuring filters for log management check out the Log Insight documentation.
Once I’ve enabled this rule, I will see a significant drop in Active Directory related log messages.
Archiving Based on Index Partitions
Variable retention was introduced in our 8.1 release. It allows you to retain logs for a specific time period. In some cases, we may only need to keep logs for a day, while other logs may require 60 days of retention. With this release, we’ve added the ability to archive logs by specific index partitions vs. archiving all log data. If you are not using partitions and want to archive all logs, you can configure this on the default partition under Log Management > Index Partitions. (Archiving is no longer available under configuration.)
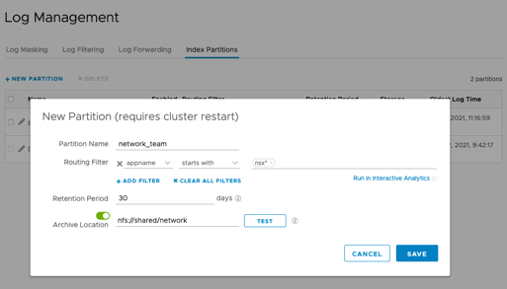
Specify a unique folder for each partition.
If you need to search your log archives, the filters will move the log messages to the appropriate partitions on import.
Native Webhook Support
As I mentioned, this is one of my favorite features in this release. You no longer need a shim server to use webhooks for notifications. vRealize Log Insight supports Slack and PagerDuty and you can also configure custom webhooks.
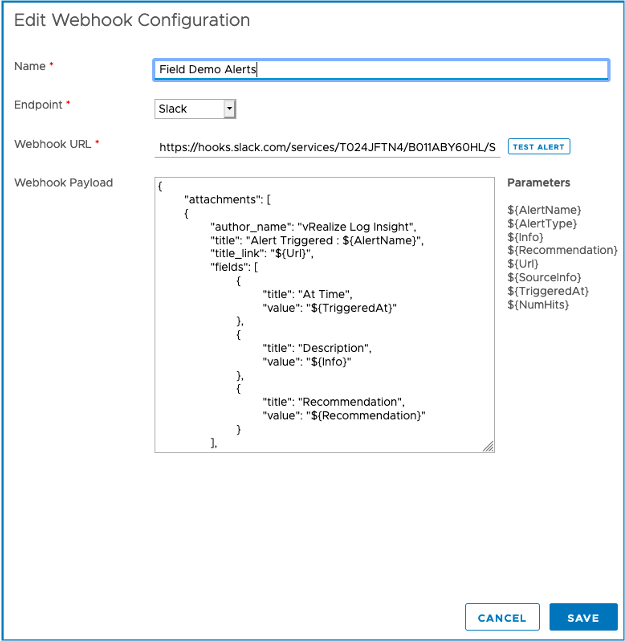
You add a webhook endpoint in Administration.
I can customize the payload to include several parameters. *Note: for a Slack endpoint, you can also use ${messages} to include up to 10 log messages that triggered an alert. This will be added to the UI in an update release for 8.4, but you can add it to your payload in this release.
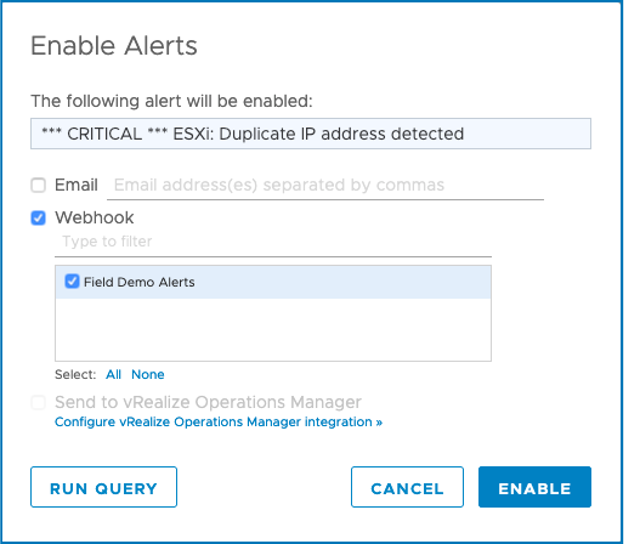
Once I’ve configured the webhook, I can choose the endpoint I configured on any alerts that I have enabled.
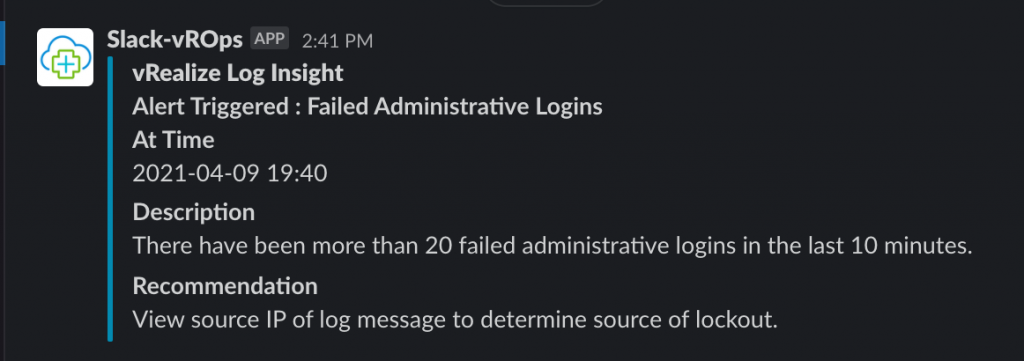
Slack Notification
Alert Subscriptions
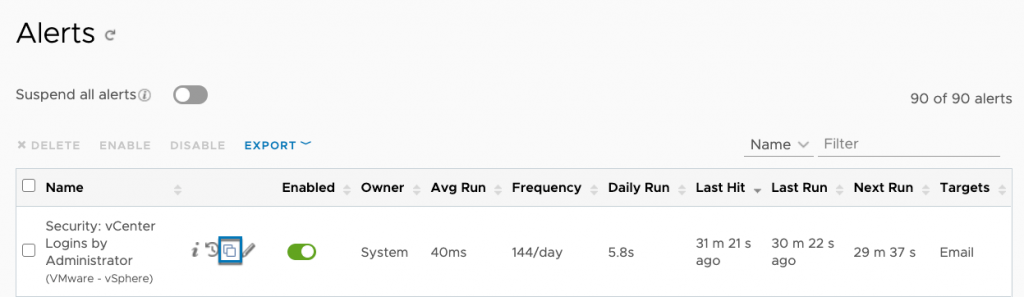
Often times you might have an alert that various teams will want to have visibility to. By updating to a subscription model, alerts no longer need to be duplicated if multiple users want to receive the same notification. Now if I have permission to create alerts, I can quickly add notifications to existing alerts by editing the alert details.

In this case, I want to add my email address. I can append my info and click on Enable to save the alert notification update.
I also have a new option to clone an alert so I can modify or fine-tune the base query.
If I click on Run Query, I can modify the search criteria.

I’ve narrowed the scope of this alert to include hostnames that start with a specific prefix. Click on Save to update the alert definition.

Log Insight Web Sizer
In previous releases of Log Insight, we used an Excel spreadsheet to size your environment. We now have a new web-based version. With the initial release we have a basic sizing calculator and as we get feedback, we will add advanced options.
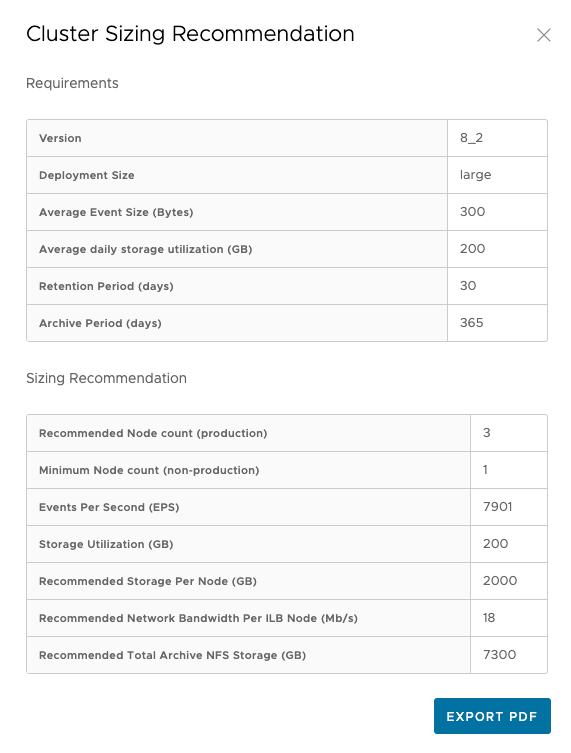
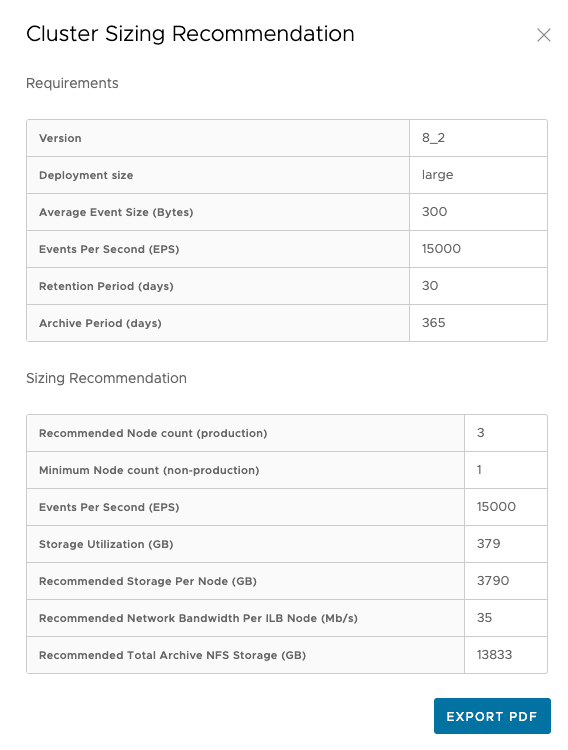
We can size an environment by using daily storage consumption or based on ingestion, calculated by events per second (EPS).
Storage:
Storage Based Sizing Specifications
Events Per Second:
Content Pack Updates
Lastly, several content packs have been updated as part of this release:
- VMware NSX-v 4.2.1
- VMware NSX-t v4.0.1
- VMware vRA 8.3+
- Microsoft IIS v3.4
- VMware Horizon v4.0.1
- vSphere v8.4 (Support for vSphere 7.0 u2)
- vRops v4.2
- vSAN (Support for vSAN 7.0 u2)
For full details on this release please review the release notes. If you want to learn more about the features and capabilities of vRealize Log Insight, check out our learning paths at VMware Pathfinder. Pathfinder offers enablement for beginners to advanced users and includes technical deep dives. You can also get access to try it out for yourself using VMware Hands-on Labs. If you’re not using Log Insight today, make sure to check out the 60-day evaluation!
Recommend
About Joyk
Aggregate valuable and interesting links.
Joyk means Joy of geeK