

50 Top Server Monitoring, APM and Observability Tools
source link: https://haydenjames.io/50-top-server-monitoring-application-performance-monitoring-apm-solutions/
Go to the source link to view the article. You can view the picture content, updated content and better typesetting reading experience. If the link is broken, please click the button below to view the snapshot at that time.
Back in 2014, I compiled a list of top server and application performance monitoring solutions. Sharing that list publicly was a great way to gain feedback and recommendations on other tools available. Over time that list grew from 20 to over 100 server monitoring and APM solutions! Because of its growing size, I’ve created a smaller, more focused list of 50 recommended APM and/or server monitoring solutions.
This list intends to allow you to easily investigate and find the best set of observability tools currently available. Some of those listed, such as Solarwinds, Datadog, NewRelic, Cacti, and Nagios, I’ve used at some point over the past decade. As always, please share your comments and suggestions with me below or by email.
“I’ve created a more targeted list that includes
50 server and observability solutions!”
Sponsored: Instrumental – Easy AWS infrastructure monitoring with free accounts
Instrumental provides automatic data collection, real-time visualizations, and intelligent alerts across your application and servers. The query language lets you transform, aggregate, and time-shift data – in real-time. Instrumental’s extreme scale, over a million data points processed every second, ensures we can handle as much data you want to send. And all signups include a free developer account for up to 500 metrics so you can get fully set up before paying a dime.
Cost: Free up to 500 metrics, then $0.10/month per metric.
1. AppOptics by Solarwinds– Application Performance Monitoring & Server Monitoring
AppOptics™ is the SolarWinds® next-generation, SaaS-based application performance management (APM) solution. Designed to address the challenges associated with disparate monitoring solutions, AppOptics is a seamless application and infrastructure monitoring solution with distributed tracing, over 150 integrations, and custom metrics that all feed into the same dashboarding, analytics, and alerting pipelines.
Cost: Free 14-day trial, starting at $7.50 per month, per host.
2. Datadog – Cloud Monitoring as a Service.
Datadog is a monitoring service that brings together metrics and events from servers, databases, applications, tools, and services to present a unified view of the infrastructure. These capabilities are provided on a SaaS-based data analytics platform that enables Dev and Ops teams to work collaboratively on the infrastructure to avoid downtime, resolve performance problems and ensure that development and deployment cycles finish on time.
Cost: Free plan, or from $15 monthly.
3. Instrumental – Free accounts for server and application performance monitoring.
Instrumental provides automatic data collection, real-time visualizations, and intelligent alerts across your application and servers. The query language lets you transform, aggregate, and time-shift data – in real-time. Instrumental’s extreme scale, over a million data points processed every second, ensures we can handle as much data you want to send. And all signups include a free developer account for up to 500 metrics so you can get fully set up before paying a dime.
Cost: Free for up to 500 metrics, then $0.10/month per metric.
4. Manageengine Opmanager – Network Monitoring & Management Software.
ManageEngine is an innovative producer of Enterprise IT Management Software, offering high-end functionality of large network management frameworks at cost-effective prices to enterprises worldwide. Serving more than 45,000 Customers Worldwide, including 3 out of every 5 Fortune 500 companies.
Cost: Free 30 day trial, then from $2000+.
5. Site24x7 – Monitoring Availability and End User Experience
Site24x7 is a full-stack performance monitoring solutions company. It offers cloud monitoring for DevOps and IT operations with monitoring capabilities extending to analyzing real users’ experience accessing websites and applications from desktop and mobile devices. The company assists DevOps teams to monitor and troubleshoot applications, servers, and network infrastructure, including private and public clouds.
Cost: Free trial or from $9 per month.
6. Splunk – SIEM, AIOps, Application Management, Log Management.
Splunk Inc. (NASDAQ: SPLK) is the market leader in analyzing machine data to deliver Operational Intelligence for security, IT and the business. Splunk software provides the enterprise machine data fabric that drives digital transformation. More than 12,000 customers in over 110 countries use Splunk solutions in the cloud and on-premises. Join millions of passionate users by trying Splunk software for free
Cost: Free 1 user plan or from $75/mo.
7. Epsagon – Applied Observability for Modern Applications
Epsagon’s SaaS platform allows Dev and Ops teams to troubleshoot less and fix issues faster by providing automated data correlation, payloads, and end-to-end observability within microservice environments. With our lightweight agent SDK, Epsagon provides automated instrumentation and tracing without gaps in coverage, giving you full visibility for containers, VMs, serverless, and more with no training, manual coding, tagging, or maintenance required.
Epsagon helps organizations and teams of all sizes optimize costs through unlimited free monitoring and scalable pricing and increase engineering efficiency through reduced application downtime, faster shipping of features, and time saved to identify and correct issues.
Cost: Free plan or from $99/month.
8. Idera – Uptime Cloud Monitor – IT Infrastructure Monitoring
Server Monitoring and Website Monitoring for cloud infrastructure by Idera. Idera provides simple, unified, smart, and fast insight into your AWS cloud servers (EC2), websites, web applications, and services to optimize performance and troubleshoot issues in a single pane of glass. The Idera unified dashboard updates every few seconds (not minutes) and reveals details that help uncover previously hidden information, like CPU Steal, and resolve problems before they arise.
Cost: Free Trial, then from $70 monthly.
9. Checkmk – IT Monitoring
Checkmk is an extension to the Nagios monitoring system that allows creating rule-based configuration using Python and offloading work from the Nagios core to make it scale better, allowing more systems to be monitored from a single Nagios server. It comes with a set of system checks, a mod_python and JavaScript-based web user interface, and a module that allows fast access to the Nagios core. On top of Nagios, it also adds additional features.
Cost: Free open source or enterprise edition.
10. Dynatrace – Application Performance Monitoring.
DynaTrace is an innovator and emerging leader in APM. They offer the only continuous APM system on the market, delivering a proactive approach to application performance that reduces the time to repair problems by 90% and eliminates the huge amounts of resources currently spent resolving performance issues.
Cost: 30 Day Free Trial. Then ask for pricing.
11. Exoprise – Office 365 | SaaS | Cloud | Monitoring
Exoprise CloudReady is a platform for end-to-end visibility into the networks and applications your organization relies on. Monitor and benchmark the end-user experience from inside and outside your firewall with crowd-sourced performance data. Easily deployed, no scripting required, with support for ALL Office 365, any Web App, any SSO, SharePoint, Exchange, and Skype/VoIP. Find and fix problems fast, detect outages, observe trends and improve operations for your entire business.
Cost: Free Trial or from $100 per sensor/month.
12. IBM – Cloud Application Performance Management
IBM Cloud Monitoring can help you manage the performance and availability of your virtual environments.
Cost: Various paid solutions available.
13. Icinga – Open Source Monitoring
Icinga 2 is a network monitoring system and parallel development branch to Icinga 1. It is a core framework replacement (no GUI) that seeks to build on the success of Icinga 1 and deal with shortcomings inherited from Nagios as a fork. Icinga is Nagios compatible.
Cost: Free and open source
14. Broadcom – service management, application performance monitoring.
Broadcom – who recently acquired CA Technologies – engages in the design, development, marketing, licensing, and support of information technology (IT) management software products that operate on various hardware platforms and operating systems. The company has a portfolio of software products and services that address its customers’ needs for mainframe and distributed environments, spanning IT governance, IT management, and IT security. It focuses on various areas that include infrastructure management, project and portfolio management, security management, service management, application performance monitoring, and data center automation and virtualization.
Cost: Have them contact you.
15. LogicMonitor – hosted monitoring of networks, servers, and applications.
LogicMonitor provides SaaS-based data center monitoring of physical, virtual, and cloud-based IT infrastructures. The software provides performance monitoring, historical trending, reporting, and email/SMS alerting to proactively warn IT, staff of potential issues before they cause business interruptions. LogicMonitor provides pre-configured out-of-the-box monitoring for most vendors of switches, routers, firewalls, load balancers, servers, applications, databases, VoIP systems, and storage from a single web-based console.
Cost: Free 14 day trial, then from $249 per month.
6. Obkio – Network Performance Monitoring Solution for Enterprises
Network Performance Monitoring solution for Enterprises. Detect, troubleshoot, and fix performance issues before they affect the end-users.
Cost: Free or from $29 per month.
17. Monit – Easy, proactive monitoring.
Monit is a small Open Source utility for managing and monitoring Unix systems. Monit conducts automatic maintenance and repair and can execute meaningful causal actions in error situations.
Cost: Free and open-source / or from 65 per month.
18. Monitis – Network & IT Systems Monitoring
Monitis was founded in 2006 and created to provide business executives, IT specialists, and service providers with an all-in-one cloud-based monitoring product. The company maintains offices in the US, Germany, and Armenia. Monitis is a cloud-based solution, meaning there is virtually nothing to download for most functionalities. Some services require installing an agent or integrating some code into the website, etc., but it takes minimal effort and can typically be completed within minutes.
Cost: Built-a-plan.
19. Munin – System, network, and infrastructure monitoring software.
Munin is a networked resource monitoring tool that can help analyze resource trends and “what just happened to kill our performance?” problems. It is designed to be very plug and play. A default installation provides a lot of graphs with almost no work.
Cost: Free and open source
20. Nagios – IT Infrastructure Monitoring And Alerting
Nagios is a powerful monitoring system that enables organizations to identify and resolve IT infrastructure problems before affecting critical business processes. Designed with scalability and flexibility in mind, Nagios gives you the peace of mind that comes from knowing your organization’s business processes won’t be affected by unknown outages.
Cost: Free for Nagios Core
21. New Relic – Application Performance Monitoring
New Relic offers a SaaS Software Analytics Platform that offers Application Performance Monitoring and Real User Monitoring for Cloud and Data Center deployed web applications implemented in Ruby, Java, .NET, Python, PHP, Node.js. New Relic also offers mobile monitoring solutions for iOS and Android applications.
Cost: Free plan, then from $149 per month.
22. Oracle Application Performance Monitoring Tools
Oracle Application Performance Monitoring Cloud Service provides development and operations teams with the information they need to find and fix application issues quickly. All your end-user and application performance information (with associated application logs) are brought together into Oracle Management Cloud’s secure, unified big data platform.
Cost: Starts at $250 | Start a Free Trial
23. PA Server Monitor – server monitoring and network monitoring.
PA Server Monitor is a server monitoring and network monitoring software application developed by Power Admin LLC. The software’s main function is to monitor the performance of servers and network devices in Windows and Linux environments. Data is kept on customers’ servers, not stored in the cloud. An agentless monitoring software to watch ping, CPU, memory, disk, SNMP + traps, events, with available historical reports. Apps are available for iOS and Android.
Cost: Free trial or from $49 monthly.
24. Pingdom – website performance monitoring.
Pingdom is a service that tracks the uptime, downtime, and performance of websites. Based in Sweden, Pingdom monitors websites from multiple locations globally to distinguish genuine downtime from routing and access problems.
Cost: 14-day Free trial or from $14.95 per month.
25. PRTG – Network Monitor
Paessler Router Traffic Grapher is a server up-time and utilization, network monitoring, and bandwidth usage software package for server infrastructure from Paessler AG. It can monitor and classify bandwidth usage in a network using SNMP, Packet Sniffing, and Netflow. It services Microsoft Windows as well as Linux.
Cost: Free-forever plan or from $1,600 with a free 30-day trial. (Also see their freeware)
26. Aternity – Application Performance Monitoring (A new division of Riverbed)
Riverbed Technology, Inc. (Riverbed) has developed enterprise-level solutions to the fundamental problems associated with information technology (IT) performance across wide area networks (WANs). Riverbed recently announced the formation of a new Aternity division to capitalize on the tremendous growth opportunities in Digital Experience Management (DEM), which includes Riverbed’s End User Experience Monitoring (EUEM) and Application Performance Management (APM) solutions. Aternity, known for its breakthrough innovation and leadership in DEM, delivers a unique set of capabilities that provide rich, transaction-level visibility into all drivers of end-user experience — from the end-user device to the application code — to enhance the experience of traditional SaaS, mobile, and cloud-native applications.
Cost: Contact a sales rep.
27. Pingdom Server Monitor – Hosted Server Monitoring
Flexible charts and alerting, deploy in five minutes or less, 60+ monitoring plugins, and no ugly configuration syntax to memorize (do it all via our web UI).
Cost: 30-day free trial, then from $10 per server monthly.
28. Motadata – Application Performance Monitoring
Motadata is a unified IT analytics platform, Log & Flow Management, and IT Service Management Platform, offering operational insights into your IT infrastructure and its performance and is designed to identify & resolve complex problems faster, ensuring 100% uptime of all business-critical components. Motadata enables you to make more informed business decisions by offering complete visibility into IT services’ health and key performance indicators (KPIs).
Cost: Free trial/request a quote.
29. Solarwinds – Server Monitoring & Application Performance Monitoring
More than one million network engineers use SolarWinds products to manage IT environments ranging from ten to tens of thousands of network devices. Comprised of fault and performance management products, configuration and compliance products, and tools for engineers, the SolarWinds product family is trusted by organizations worldwide. SolarWinds was founded in 1999. and has headquarters in Austin, Texas, with sales and product development offices around the world.
Cost: Free 30 day Trial. Request a quote.
30. Stackify – Server and Application Performance Monitoring Tools.
Stackify provides software developers, operations, and support managers with an innovative cloud-based platform that allows them to monitor and troubleshoot their cloud-based applications and get DevOps visibility. Using Stackify, businesses can easily detect and resolve application problems and ensure their customers’ satisfaction. The platform combines monitoring, errors, metrics, logs, and secure remote access with the relevant context in one platform.
Cost: Free Trial, then from $15 monthly.
31. WhatsUpGold – Network & Server Monitoring Software.
Know exactly how your IT environment is performing with network and server monitoring. Use active, passive, and performance monitoring techniques to monitor your network, servers, and applications’ performance, availability, and status.
Cost: Free 30 day trial, then from $1,755.
32. Anturis – Cloud-based Monitoring Service for Servers and Websites
Anturis is a cloud-based (SaaS) monitoring platform built for external monitoring of company web services and internal monitoring of IT infrastructures, such as servers and applications. The team is backed by seasoned IT experts and software engineers who have all worked for leading global IT companies and startups, including Parallels, Kaspersky Lab, Amdocs, Atempo, K7 Cloud, and jNetX.
Cost: Free plan, or from $9.50 monthly.
33. AppDynamics – Application Performance Monitoring (APM) & Server Monitoring
AppDynamics is the next-generation application performance management & monitoring solution that simplifies the management of complex, business-critical apps. AppDynamics customers include DIRECTV, AMICA Insurance, Hotels.com, StubHub, Staples, Insight Technologies, and Cornell University.
Cost: Free 14 day Trial, then from $230 monthly.
34. Zabbix – Enterprise-Class Open Source Distributed Monitoring Solution.
Zabbix is an enterprise open source monitoring solution for networks and applications created by Alexei Vladishev. It is designed to monitor and track the status of various network services, servers, and other network hardware.
Cost: Free and open source.
35. Amazon Cloudwatch – Amazon CloudWatch Cloud Network Monitoring Services
Cost: Free Tier or varies.
36. HPE – Hewlett Packard Enterprise HPE
Achieve Dramatic Gains in Data Center Efficiency. Optimize Your IT Operations.
Cost: Depends on the wide array of solutions.
37. plumbr.eu – User Experience Application Performance Monitoring Tools
Plumbr makes Java applications faster and more reliable.
Cost: Free trial, then $299 monthly.
38. Zenoss – Unified monitoring platform.
Zenoss works with the world’s largest organizations to ensure their IT services and applications are always on. As the global leader in hybrid IT monitoring and analytics software, Zenoss provides complete visibility for cloud, virtual and physical IT environments. Zenoss customers gain IT performance and risk insights into their unique IT ecosystems through real-time analytics that adapt to the ever-evolving data center and cloud, enabling them to eliminate disruptions and accelerate business.
Cost: Free open-source or paid.
39. Nginx Amplify – NGINX monitoring made easy
The NGINX Amplify Agent is a Python application that provides system and NGINX metrics collection. It is part of NGINX Amplify — a free configuration monitoring tool for NGINX.
Cost: Free up to 5 hosts. Contact for pricing.
40. Sensuapp.org – Sensu | Full-stack monitoring for today’s business.
Sensu is the monitoring platform for your entire business. By focusing on composability and extensibility, Sensu is the cohesive monitoring platform that you are looking for.
Cost: Free open-source or from $99.00 monthly.
41. Cacti – The Complete RRDTool-based Graphing Solution
Cacti is an open-source, web-based network monitoring and graphing tool designed as a front-end application for the open-source, industry-standard data logging tool RRDtool. Cacti allows a user to poll services at predetermined intervals and graph the resulting data. It is generally used to graph time-series data of metrics such as CPU load and network bandwidth utilization. A common usage is to monitor network traffic by polling a network switch or router interface via Simple Network Management Protocol (SNMP).
Cost: Free open source.
42. InfluxData (InfluxDB) | Time Series Database Monitoring & Analytics
InfluxData delivers a complete platform built specifically for metrics, events, and other time-based data — a modern time-series platform. Whether the data comes from humans, sensors, or machines, InfluxData empowers developers to build faster, easier, and to scale, an engine propelling the next generation of monitoring, analytics, and IoT applications. With both fast deployment and fast performance, InfluxData gives developers, analysts, scientists, and IoT innovators real business value quickly. The InfluxData Platform is built upon the open-source TICK stack (Telegraf, InfluxDB, Chronograf, Kapacitor). Each of the components of the TICK stack is open source and is available under the MIT license.
Cost: 14 Day free trial or from $249/mo.
43. Uptime.com – Uptime & Performance Monitoring Made Easy
Uptime is a service that monitors the uptime of websites and provides alerts when it goes down.
Cost: Free account or from $10 per month.
44. Grafana – The open platform for beautiful analytics and monitoring
Grafana offers application analytics visualization services and features graphing, styling, template variables, panels, and themes. Grafana.net enables its users to visualize, share, scale, and project their time-series data. worldPing offers global monitoring, dynamic dashboards, and alerting.
Cost: Free open source.
45. Instana – Automated APM for Cloud-Native Applications
Instana makes it easy to visualize and manage the performance of your business applications and services. Built specifically for cloud-native microservice architectures, Instana leverages automation and AI to deliver immediately actionable information to DevOps. For developers, Instana’s AutoTrace technology automatically captures context, mapping all your applications and microservices without continuous additional engineering.
Cost: Free 14 day trial or from $11/mo.
46. Netdata – Get control of your Linux Servers. Simple. Effective. Awesome.
Analyze thousands of metrics per server. Everything about the system (CPU, RAM, disks, network, firewall, QoS, NFS, ZFS, etc.). Detailed performance metrics for dozens of applications (such as web servers, databases servers, email servers, DNS servers, etc.). Visualize metrics collected from SNMP devices and APM metrics via the embedded statsd server. netdata supports auto-detection for everything. It collects more than 5000 metrics automatically, with zero configuration, it has zero dependencies, requires zero maintenance, and comes with more than 100 alarms pre-configured to detect common failures, performance, and availability issues.
Cost: Free open-source.
47. Nodequery – Linux Server Monitoring.
Just one simple command is required to install and remove the agent on most of the major Linux distributions. It’s completely written in bash and available at Github for everyone to review.
Cost: Free open-source.
48. Glances – An Eye on your system
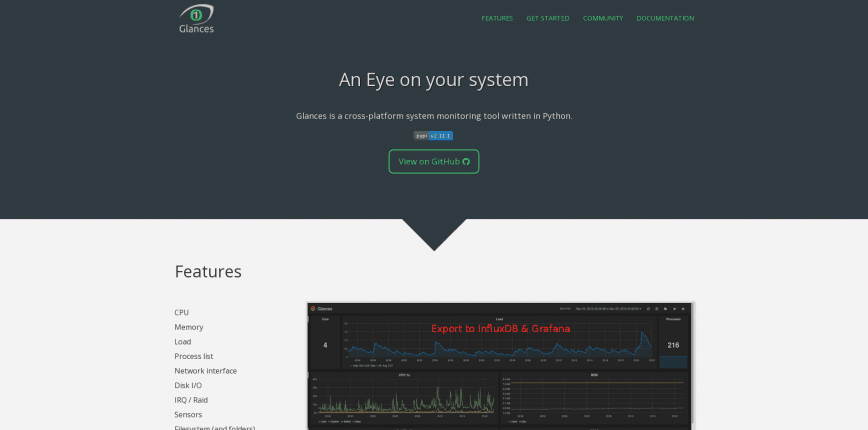
Open-source software to monitor and collect operating system statistics.
Cost: Free open-source.
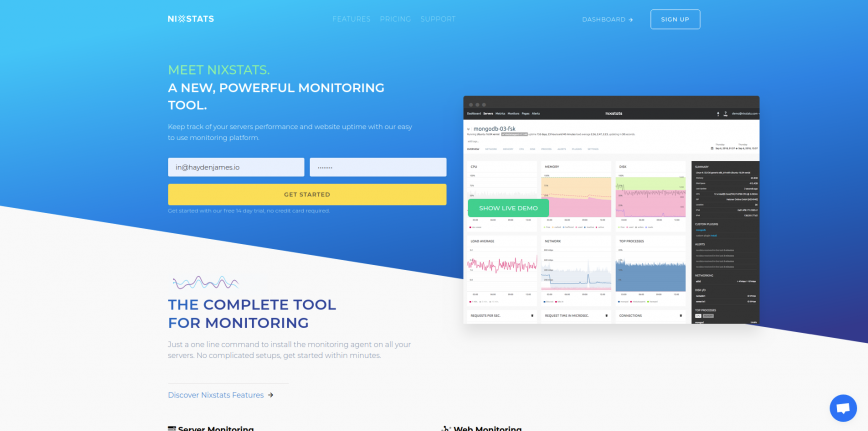
49. Nixstats – Linux server monitoring.
Cost: Free basic account or from $7 monthly.
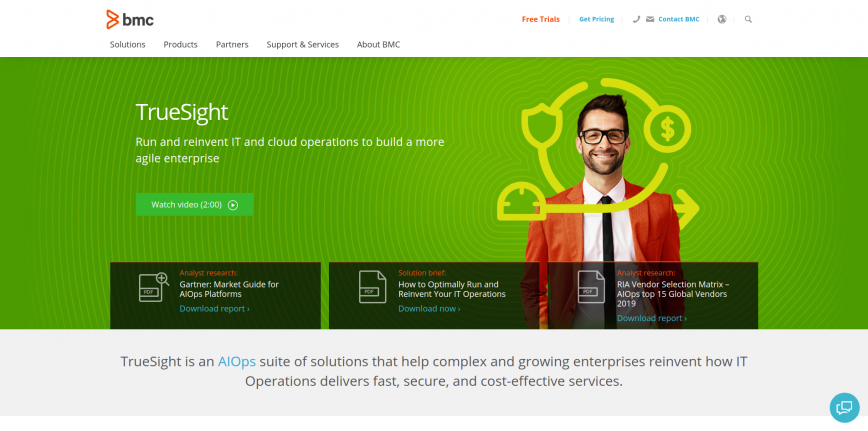
50. BMC TrueSighe Pluse – Server & Application Performance Monitoring Tools
Boundary is Application-Aware Infrastructure Performance Monitoring. Requires zero change to the application, is agnostic across languages and infrastructures, sits on every VM, collects massive amounts of performance data, consolidates data from other sources, and puts it all in context with its unique, real-time application map.
Recommend
About Joyk
Aggregate valuable and interesting links.
Joyk means Joy of geeK