

SSMS Custom Report for SQL Server Database Metrics
source link: https://www.mssqltips.com/sqlservertip/6722/ssms-custom-report-sql-server-database-metrics/
Go to the source link to view the article. You can view the picture content, updated content and better typesetting reading experience. If the link is broken, please click the button below to view the snapshot at that time.

SSMS Custom Report for SQL Server Database Metrics
By: Eduardo Pivaral | Updated: 2021-04-02 | Comments | Related: 1 | 2 | More > Monitoring
Problem
When working with SQL Server it is helpful to have an overview of your database that you are working with. You could run several different queries and review each of the datasets, but a better approach would be to create a SQL Server Reporting Services (SSRS) report that could gather the data and display in one central location and better yet, be able to do from SSMS.
Solution
I created an open-source solution called StudyYourServer, that is a set of SSRS reports built to work as custom reports inside SQL Server Management Studio (SSMS). In this tip I will show you how to import the Database Dashboard report to SSMS and what is included in the report.
SSMS Custom Reports
You may have noticed that SQL Server Management Studio has standard reports that you can run, but did you know you could also create your own custom reports that can be run right from SSMS. A custom report is just importing your own reports into SSMS, these reports are standard .rdl files that you can develop using SSDT. See below.
Requirements for this Solution
Since the most recent SQL Server Data Tools (SSDT) version was used, there are some compatibility requirements for the reports to work:
- Supported for SQL Server 2012 or newer only
- Azure SQL database is not supported
- SSMS 17.9 or newer, you can download the latest SSMS version here.
Once you have validated all the requirements, you can import the reports.
Download Custom Report
To download the custom Database Dashboard report, click here. Save the RDL file in a location on your desktop to be used in the import step.
Import Custom Reports into SSMS
This is a database level report, so to import the report, right click on a database name and follow the steps below.
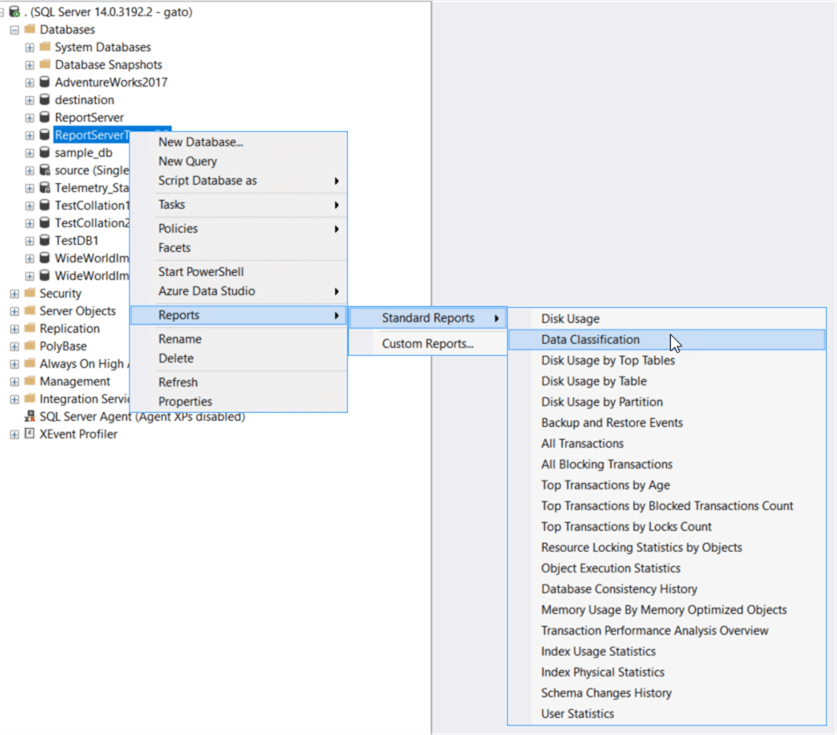
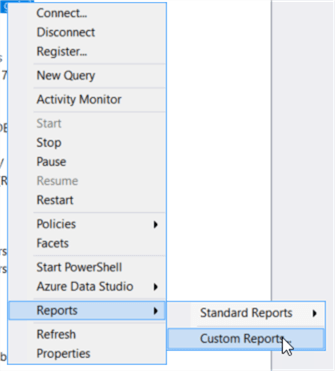
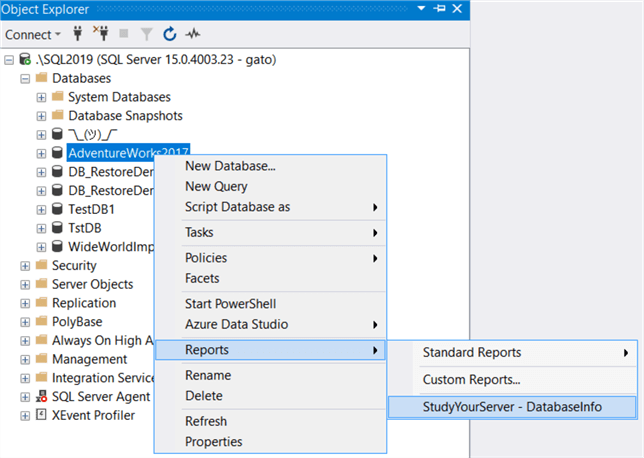
To import the custom Database Dashboard report, right click on a database name in SSMS, select Reports > Custom Reports and then select the RDL file you want to import.
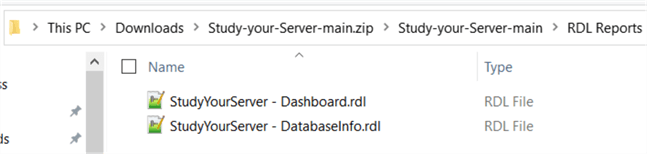
Locate the StudyYourServer - DatabaseInfo.rdl file you saved previously.
Note: even when the reports are imported, do not delete the original files or the next time you try to access them it will be removed from SSMS.
Server Dashboard Database Info
In Part 1, we looked at the Server Dashboard report and how the database info section gave us some information regarding the database as shown below:
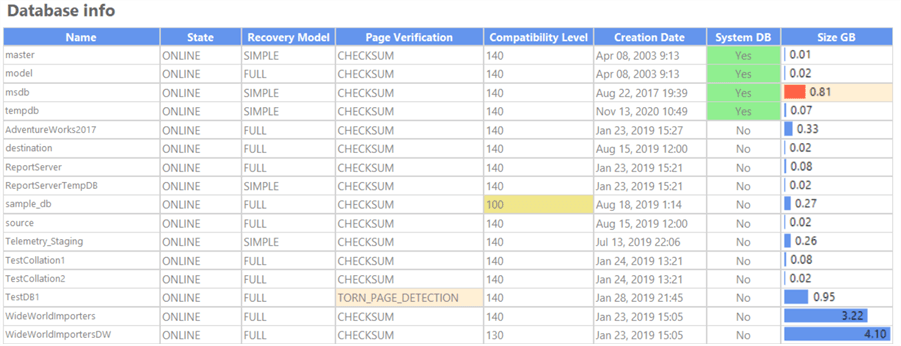
Let's take a look at the database specific report to see even more information about databases.
Database Dashboard Report Overview
To access the report right click in any SQL Server database you want to check and go to Reports, the report should now appear there:
The report will display and will present you the information regarding that database (we will discuss each section in a moment):
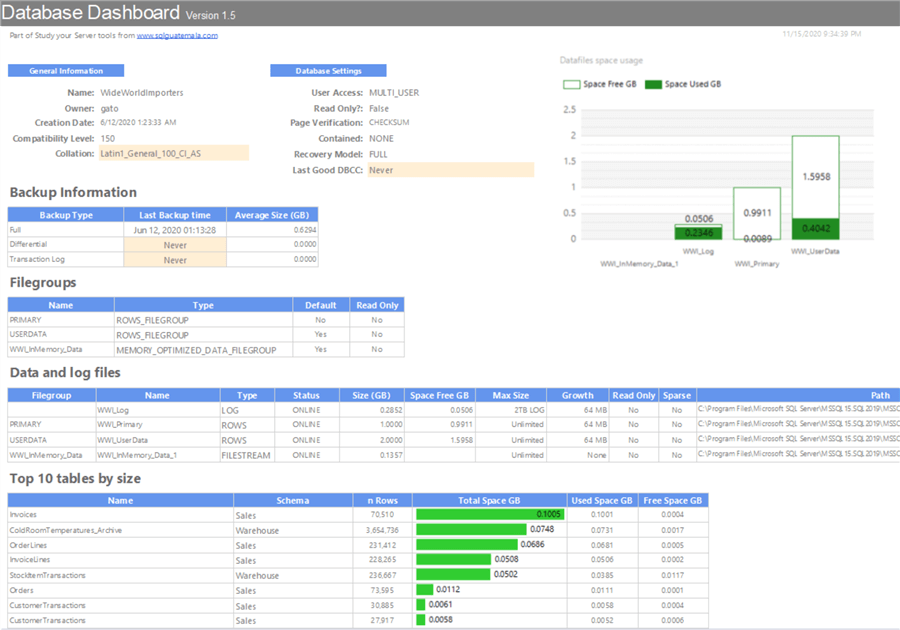
Overall, the report presents multiple sections and highlights areas that need your attention. These are based on "best practices", but please note that a best practice is not a rule and some of the highlighted information may not apply to your environment. Also, tool tips are provided when you hover over an attention area, hinting what needs to be done to address each finding.
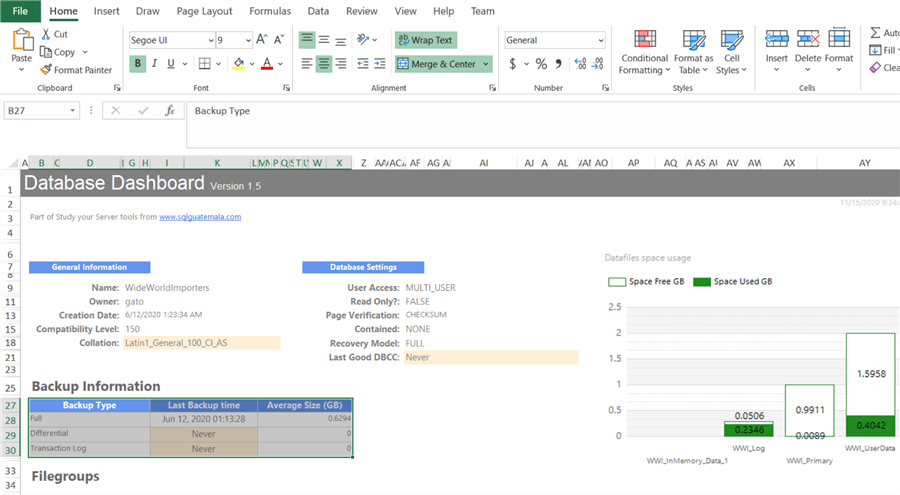
General Database Information
Here we can find information about the configuration, status and options of the database. There are other options you may consider important that are not here, but these are the options I check most when checking for overall information of the database, so feel free to edit the report and add/remove as needed.
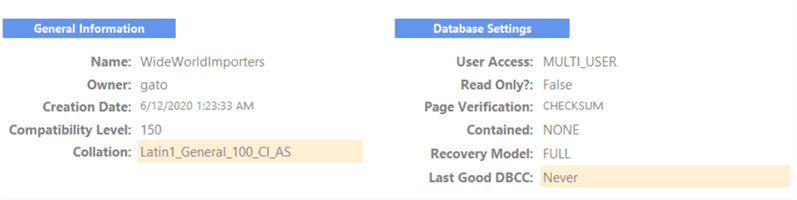
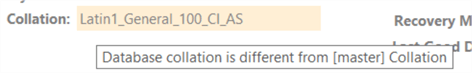
In the case of the collation, it is marked as a warning because is different from the one configured on the master database:
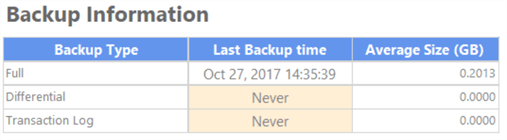
Backup Information
This shows you the latest backup taken for each type of backup and the average size in GB. When backups are missing the last backup date is highlighted. I did not highlight older backups, because the meaning of old can vary from user to user, but this is something you could change in the report if you want.
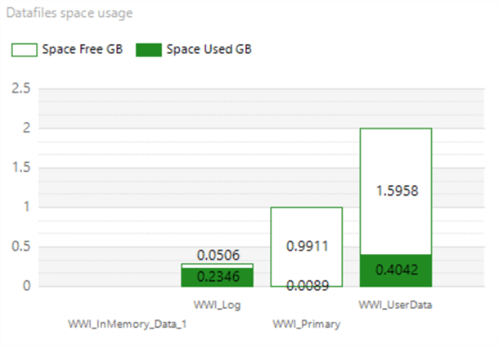
Database Files Space Usage Chart
Visual representation of free and used space for each data file is shown here, this complements the database file information we will see later in this tip.
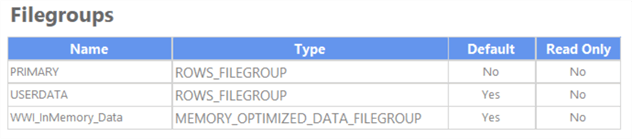
Filegroups
This shows filegroups information for the database.
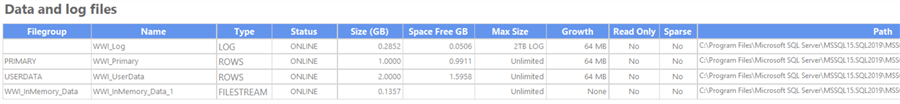
Data and Log Files
Similar to the SSMS tab in the database properties, it gives you information about each data file and its properties.
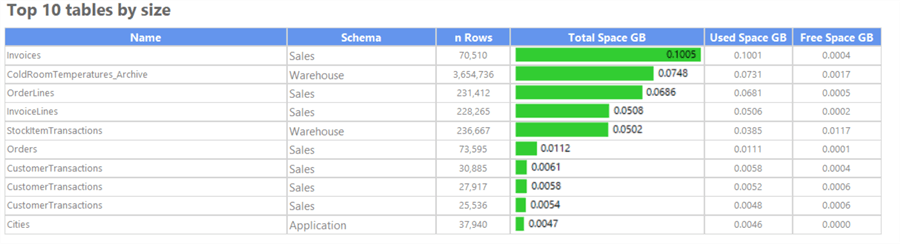
Top 10 Tables by Size
This table include information and a visual representation of the top 10 biggest tables ordered by size, this will help you quickly identify space utilization issues.
User Sessions
This show connections currently using the database, you can obtain information about hostname, program name, login, and status for easy troubleshooting. Note: for busy systems, this section of the report can be very large.

Orphan Users
An orphan user is when a database user is not correctly mapped to a login. This is commonly occurs when you backup and restore databases from a different server. Having this section empty is a good sign, but if you have an orphan user detected, you can check how to fix them here.

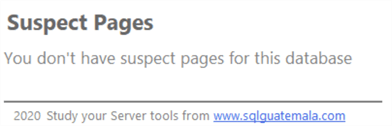
Suspect Pages
This section obtains information from the suspect_pages table in msdb, but is scoped to the current database. A healthy databases should have this section empty.
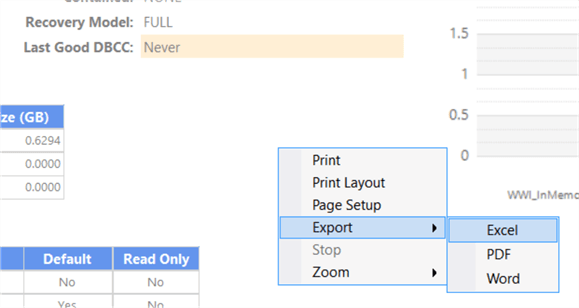
Export Report Content
You can also export this data to various formats. Right click on any empty portion of the report and select Export > Excel (or any option):
Once you have saved the file, you can copy and edit values if needed:
Fully customizable
Since this is an open-source report, you can modify it to include more information or change how the information is presented. If you encounter issues or incorrect information you can simply change as needed.
Remember, a best practice is just a standardized way of doing things that has proven to work in most cases and is generally accepted, but some of those recommendations may not work for you. Use these reports as a general guide and always use common sense and your expertise to determine if an option may or may not work for you.
Next Steps
- Download the rdl file for this article (version 1.5 of the report).
- Check out part 1 which gives an overview at the server level.
- By accessing the source code of the .rdl report you can check the queries used in each section.
- You can check best practices tips here.
About the author
Recommend
About Joyk
Aggregate valuable and interesting links.
Joyk means Joy of geeK