

Introducing HyperTrack Insights
source link: https://hypertrack.com/blog/2021/02/04/introducing-insights/
Go to the source link to view the article. You can view the picture content, updated content and better typesetting reading experience. If the link is broken, please click the button below to view the snapshot at that time.
Introducing Insights
An aggregate view of your fleet’s operations powered by location intelligence
HyperTrack isn’t just live tracking; it’s also a wealth of data about your mobile operations—data that can help spot inefficiency, optimize your routing and assignments, and unlock new value. This data has always been available in scoreboard views and exportable data, but we’re happy to announce a powerful new tool: Insights.
Free to every HyperTrack user, Insights is an interactive way to explore operational data with maps, filters, groups, and exports. It’s never been easier to discover bottlenecks, spot outliers, understand your fleet's performance in context, and start turning questions into answers.
“In the midst of chaos, there is also opportunity” – Sun Tzu
Query and interact with data from trips, geotags, geofences, and even individual tracked users, then easily download any query as a CSV to share with team members, or import into 3rd party BI suites.
Users of metadata profiles will be at the helm of their business with the grouping and filtering capabilities of Insights. Profiles associated with your users, trips, and places will display alongside aggregates, providing context and clarity. Tabular data can be grouped by these profiles, by outage reasons, or by user. Once grouped, it becomes easy to compare segments of data.
It’s dangerous to go alone; take this!
Visually explore fleet operations using hands-on data visualization. Insights provides context-relevant maps for each of our top level APIs–exposing delays, deviations, and no-shows with color coded cues. As you explore these, sortable and filterable data tables update automatically.
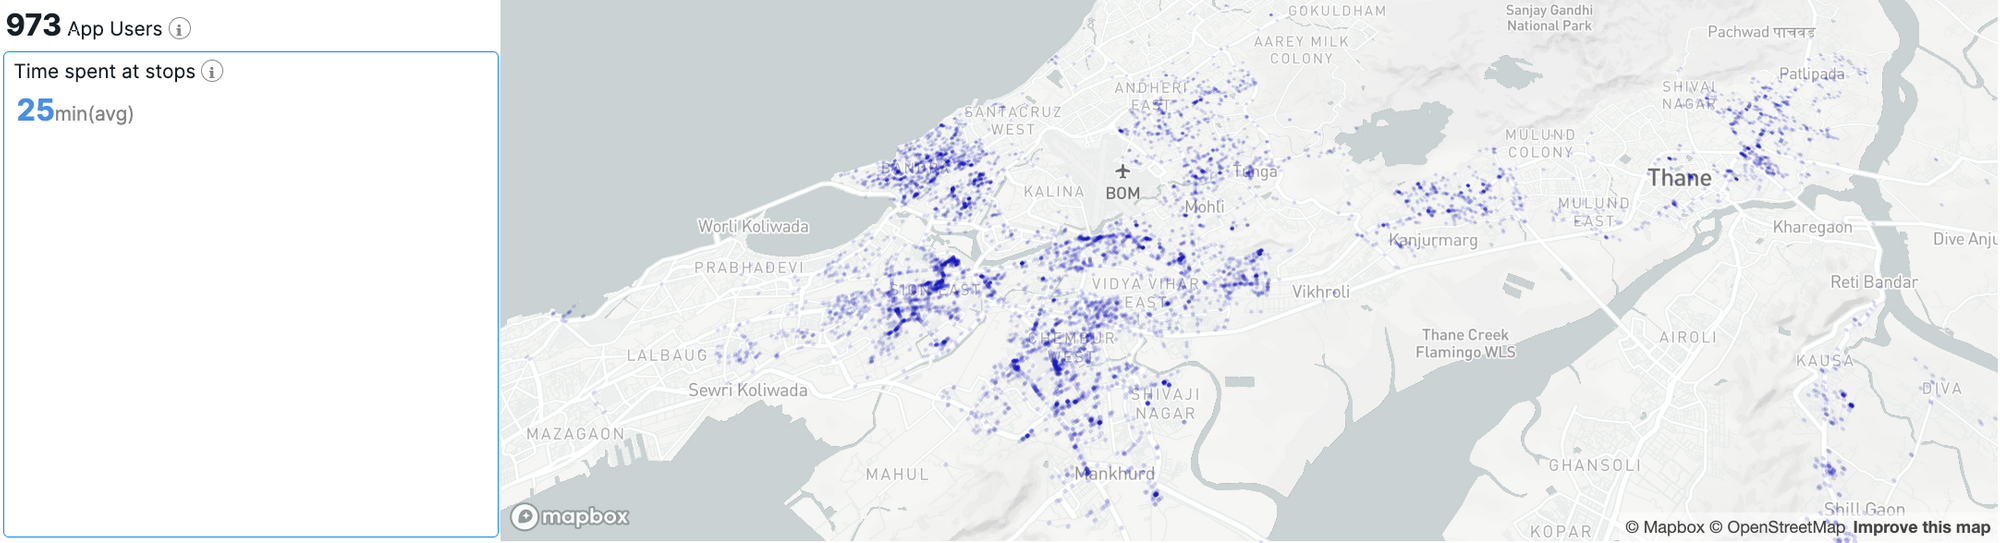 View all of your your fleet's stops
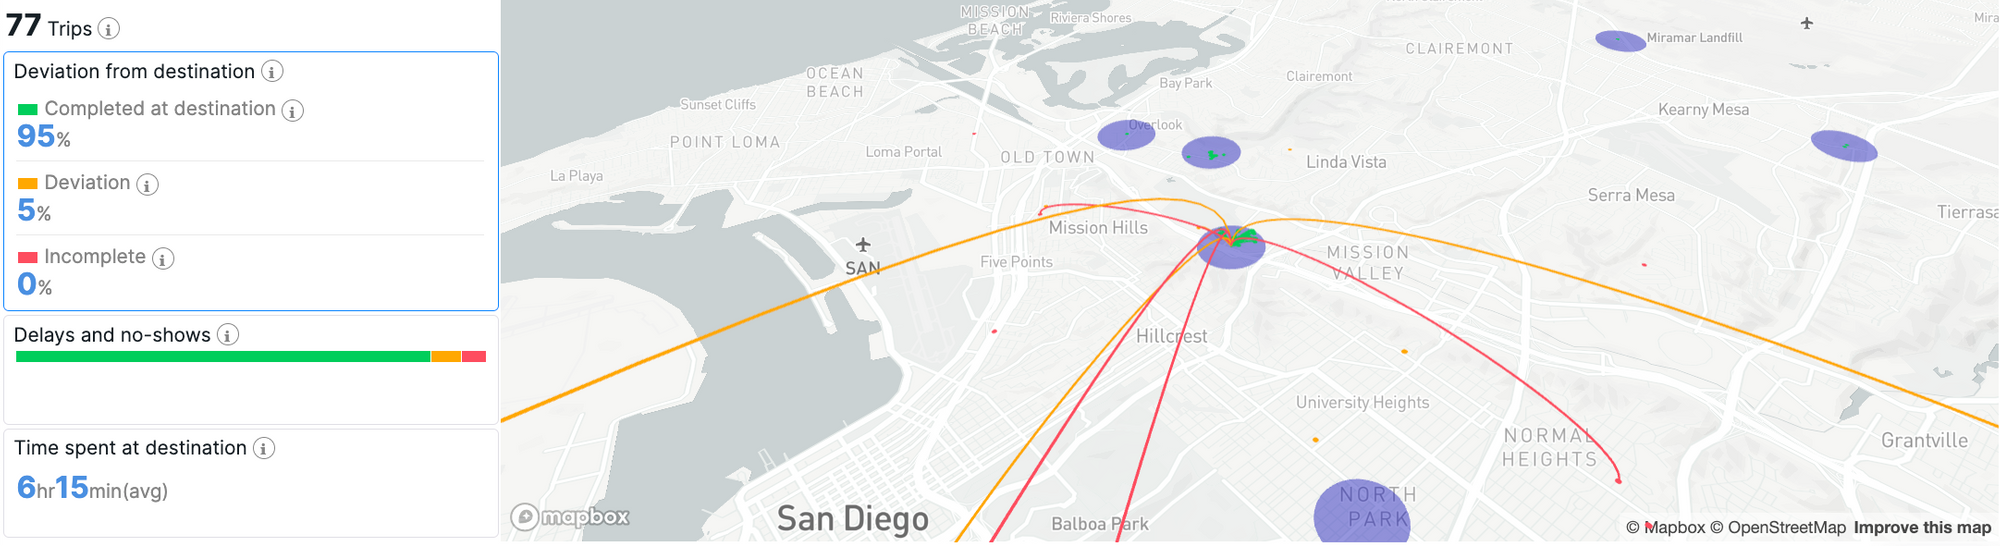 Show displacements in time and space from destinations
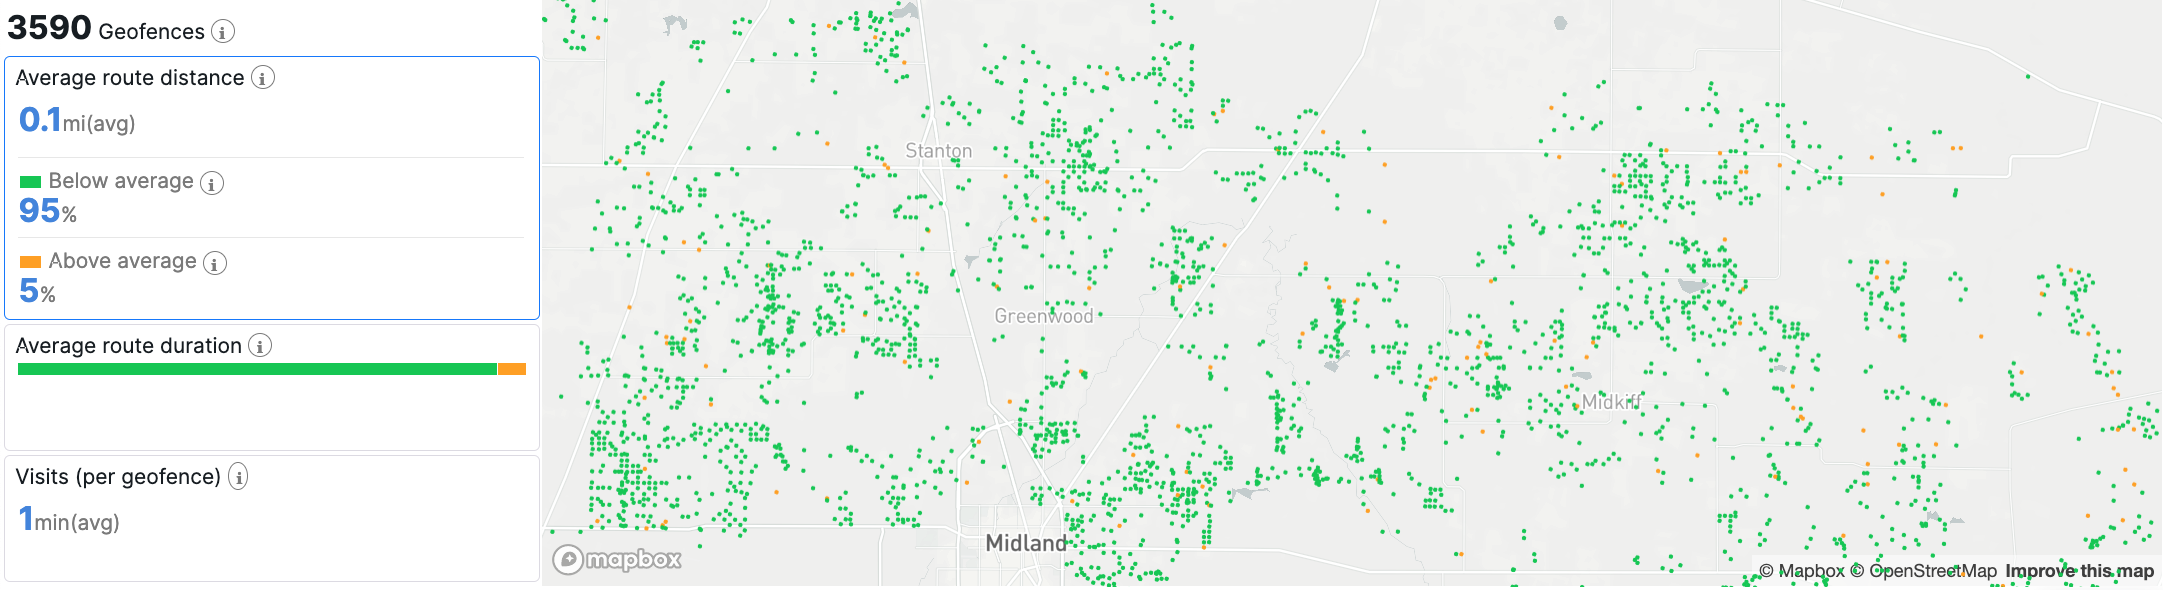 Identify delays and route inefficiencies between geofences
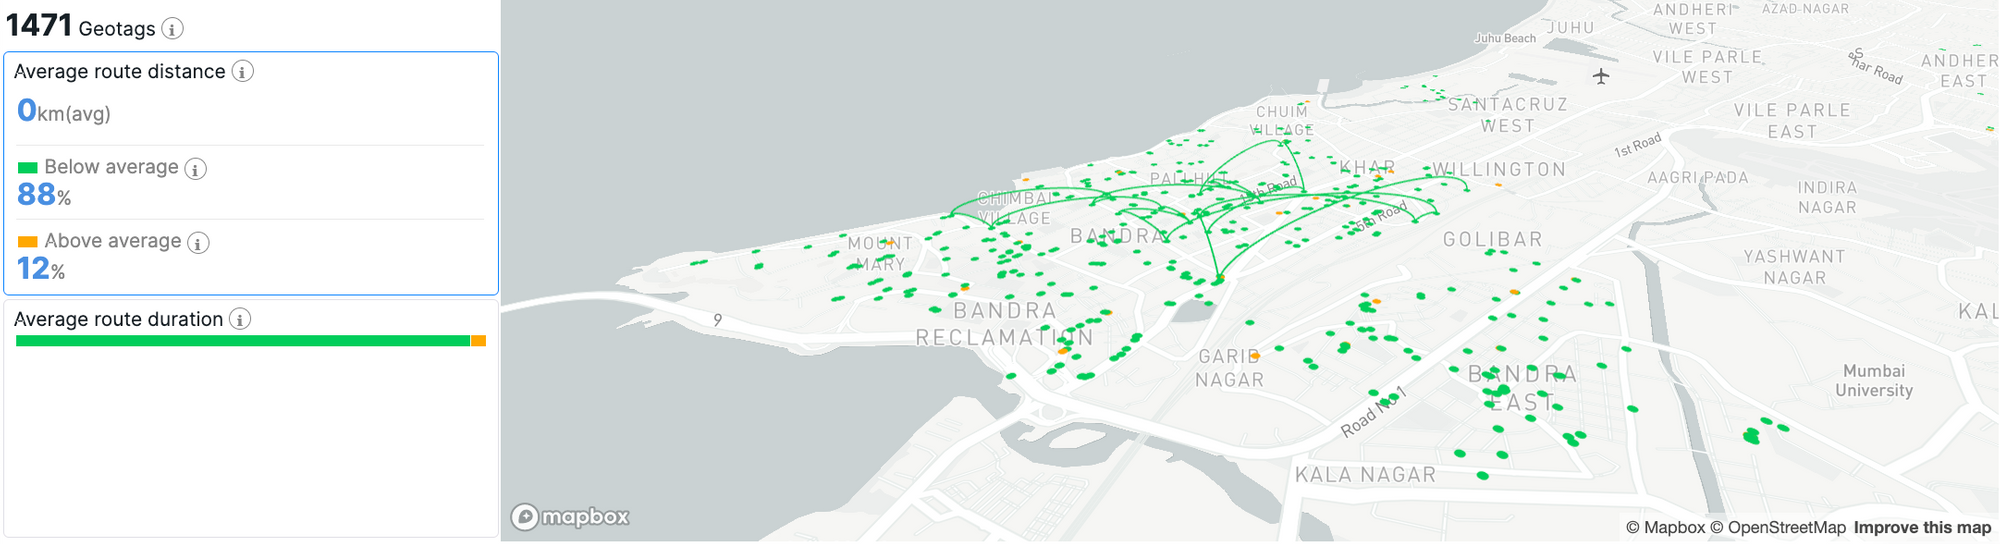 Visualize your fleet's route with geotags
Get started now
Learn more about Insights in our guide, or dive right in: Insights is now available in the HyperTrack dashboard. And watch this space—we’ll continue to add additional visualizations and ways to explore. It’s never been easier to learn from your data and create value with the location logistics cloud.
Header photo by Dennis Kummer on Unsplash
Subscribe to HyperTrack Blog: Imagine. Build. Repeat.
Get the latest posts delivered right to your inbox
Recommend
About Joyk
Aggregate valuable and interesting links.
Joyk means Joy of geeK