

Boosting user conversion with UX performance wins
source link: https://engineeringblog.yelp.com/2021/01/boosting-user-conversion-with-ux-performance-wins.html
Go to the source link to view the article. You can view the picture content, updated content and better typesetting reading experience. If the link is broken, please click the button below to view the snapshot at that time.

Boosting user conversion with UX performance wins
Everyone loves graphs going up and to the right, unless they reflect your page load timings. This blog post is about curtailing higher page load times. Yelp for Business Owners allows business owners to manage their listing, respond to reviews, edit their business information, upload business photos, and more. Business owners can also purchase Yelp Ads and profile products to target local audiences and enhance their business’s presence on Yelp. In this blog post, you’ll learn about the ways we improved the UX performance of our ads purchase flow by dramatically reducing the load times. You’ll be able to apply the same tactics to your own flow and hopefully achieve results similar to ours:
Background
Our core ads purchase flow is a single-page React application powered by Python-based backend services and GraphQL. Over the past couple of years, it has grown from a four step process to a seven step process with new features to provide better ad campaign controls. However, as we added more features, performance suffered. Our page-load P75 timings increased from 3 seconds to 6 seconds for desktop users. This slowdown was even more pronounced for our mobile users due to increased constraints in network speeds and reliability.
It's a known fact that faster-loading pages directly benefit user conversion. We wanted to measure how much faster performance affected the bottom line and ran a lightweight experiment to measure the relationship between performance and user conversion. We made some backend optimizations to reduce page load timings by one second, and immediately observed a 12% relative increase in conversion rate. This early win gave us confidence in our future investments along with full buy-in and support from our product team.
Performance Metrics
The first step in our performance effort was to set up a framework that would standardize the metrics and logging across all our flows. We decided to target two specific metrics:
First Contentful Paint (FCP)
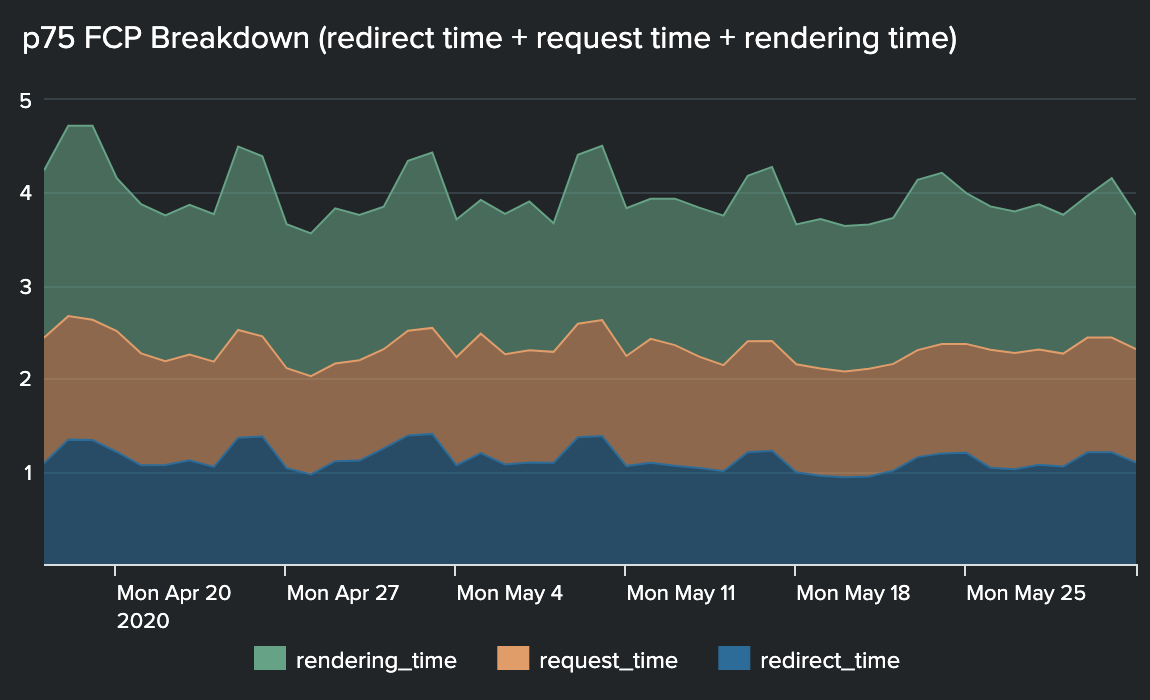
FCP is the browser’s time spent rendering any image or text after sending the page load request. It is widely accepted as a key metric in the industry to measure your web page’s performance. Targeting FCPs was critical because it hints to the user that their page is starting to load. During our experimentation, we found that a user was much more likely to leave our site during a page load than after they saw any content, even if they only saw a loading spinner. Since a page load event depends on multiple systems (such as web browser, routing layers, authentication proxies, etc.), we further broke down our FCP into the following units to help categorize our efforts:
-
Redirect time: How long the browser spent following redirects (HTTP 303s).
-
Request time: How long the request-response cycle took for the main request inside Yelp servers.
-
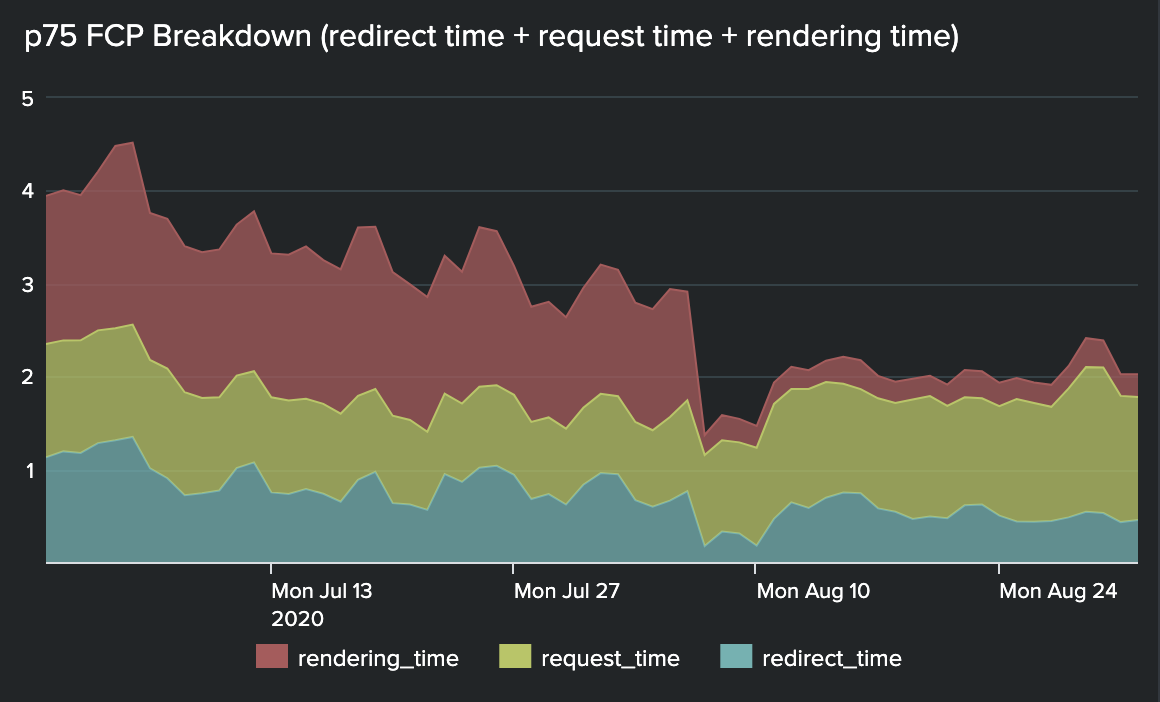
Rendering time: How long it took for the browser to render the first contentful paint after receiving the initial response.
The image below shows the breakdown of our timings in the units discussed above.
Time to Interactive (TTI)
This metric measures the time spent by the browser to fully load a page. It captures any client-side rendering logic and async data fetching required to render the complete user experience. At Yelp, we call this metric Yelp Page Complete (YPC). It is critical to capture TTI since many of our applications render a shimmer or a page shell after the initial page load, and then the respective components fetch their data. TTI helps capture the entire user experience timings.
We have several other similar flows on the biz site with their own data fetching strategy. To make the integration convenient across all of them, we created a shared JavaScript package to consolidate all of the logic related to logging, polyfills, batching/throttling of logging related AJAX calls, etc. In the end, the integration only required adding a couple of lines to start logging all the performance metrics.
Performance Tooling
We relied on many tools that were critical to our effort that are worth mentioning here:
Zipkin
OpenZipkin is an open-source distributed tracing system set up at Yelp. It helped identify bottlenecks during the request lifecycle inside Yelp servers. Our request travels through multiple services, and this tool was indispensable in identifying potential optimizations on the backend. Here is a sample Zipkin trace:
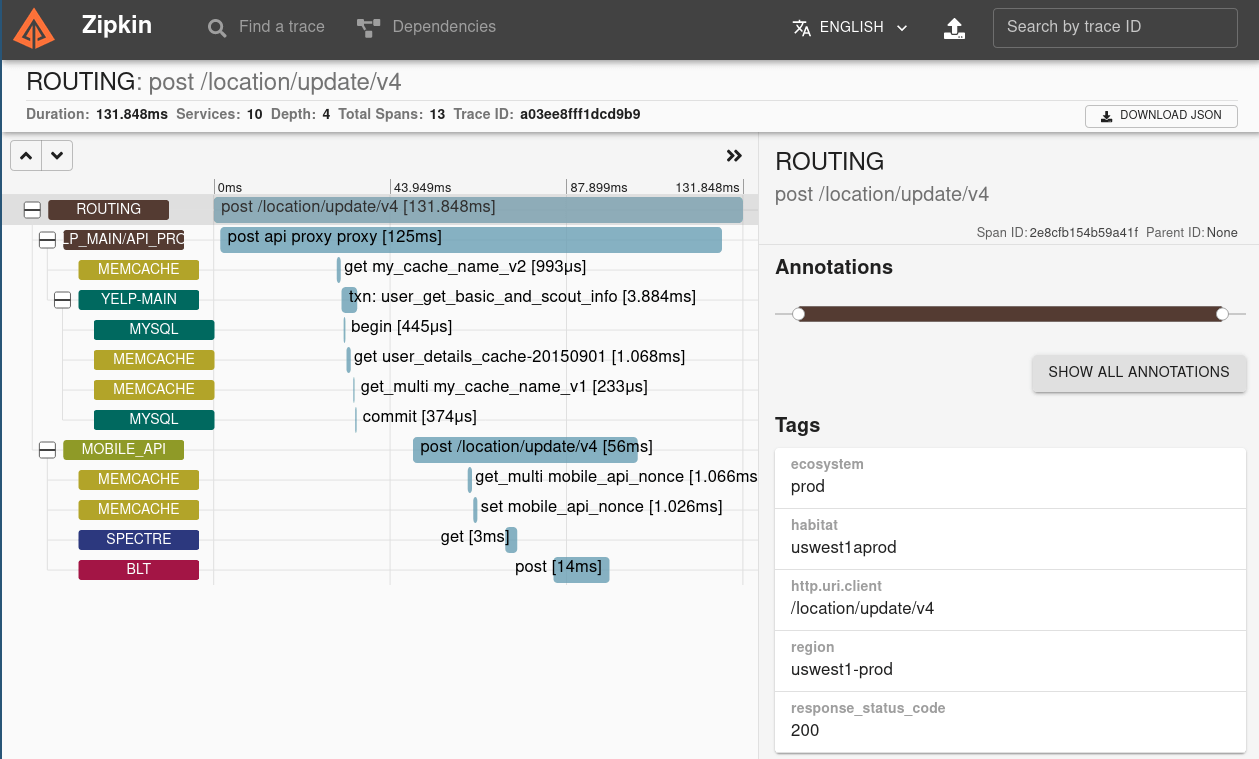
Source: https://zipkin.io/
Webpack Bundle Analyzer
Webpack Bundle Analyzer helped us visualize our JavaScript bundles’ content with an interactive zoomable treemap. This tool was crucial to identify optimizations in our frontend assets that we discuss later. Below is a sample treemap interaction from the plugin’s Github repository:
Source: https://github.com/webpack-contrib/webpack-bundle-analyzer
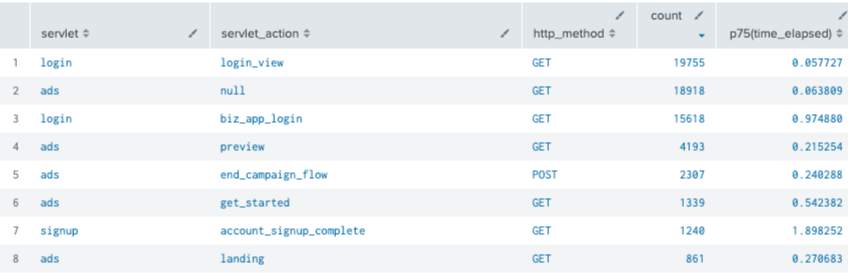
Splunk
We ingested all of our performance metrics in Redshift database tables and visualized them as Splunk dashboards. These helped us track our progress in real-time while deploying changes. Below is an example dashboard:
Chrome DevTools
Chrome’s tooling provided terrific insights into our frontend performance issues. We specifically relied on the flame charts under the Performance tab to identify where the browser’s main thread was blocking and how much time was being spent in our assets loading, parsing, and evaluation. Google Lighthouse also provided actionable opportunities and diagnostic information.
Deep Dive
After learning from the gathered metrics, we planned on tackling the performance issue on all fronts: backend, frontend, and infrastructure. Below are a few things that are worth sharing:
Frontend Optimizations
Our JavaScript bundles had been growing slowly due to continuous feature additions over the past couple of years. Yelp’s in-house tooling already enforced general best practices such as gzip compression, bundle minification, dead code elimination, etc. So most of the issues were part of our application setup. After analyzing our bundle using the tooling above, we employed various techniques listed below to reduce our gzipped bundle size from 576 KB to 312 KB, almost 50% reduction!
-
Code Splitting: Serving code for all the seven pages of our purchase flow during the initial page load was undoubtedly wasteful. We opted to use loadable components to create separate chunks for different steps that would load on demand. This chunking helped reduce our bundle size by 15%. However, loading these assets on demand added a small delay on every page load, so we wrote a helper function to preload all the chunks using the useful requestIdleCallback function to avoid any UX behavior changes.
-
Tree Shaking: Yelp’s recent default Webpack settings enable dead code elimination. Looking into our bundle treemaps, we realized that tree shaking wasn’t working for some of our older packages because they were still using older build settings. So, a hunt began to figure out all such packages, and we ended up further reducing our bundle size by 30% by just upgrading their build.
-
Replacing Packages with Heavy Footprint: We identified a few packages being used infrequently in our code that occupied an unreasonable portion of our bundle. The primary example was moment.js that was used only twice but occupied 5% of the bundle. We were able to replace it with date-fns, which is tree-shakeable. Fun fact: the project status of momentjs now itself recommends using alternatives.
-
Deduplicating Packages: We use Yarn for our dependency management, and (before Yarn V2) it didn’t deduplicate the packages with overlapping ranges. For our large apps, deduplication had a noticeable impact on our bundle sizes. Yarn V2 helped solve this problem for us.
-
Reducing Component Re-rendering: React profiler identified that specific core page components such as the navigation bar were re-rendering wastefully during the page load. This re-rendering blocked the main thread and delayed FCP. We resolved this by adding memoization on top of these components.
Server-side Optimizations
Yelp’s growing service architecture presented some interesting roadblocks. As the request traveled through multiple services (including a monolith), its lifecycle was complicated. For example, the page-load request went through 3 services and depended upon up to 5 downstream services for fetching data. The efforts listed below helped us bring down our request timings:
-
Removing Proxy Layers: All biz site requests were proxied through Yelp’s monolith because it handled authentication and authorization for logged-in business owners. This proxy was expensive. Earlier this year, we packaged up the authentication and authorization business logic into a reusable Python package. This optimization entailed integrating with that package, setting our service up to accept traffic directly from our routing layer, and rolling it out carefully via dark-launching. It helped us save 250ms from our request time along by getting rid of legacy code.
-
Parallelizing Network Calls: We rely on several downstream services for fetching data during page load. Zipkin helped us uncover that we had laid out some of our network calls in a blocking manner that slowed down the entire request. At Yelp, we use Futures built with Bravado, which allows us to send network requests concurrently. We rewrote the request code to fire off all the network requests at the top of business logic and avoided starting any new network request later in the code. It helped us shave 300ms from our request timings. While this issue can regress, we documented best practices for this behavior to help prevent them in the future.
-
Eliminating Redirects: Legacy pages, old flows, third-party blog posts, etc., contributed to redirects before the user landed on the final URL/page. These redirects were a few seconds in some cases for our mobile traffic. We documented all of the redirects using the HTTP Referer header and tackled them accordingly.
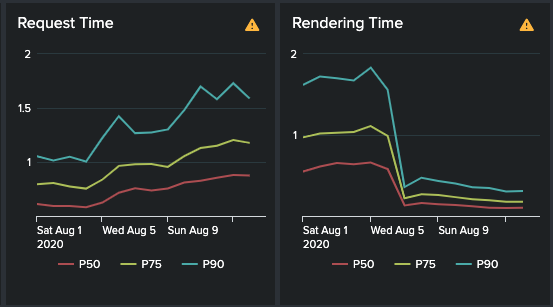
-
Server-side Rendering: Before this effort, our flow was rendered entirely client-side, i.e., we didn’t send any HTML in the request’s response. We only sent the JavaScript bundle and relied entirely on the browser and React app to generate HTML for serving the page’s content. We identified that this adversely affected our FCP, especially on mobile clients with limited CPU and memory. We already had a (React) component rendering service based on Hypernova set up at Yelp. We integrated with that service and started rendering the first page’s markup from the server. We immediately saw significant benefits for all the clients. We transferred the rendering load to the server, as evident in the graphs below, but the rendering time took a steep drop and the net impact was lower FCP time. Also, long gone was our loading shimmer!
-
Pre-warming Cache: We have a few computationally expensive tasks in our requests, such as building a category tree object created by reading configurations from disk. We cached these objects in memory, but we identified that our higher latency P90 requests still suffered because they would always get a cache miss. We created an internal endpoint whose sole responsibility was to warm up all the caches and create expensive cacheable objects. We used a uWSGI hook that would be called every time a worker was created to make a call to this internal endpoint. It helped bring our P95s down by almost 2 seconds across all clients.
-
Vertical Scaling: Last but not least, we also tried deploying our service and its dependent services on highly performant z1d.6xlarge EC2 instances. We saw marginal improvements (up to 100msec) on page load timings, but some of the other computationally expensive AJAX APIs saw more significant gains. For example, our POST endpoint responsible for purchasing the products got 20% faster, leading to lower timeouts.
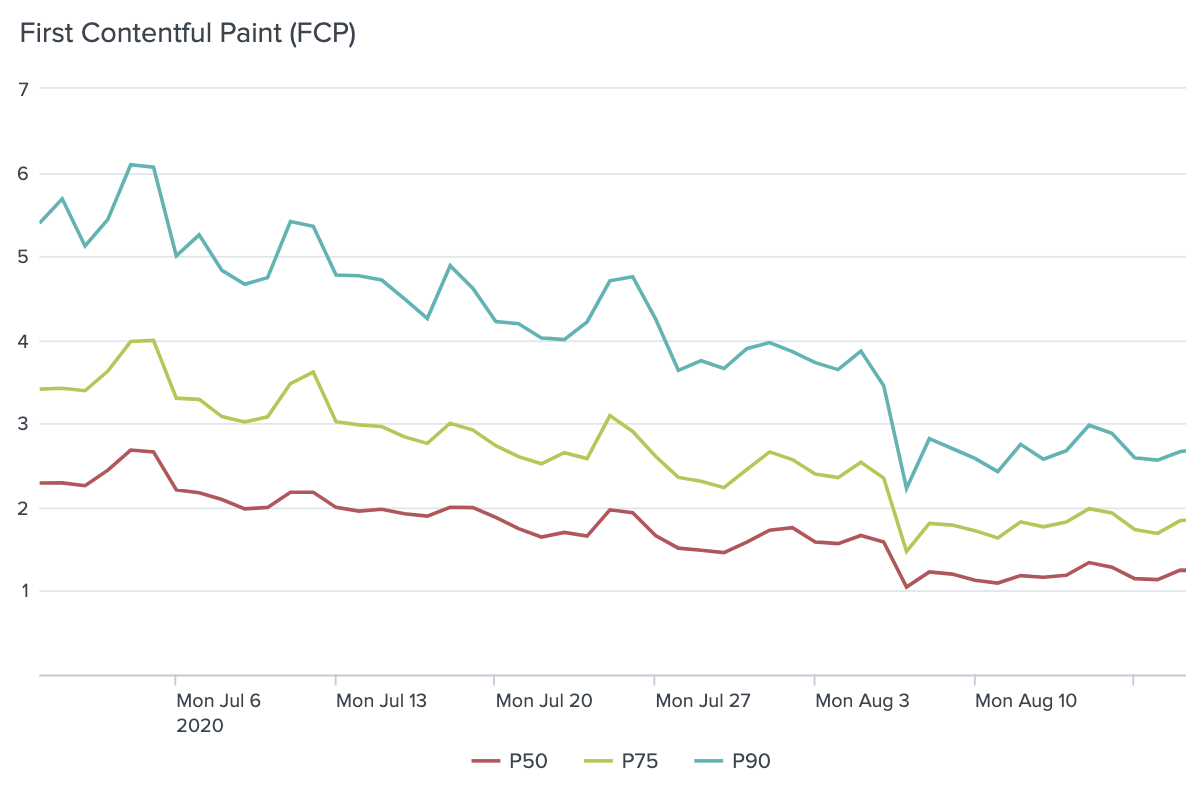
Final results
After four months of focused effort with a dedicated engineering team, we achieved results that made this investment worthwhile. It was not just a win for our conversion metrics, but also for our customers, who now experienced substantially faster loading pages.
The keys results that we achieved for our ads purchase flow:
- We reduced our P75 FCPs from 3.25s to 1.80s, a 45% improvement.
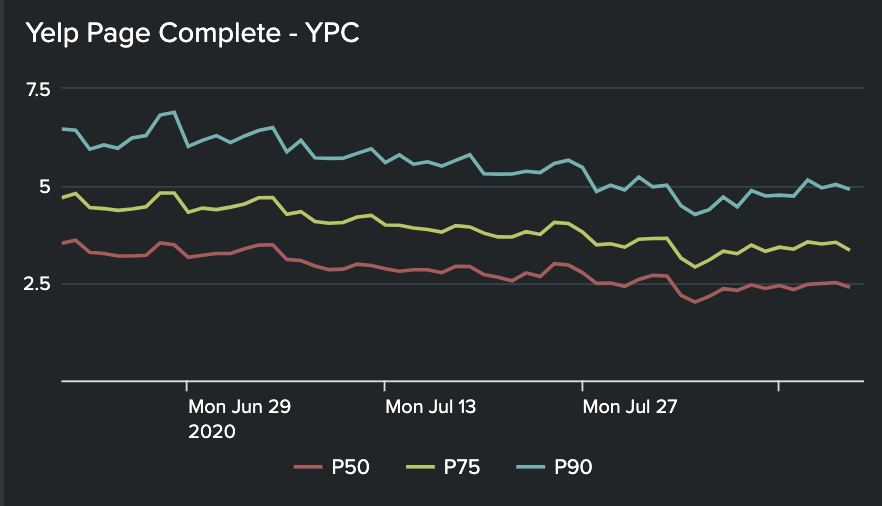
- We reduced our p75 YPCs from 4.31s to 3.21s, a 25% improvement.
- We saw up to 15% lift in our conversion rate.
Below are a couple of graphs that show our progress over time:
Acknowledgements
- Shoutout to my teammates on this project: Thibault Ravera, Bobby Roeder, Frank She, Austin Tai, Yang Wang and Matt Wen.
- Shoutout to Dennis Coldwell, Aaron Gurin, Blake Larkin and Alex Levy for technical review and editing.
Become an Engineer at Yelp
We work on a lot of cool projects at Yelp, if you're interested apply!
View JobRecommend
About Joyk
Aggregate valuable and interesting links.
Joyk means Joy of geeK