

vRealize True Visibility Suite Essentials: Bigger, Stronger, Faster Dashboards u...
source link: https://blogs.vmware.com/management/2021/01/vrealize-true-visibility-suite-essentials-bigger-stronger-faster-dashboards-using-vrealize-operations.html
Go to the source link to view the article. You can view the picture content, updated content and better typesetting reading experience. If the link is broken, please click the button below to view the snapshot at that time.

vRealize True Visibility Suite Essentials: Bigger, Stronger, Faster Dashboards using vRealize Operations
Welcome back to The Essentials: vRealize True Visibility Suite. Last time we talked about the importance of relationship mapping in vRealize Operations and the extensibility that management packs bring to the platform. This week we’ll be exploring another foundational component that allows you to customize your monitoring experience.
While there is great information that individual management packs bring to the table, if you are only using the out-of-the-box reports and dashboards, you’re not seeing the full picture. Creating custom dashboards gives you the ability to match the custom environment that you’ve built in your datacenter.
Today we want to show you how to build a few different custom dashboards to get you comfortable with creating a custom view of your environment. One thing I like to let everyone know before they get started creating dashboards is, it really is as easy as it looks. Creating this dashboard in your own environment should take no longer than 5-10 minutes.
Follow along as we show you how to create some of our favorite custom dashboards. First, let’s take a look at creating a dashboard for Full Stack Relationships.
Full Stack Relationships Dashboard
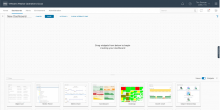
Figure 1: Start with a blank dashboard after clicking “create dashboard”
Figure 2: add in an object list
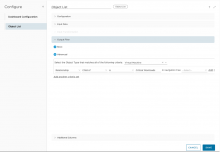
Figure 3: I have a custom group called “Critical Workloads”. You can either use your own custom group or choose the VM’s you would like to add manually. I want to bring in all virtual machines that are children of this group so that I can switch between them, as needed.

Figure 4: Add in an “object relationship (advanced)” widget
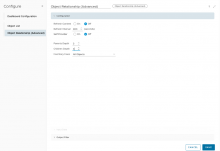
Figure 5: Edit the Object Relationship widget and change parent and children depth as necessary for the dashboard

Figure 6: Click on “Show Interactions” and drag from the object list to the relationship widget.

Figure 7: Click “Save” and the dashboard is done. I can now click on any of the virtual machines that are members of the “critical workloads” group, and I can see the full object relationships from top to bottom. I have physical compute, host, VM, datastore, physical storage, database, and any other hardware/software running like Microsoft IIS, or an F5 BIG-IP device.
First Pane of Glass Dashboard
Some call this dashboard their morning cup of coffee dashboard. A place where they can look out from the mountain top, and see a high level status of their environment.
Figure 8: This First Pane of Glass dashboard cascades from the MS SQL Database all the way to the physical storage volume.
Figure 9: Using the same method as in the first dashboard, I add an object list widget and use the same custom grouping as before in exactly the same manner. This time I add a Scoreboard, a Health Chart and a Workload Pattern widget.
Figure 10: I want the Object list to drive the other widgets, so I click on Show Interactions and drag from the Object list to the other three widgets.
Figure 11: This can be done with any other object that vRTVS brings in. Here we can see I have added the blade or rack server, the related datastore, and related physical storage.
Figure 12: It should be noted that when relating two object lists, we should pay attention to the parent-child relationships and the depth of the relationship.
Thanks for joining us again as we explore the essentials of vRealize True Visibility Suite. For more ideas on custom dashboards, check out our favorite dashboards on VMware {code}, or get started on a trial of vRealize True Visibility Suite today!
This blog has been remixed by: Tim George & Peter Haagenson
Related Posts:
 vRealize Orchestrator (8.2+ Feature Set) Integration…
Recommend
-
11
...
-
12
vRealize True Visibility Suite: The Essentials Continued Peter Haagenson posted December 8, 2020...
-
15
eBook Now Available: The Gorilla Guide to Network Visibility with vRealize Network Insight Sehjung Hah poste...
-
15
Unified Visibility Across Clouds with vRealize OperationsLet’s face it, the modern datacenter is no longer this monolithic structure that’s immobile, heavy, and slow to scale as you search for more physical real estate to deploy your servers,...
-
5
vRealize Operations Dashboards Made EasyvRealize Operations includes a wide range of customizable dashboards to get you started with managing your Multi-C...
-
6
vRealize Operations Dashboards Made EasyIn my previous blog post, I introduced the new video series “
-
17
Part 6-7 Diving deeper into Views and WidgetsIn my previous blog post, I introduced parts 3 through 5 of the...
-
15
Part 8-10 Dashboard Sharing with your Team and BeyondIn my previous blog post, I introduced...
-
12
vRealize Operations vRealize True Visibility Management...
-
14
Sustainability Dashboards in vRealize Operations 8.6Sustainability is one of the key priorities for every enterprise organization across the globe right now. Virtualization has played a crucial role in data center consolidation, thereby helpi...
About Joyk
Aggregate valuable and interesting links.
Joyk means Joy of geeK