

Sustainability Dashboards in vRealize Operations 8.6 - VMware Cloud Management
source link: https://blogs.vmware.com/management/2021/10/sustainability-dashboards-in-vrealize-operations-8-6.html
Go to the source link to view the article. You can view the picture content, updated content and better typesetting reading experience. If the link is broken, please click the button below to view the snapshot at that time.
Sustainability is one of the key priorities for every enterprise organization across the globe right now. Virtualization has played a crucial role in data center consolidation, thereby helping reduce the overall hardware footprint. It enabled savings in power consumption and floor space in data centers. This improved the overall efficiency and curbed carbon emissions resulting from IT infrastructure growth. Referring to VMware Environmental Social Governance Report 2021, customers using VMware solutions have avoided 1.2 Billion Metric Tons of Carbon Emissions since 2003. If this value could be quantified for each customer, it could be a great asset for organizations as they reach towards achieving their sustainability goals.
The all-new Sustainability dashboards in vRealize Operations 8.6 do just that! They help you identify Carbon Emissions reduced by Virtualization and also provide guidance on further optimizing your data center efficiencies through carbon footprint reduction.
Sustainability in your Data Center
There are three important aspects of sustainable data center operations – Green Supply, Clean Demand and Lean Operations. Lets discuss each and how they will change the way you look at your data center.
1.Green Supply
This represents the hardware & software infrastructure that is optimized. Some examples of opportunities to optimize the supply are listed below:
- Physical Array vs vSAN – HCI consumes less power and data center footprint.
- Physical Network vs NSX – Physical FW, LB, etc. is less “green”
- Islands of hardware due to physical air gaps -> NSX – Reduce the hardware-based networking components with more efficient and flexible software based components
- Ageing hardware – Newer CPUs have more cores and are more power-efficient
- Physical Desktop vs VDI with the thin client – More energy-efficient and also improves security.
- Incorrect power management settings – Many customers like to set power management to Max, the legacy of old best practices are no longer the best option.
- Oversized cluster, datastore, storage arrays, physical switches, SAN fabric, network devices – Rightsizing for efficiency and power savings
- Unused resources (physical servers, network devices, network ports) – Removing old equipment which is often forgotten in large environments.
- A smaller DC footprint means less land usage.
2. Clean Demand
This represents genuine demand for resources, as required by either business or IT. A few examples of opportunities to clean up and reduce the demand include, but are not limited to:
- Orphaned files, VMDK, VM, LUN – They may not even appear in the inventory but are wasting resources.
- Powered off VM – Not orphaned as it appears in inventory, but are they needed?
- Snapshot, both at VM level and storage level. Old snapshots should be removed.
- Idle VMs – Workloads that are running in the data center, but not being used for any business requirements and hence consuming very few resources.
- Unused VM – They may not be idle, but no business usage anymore. The VM owner may have left the company
- Oversized VM – Again rightsizing to save resources.
- Runaway VM – Can consume excessive resources for numerous reasons (e.g. OS or software bugs such as memory leaks or CPU locks).
- Unmap files at storage level – Find and remove orphaned disks.
- Reduction of agents – While each agent may be light in resource, collectively they can result in high overhead.
3. Lean Operations
This means running your operations with minimal overhead and buffers. Examples can include optimizing operations across processes, people, and tools:
- SLA-based Operations – You can go beyond the simple Availability SLA and introduce Performance SLA and Compliance SLA. Using the Class of Service feature, they provide differentiated services.
- Business-aware Operations – Using a proper inventory of VMs, grouped by Business Units and Applications, you can show how the business runs on the IaaS platform.
- On-Demand scaling – Only scale-out WHEN needed
Understanding Sustainability in vRealize Operations 8.6
Total Carbon Emissions footprint and Carbon avoidance have become two important data center KPIs for all organizations of all sizes. vRealize Operations helps by providing the observability required to calculate and understand what an organization’s carbon footprint looks like. It collects power consumption metrics (energy in joules and computes power in watt-hours) for ESXi Host and VM objects. These metrics can be used to calculate power savings and Carbon emissions across the data center.
There are a few out-of-the-box default settings that are used to make sustainability calculations.
• Power consumption of a small server (1 socket, 10 cores, 32 GB RAM) = 0.1 KW
• CO2 emission per KWh* = 0.709 Kg ( Reference values from Greenhouse Gas Equivalencies Calculator )
• Cost of Power* = $0.106 per KWh (Based on contiguous US average value – Reference from VMware TCO Reference Calculator )
*These values can be customized based on regional standards, refer to the custom values section at the end of this article for more details.
Sustainability Dashboards in vRealize Operations 8.6
The new Sustainability features can be accessed from the home page of vRealize Operations 8.6 under the “Manage Configuration” pillar.
This link will take you directly to the new Sustainability home page which provides detailed information and links to all of the sustainability dashboards…and there’s a lot of them!
These dashboards are classified under the same three aspects of sustainable data center operations we discussed above – Green Supply, Clean Demand, and Lean Operations. Let’s look at four new sustainability dashboards and how they can be used for tracking your sustainability goals.
Dashboard # 1: CO2 Emission Savings – Carbon Efficiency with Virtualization
Use cases addressed:
- Identify carbon footprint reduction achieved with Virtualization
- Identify current power consumption, Carbon emission, and Electricity cost saving
This dashboard shows you how much you’ve reduced your carbon footprint by virtualizing with vSphere. It compares what this workload would have looked like on a physical host compared to the VM. For example, we use the simple calculation of comparing power consumption of all the physical workloads if these VMs were physical, with the current power consumption from ESXi hosts hosting these VMs.

The dashboard also includes a number of data points associated with your data center that you will find interesting and valuable.
- Power Consumed before Virtualization = Number of VMs x 0.1 in KWh
- Power Consumed after Virtualization = Power Consumed by all ESXi hosts in KWh
- Carbon Emissions before Virtualization = Power consumed in KWh before Virtualization x 0.709 Kg
- Carbon Emissions after Virtualization = Power consumed in KWh after Virtualization x 0.709 Kg
- Electricity Cost-saving = Difference in Power Consumption before and after Virtualization in KWh x $0.106
The dashboard even provides the live power consumption and carbon emissions over the last 24 hours for your entire vSphere environment. The calculations are pretty conservative, so your actual savings may be much more!
Dashboard # 2: Environmental Impact of Idle VMs
Use cases addressed:
- How to optimize your existing data center footprint by identifying and reclaiming unused resources taken up by Idle VMs.
- Identify ways to offset the environmental damage caused by wasted resources associated with Idle VMs.
Idle VMs are one of the main causes of wasted resources in anyone’s data center. Of course, vRealize Operations can quickly identify idle VMs and now even show you the power consumed by them. Even though they consume very little power as compared to other VMs, the cumulative effect over a period of time and increasing numbers of idle VMs can have a very negative effect on your carbon emissions. Something we are all trying to avoid!
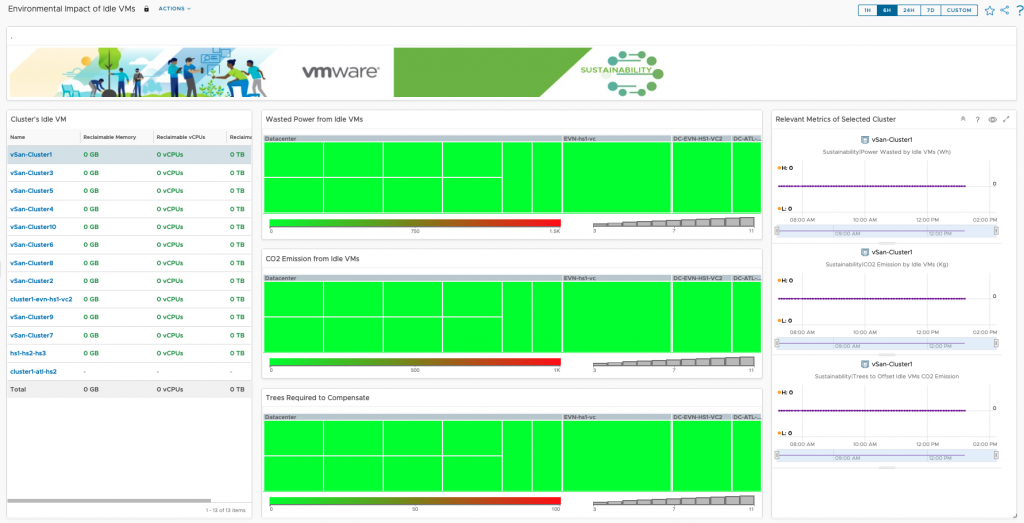
This dashboard provides heatmaps showing wasted power and carbon emissions from idle VMs in each cluster. If a vSphere cluster has very high carbon emissions (beyond the set threshold), there are numerous actions you can take right from vRealize Operations:
- Power off or delete the idle VMs and thus reduce carbon emissions.
- If the idle VMs cannot be reclaimed due to business or operational reasons, you may identify the number of trees which needed to be planted to compensate for the environmental damage done by these idle VMs. This is available in the heatmap widget – “Trees Required to Compensate”. How cool is that?!
Assumption:
• Tree offset for CO2 Emission* = 36.4 pounds of carbon per tree ( Refer to Greenhouse Gas Equivalencies Calculator) which is equivalent to 36.4/2.2046 Kg of carbon per tree
*This value can be customized based on regional standards, refer to the custom values section towards the end of this article.
Dashboard # 3: Carbon Transparency
Use cases addressed:
- Identify Green Clusters in the environment…we like those!
- Compare clusters and data centers based on carbon emission or power consumption.
While planning to provision a VM, the most common criteria for placement used to be performance or cost. But now, another criterion of provisioning is becoming increasingly relevant… Provisioning to the “Greenest” cluster.
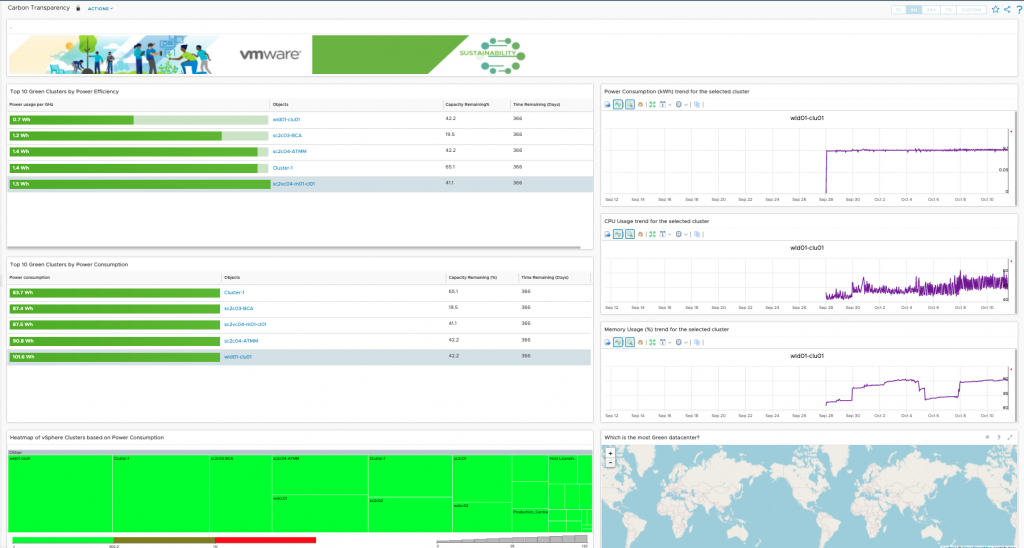
In this dashboard, we list the Top-10 “Greenest” vSphere clusters based on Power efficiency. We calculate power efficiency as power consumed in watt-hour (Wh) per GHz of CPU Usage in the cluster. To help with the decision on provisioning to the greenest cluster, you can also see the Capacity Remaining and Time Remaining for each of these clusters. Upon selecting a cluster, you will see the relevant power consumption, CPU usage, and Memory usage trends over the last month to further help in provisioning decisions.
It also provides a list of the Top-10 “Greenest” Clusters based on power consumption. Note that this is based on total power consumption, hence larger clusters with a larger number of running VMs will be having higher power consumptions obviously.
If you have physical data centers spread across multiple locations, you may use the geo widget in this dashboard to add them to the world map widget based on their location. You can do this easily by configuring Geo Tags for the objects – data center or vSphere clusters. Please refer to vRealize operations user guide on configuring geotags.
Dashboard # 4: Green Supply
Use cases addressed:
- Identify Overheads and buffers that can be reduced
- Identify aging hardware that would be less energy efficient
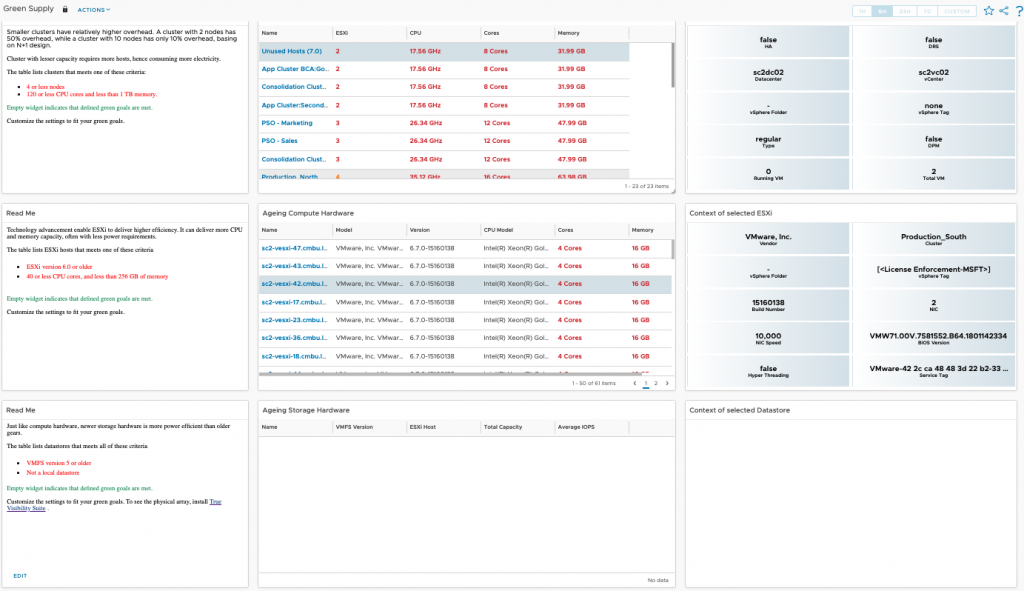
Small clusters have relatively higher overhead based on simple N+1 design. A cluster with 2 nodes has 50% overhead, while a cluster with 10 nodes has only 10% overhead. Thus clusters with a smaller capacity will consume more power to maintain these overheads. The widget for “small clusters”, helps highlight vSphere clusters which are either having four or fewer nodes or, less than 120 CPU cores and less than 1 TB memory.
Technology advancement enables ESXi to deliver better and better efficiency and thus the latest versions can deliver more CPU and Memory capacity with fewer power requirements. So the widget of “Aging Compute Hardware” shows you all your old ESXi hosts which are less energy efficient. It filters ESXi hosts which are on versions 6.0 and older and also which are with <40 CPU cores and <256 GB of memory.
Just like compute hardware, newer storage hardware is more power-efficient than older ones. So the widget of “Aging Storage Hardware” will filter all old datastores which are less energy efficient. It filters all datastores which are on VMFS versions 5 and older (excluding local datastores).
You of course may customize any of these settings to fit your green goals. Also, if these widgets are blank…congratulations your green goals are met!
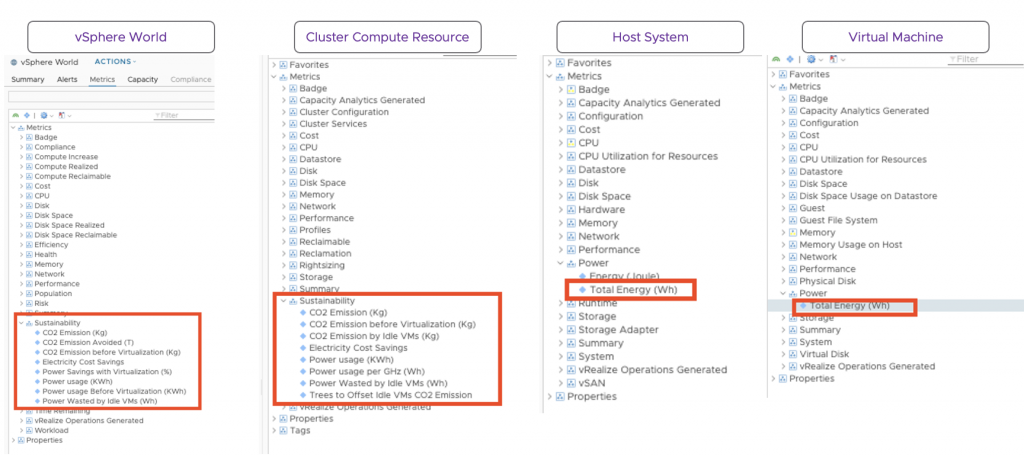
New Metrics used for Computing Sustainability
So you’ve seen some of the dashboards, but where do these numbers come from? vRealize Operations utilizes ESXi power metrics from vCenter for its calculations. Energy in joules is the metric available in vRealize Operations which represents the summary of all energy data points collected by vCenter in 5 minutes. The summary value is divided by 3600 to get the Total energy value in Watt-hour.
Total Energy in Watt-hour (Wh) = Energy in joule / 3600
Plus, there are 18 new sustainability metrics added in vRealize Operations 8.6 for different objects – Virtual Machine, Host system, Cluster compute Resource, and vSphere World. Check them out below:
Configuring Sustainability for your Country, Region, or Data Center
As we said above the following constant values are used for computed sustainability metrics, but what if you need to modify them? In this section, we show you how to do that. Here are the default values in question.
- CO2 Emission per KWh = 0.709 Kg ( Reference values from Greenhouse Gas Equivalencies Calculator )
- Electricity Rate = $0.106 per KWh ( Based on contiguous US average value – Reference from VMware TCO Reference Calculator )
- Tree offset for CO2 Emission = 36.4 pounds of carbon per tree ( Refer to Greenhouse Gas Equivalencies Calculator) which is equivalent to 36.4/2.2046 Kg of carbon per tree
You may modify these values based on your regional standards by creating custom properties for the relevant cluster compute resource objects.
Follow the steps below to add custom values to the above parameters:
- Browse to Environment > Inventory > Object Types > Cluster Compute Resource
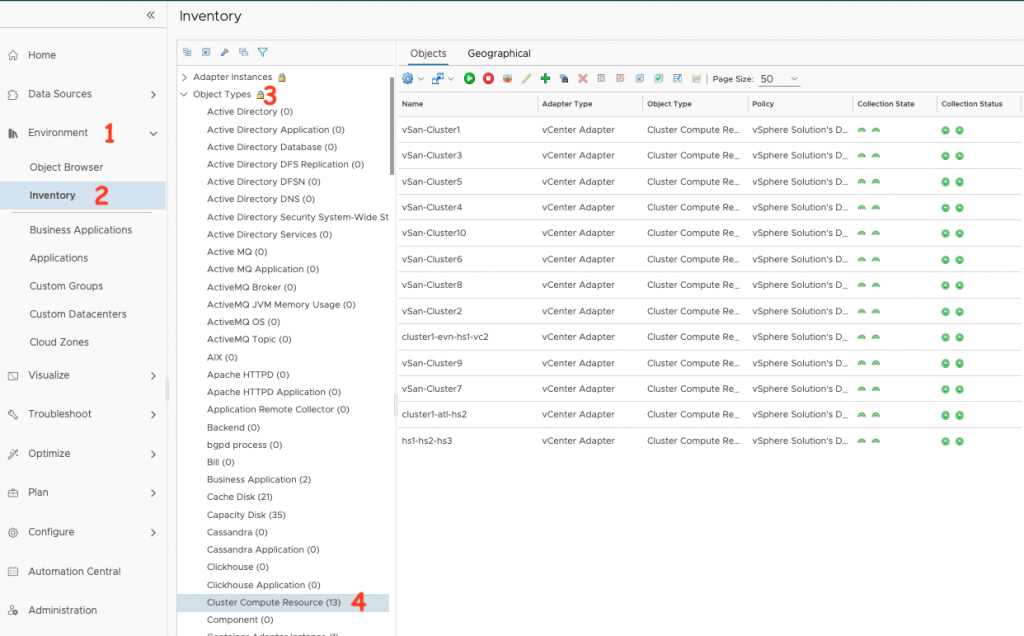
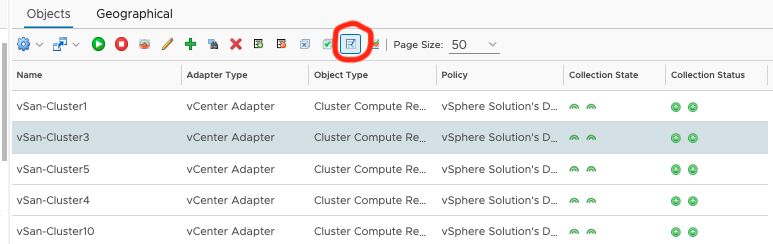
- Select the Cluster compute resource object for which you will need to add custom values and click on “Add/Edit Custom Property” from the options.
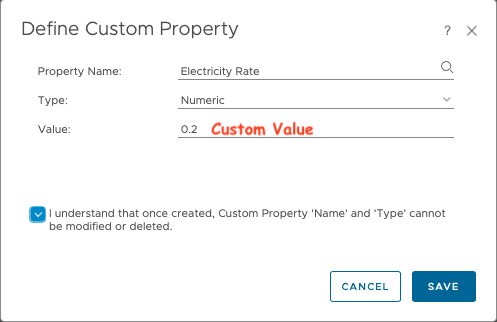
- For custom values for Electricity rate, add the custom property as below:
- Property Name: Electricity Rate
- Type: Numeric
- Value: Custom number as required
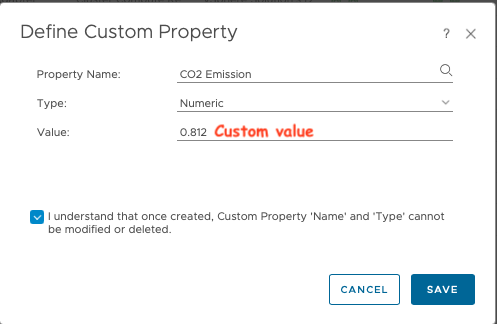
- For custom values for CO2 Emission rate, add the custom property as below:
- Property Name: CO2 Emission
- Type: Numeric
- Value: Custom number as required
- For custom values for Trees to offset add the custom property as below:
- Property Name: Trees to Offer
- Type: Numeric
- Value: Custom number as required

One more thing
If you find vSphere Clusters with zero values in the Top-10 Green clusters on the Carbon Efficiency Dashboard it means vCenter is unable to collect the power settings of the physical machine. Maybe the host does not support this collection. If the power metrics are not available for specific hosts, it will impact the power consumption metric. As a workaround in such cases and to avoid listing vSphere Clusters with zero value for power consumption metrics, a filter can be added to the Top-N Widget to list only the vSphere clusters having value for Sustainability|Power usage per GHz (Wh) greater than “0” – refer to below image for configuring this.
Utilize these sustainability dashboards within vRealize operations 8.6 and see how much you have already contributed to a greener planet and identify what further can be done to optimize the data center with more opportunities for carbon emissions reduction.
vRealize Operations 8.6 is another big release and Sustainability dashboards are just one of the features introduced in the release. For more information, check out the product page and release notes. Don’t forget to check back here often as well as our YouTube channel as we will bring you more information on these features in the coming weeks. As always you can find loads of information about vRealize Operations and other great VMware products at pathfinder.vmware.com.
Varghese Philipose is currently working as Staff Technical Account Manager in the METNA region based in Dubai, been part of the team since 2012. He is a member of the CTO Ambassador Program under the Office of CTO within VMware since 2018. He is also a Member of the vROps Ambassador Program 2021 and also vExpert Cloud management 2021. Have been a speaker at VMworld Europe 2018, 2019, and 2021. His Certifications include VCAP-DCV 2021, VCP on Datacenter Virtualization, Network Virtualization, Cloud Management & Desktop Virtualization, vExpert (2019- 2021 ), vRealize Operations Specialist 2019 & Cloud Services Provider Specialist 2019. He is very passionate about working on vRealize Operations and leads an internal program to drive adoption and value-realization with vRealize Operations among TAM customers in EMEA. Being recognized as a specialist on vRealize operations, he has delivered several workshops and sessions for customers in APJ & EMEA along with the Product Management team.
Recommend
About Joyk
Aggregate valuable and interesting links.
Joyk means Joy of geeK