

PySpark
source link: https://towardsdatascience.com/pyspark-f037256c5e3
Go to the source link to view the article. You can view the picture content, updated content and better typesetting reading experience. If the link is broken, please click the button below to view the snapshot at that time.
PySpark
Rendezvous of Python, SQL, Spark, and Distributed Computing making Machine Learning on Big Data possible
Shilpa was immensely happy with her first job as a data scientist in a promising startup. She was in love with SciKit-Learn libraries and especially Pandas. It was fun to perform data exploration using the Pandas dataframe. SQL like interface with quick in-memory data processing was more than a budding data scientist can ask for.
As the journey of startup matured, so did the amount of data and it started the chase of enhancing their IT systems with a bigger database and more processing power. Shilpa also added parallelism through session pooling and multi-threading in her Python-based ML programs, however, it was never enough. Soon, IT realized they cannot keep adding more disk space and more memory, and decided to go for distributed computing (a.k.a. Big Data).
What should Shilpa do now? How do they make Pandas work with distributed computing?
Does this story look familiar to you?
This is what I am going to take you through in this article: the predicament of Python with Big Data. And the answer is PySpark.
What is PySpark?
I can safely assume, you must have heard about Apache Hadoop: Open-source software for distributed processing of large datasets across clusters of computers. Apache Hadoop process datasets in batch mode only and it lacks stream processing in real-time. To fill this gap, Apache has introduced Spark (actually, Spark was developed by UC Berkley amplab): a lightning-fast in-memory real-time processing framework. Apache Spark is written in the Scala programming language. To support Python with Spark, the Apache Spark community released PySpark.
PySpark is widely used by data science and machine learning professionals. Looking at the features PySpark offers, I am not surprised to know that it has been used by organizations like Netflix, Walmart, Trivago, Sanofi, Runtastic, and many more.
The below image shows the features of Pyspark.

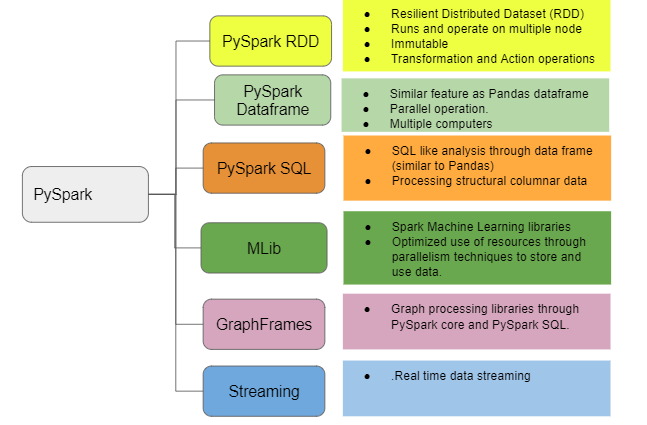
In this article, I will take you through the step-by-step process of using PySpark on a cluster of computers.
Environment Preparation
To practice PySpark in its real essence, you need access to a cluster of computers. I suggest creating a free computer cluster environment with Data Bricks Community edition at the below link.
After sign up and confirmation of email, it will show the “Welcome to databricks” page. Click on New Cluster in the Common task list.

- Enter details in the Create Cluster screen. For the Runtime version, make sure the Scala version is greater than 2.5 and the Python version is 3 and above.
2. Click on Create Cluster. It will take a few minutes for the cluster to start running.

3. Click on the cluster name to view configurations and other details. For now, do not make any changes to it.

Congratulations!! Your computer cluster is ready. It’s time to upload data to your distributed computing environment.
Data Source
I am going to use the Pima-Indians-diabetes database from the below link.
The dataset contains several medical predictor (independent) variables and one target (dependent) variable, Outcome. Independent variables include the number of pregnancies the patient has had, their BMI, insulin level, age, and so on.
It has a file diabetes.csv. Get it on your local folder and then upload it to the databrics file system (DBFS). Below is the navigation for uploading the file into DBFS.
- Click on the Data option on the left side menu
- Click on the Add Data button

3. In the Create New Table screen click on browse.

4. It will take to the directory path on the local disk. Select the diabetes.csv file you downloaded from the Prima-Indian-diabetes link mentioned above.

5. Click on DBFS. It will show files uploaded (diabetes.csv) into the databrics file system.

Congratulations!! You have successfully uploaded your file to the databrics file system. Now you are ready to save it on different nodes in the cluster through pyspark.
Notebook
Datbricks provide an online notebook to write pyspark codes. Click on New Notebook to open it.

Dataframe
So far the file is only in DBFS. Now comes the real action. In this section of the article, I am going to take you through the Pyspark dataframe.
When we say dataframe, it is obvious to think about Pandas. The major difference between Pandas and Pyspark dataframe is that Pandas brings the complete data in the memory of one computer where it is run, Pyspark dataframe works with multiple computers in a cluster (distributed computing) and distributes data processing to memories of those computers. The biggest value addition in Pyspark is the parallel processing of a huge dataset on more than one computer.
This is the primary reason, Pyspark performs well with a large dataset spread among various computers, and Pandas performs well with dataset size which can be stored on a single computer.
But this is not the only difference between Pandas and Pyspark data frames. There are some not so subtle differences in how the same operations are performed differently between Pandas and Pyspark.
The below table shows some of these differences
Now that the comparison of Pandas and Pyspark is out of our way, let’s work on the Pyspark dataframe.
Below lines of code will create a Pyspark data frame from the CSV data in DBFS and display the first few records. Notice how

Like Pandas, a lot of operations can be performed on a Pyspark data frame. Below are some examples.
printSchema: Shows the structure of the dataframe i.e. columns and data types and whether or not a null value is accepted.

columns: Showscolumn names.
df.columns

count: Shows count of rows.
df.count()
Output: 768
len(<dataframe>.< columns>): Shows count of columns in dataframe.
len(df.columns)
Output: 9
<dataframe>.describe(<column name>).show(): Describes mentioned column.
The below code describes the Glucose column.
Output: It shows statistical values like count, mean, standard deviation (stddev), minimum (min), and maximum (max) of Glucose values.

select: Shows selected columns from the dataframe.
The below code will select only Glucose and Insulin values from the dataframe.

like: It acts similar to the like filter in SQL. ‘%’ can be used as a wildcard to filter the result. However, unlike SQL where the result is filtered based on the condition mentioned in like condition, here the complete result is shown indicating whether or not it meets the like condition.
The below code will show Pregnancies and Glucose values from the dataframe and it will indicate whether or not an individual row contains BMI value starting with 33.
Note: Usually, the like condition is used for categorical variables. However, the data source I am using doesn’t have any categorical variable, hence used this example.

filter: Filters data based on the mentioned condition.
The below code filters the dataframe with BloodPressure greater than 100.

The filter can be used to add more than one condition with and (&), OR (|) condition.
The below code snippet filters the dataframe with BloodPressure and Insulin values more than 100.

orderBy: Order the output.
The below code filters the dataframe with BloodPressure and Insulin values more than 100 and output based on Glucose value.

Recommend
About Joyk
Aggregate valuable and interesting links.
Joyk means Joy of geeK