

#30DayMapChallenge: Day 3 – Polygons OR Lego® style brick raster in QGIS using G...
source link: https://hannes.enjoys.it/blog/2019/11/30daymapchallenge-day-3-polygons-or-lego-style-brick-raster-in-qgis-using-geometry-generator-expressions/
Go to the source link to view the article. You can view the picture content, updated content and better typesetting reading experience. If the link is broken, please click the button below to view the snapshot at that time.
#30DayMapChallenge: Day 3 – Polygons OR Lego® style brick raster in QGIS using Geometry Generator expressions
I showed this at the annual meeting of the swiss user group in June 2019 and promptly forgot to post it for everyone to see. Let’s blame the scenery?
Have a raster.
Processing -> Create Grid, covering it with points in a spacing of your choice. Use the same CRS as your raster (unless you want to figure out expression-based geometry transformations on your own, like in my elevation lines code)
Change the Symbol layer type to Geometry Generator and enter
with_variable(
  'radius',
  3333,
  buffer($geometry, @radius, 16)
)
where radius should be a value about one third of your spacing.
You should see circles!
For the fill color use this expression and adjust the name of your raster layer:
with_variable(
    'raster_layer',
    'DHM200.xyz',
    ramp_color('Blues',  -- change to an other named ramp here if you like
        scale_linear(
            raster_value(
                @raster_layer, 1,
                centroid($geometry)  -- back to our point
            ),
            raster_statistic(
                @raster_layer, 1,
                'min'
            ),
            raster_statistic(
                @raster_layer, 1,
                'max'
            ),
            0, 1  -- new scale as color ramps go 0 to 1
        )
    )
)
This will get the raster value below our grid point and fit it onto a color ramp between the min and max of all the raster values.
For the stroke use the same expression but wrap darker(..., 150) around it so you get a darker color.
Using Draw Effects add a small Drop Shadow to your circles. I used an offset of 0.5 mm and a blur radius of 1 mm.
Now add another Geometry Generator symbol layer below your existing one and use the following expression:
bounds(buffer($geometry, 5000))
with_variable(
  'radius',
  5000,
  bounds(
    buffer($geometry, @radius)
  )
)
with the radius being half your grid spacing.
Use the same expressions for the colors as above but set the darker value to 200.
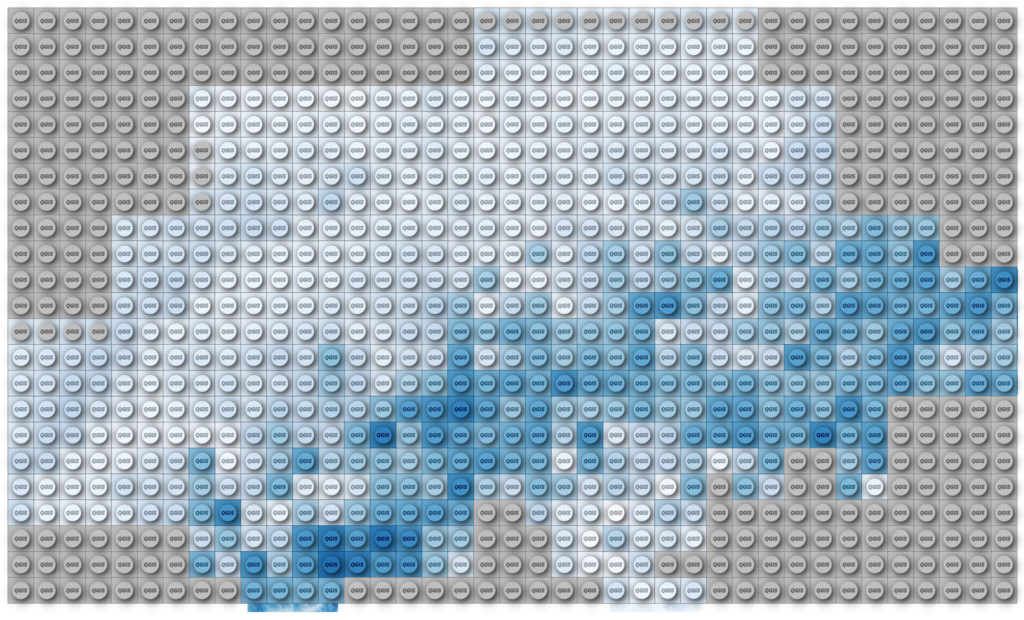
For some more fanciness maybe add a “QGIS” text on top of the nupsies?
Exercise: Make it so that the result perfectly covers the raster, instead of being one grid cell off like mine.
Recommend
About Joyk
Aggregate valuable and interesting links.
Joyk means Joy of geeK