

Top 50 Tableau Interview Questions And Answers For 2020 | Edureka
source link: https://www.edureka.co/blog/interview-questions/top-tableau-interview-questions-and-answers/
Go to the source link to view the article. You can view the picture content, updated content and better typesetting reading experience. If the link is broken, please click the button below to view the snapshot at that time.
Top 50 Tableau Interview Questions You Must Prepare In 2020
Last updated on Oct 25,2020 387.4K ViewsIn this Tableau interview questions blog, I have collected the most frequently asked questions by interviewers. These questions are collected after consulting with top industry experts in the field of Data analytics and visualization. If you want to brush up with the Tableau basics, which I recommend you to do before going ahead with this Tableau Interview Questions, take a look at this blog.
In case you have attended a Tableau interview in the recent past, do paste those Tableau interview questions in the comments section and we’ll answer them ASAP. You can also comment below if you have any questions in your mind which you might face in your Tableau interview. In the meantime, maximize the data visualization career opportunities that are sure to come your way by taking Tableau online training with Edureka. You can even get a Tableau certification after the course. Click below to know more.
This Tableau Interview questions is divided into the following parts:
Let’s begin this Tableau Interview Questions with Beginners level questions first.
Beginners Level Tableau Interview Questions
1. What is the difference between Traditional BI Tools and Tableau?
Traditional BI Tools vs Tableau
Traditional BI ToolsTableau1. Architecture has hardware limitations.1. Do not have dependencies.2. Based on a complex set of technologies.2. Based on Associative Search which makes it dynamic and fast3. Do not support in-memory, multi-thread, multi-core computing.3. Supports in memory when used with advanced technologies.4. Has a predefined view of data.4. Uses predictive analysis for various business operations.2. What is Tableau?
- Tableau is a business intelligence software.
- It allows anyone to connect to the respective data.
- Visualizes and creates interactive, shareable dashboards.
3. What are the different Tableau Products and what is the latest version of Tableau?
Here is the Tableau Product family.
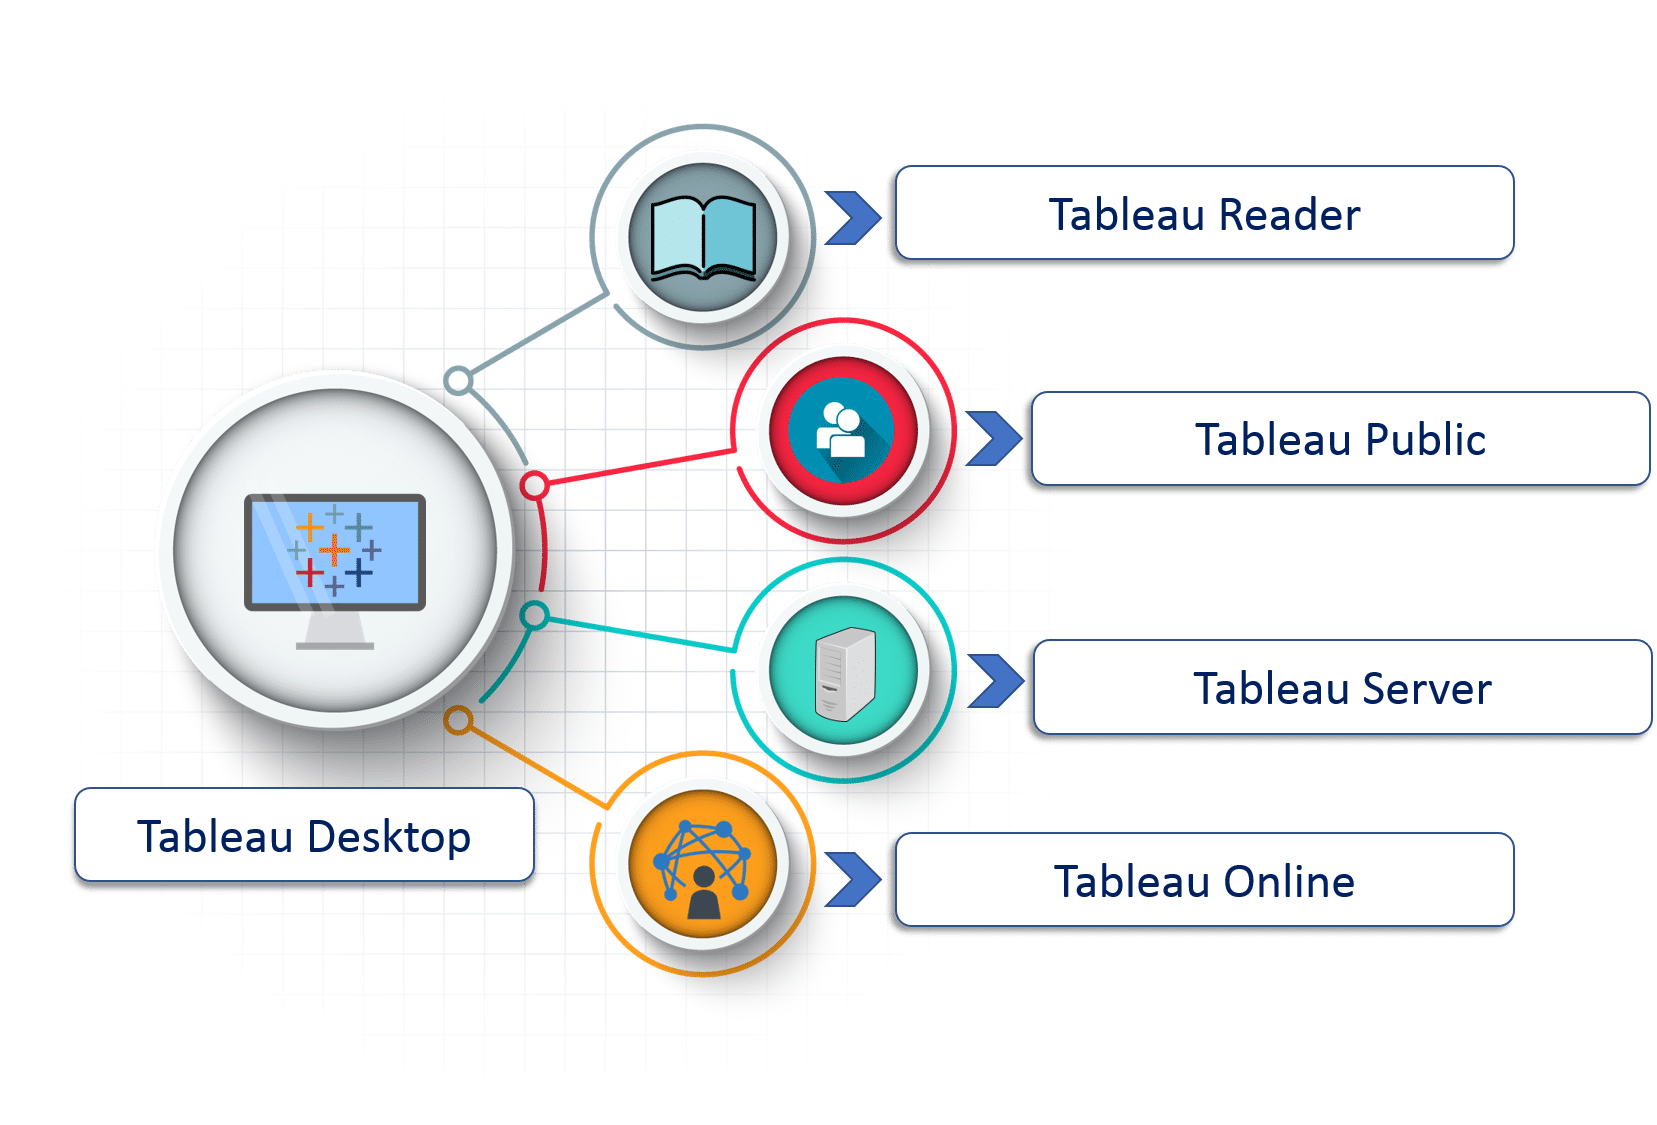
It is a self service business analytics and data visualization that anyone can use. It translates pictures of data into optimized queries. With tableau desktop, you can directly connect to data from your data warehouse for live upto date data analysis. You can also perform queries without writing a single line of code. Import all your data into Tableau’s data engine from multiple sources & integrate altogether by combining multiple views in a interactive dashboard.
(ii)Tableau Server:
It is more of an enterprise level Tableau software. You can publish dashboards with Tableau Desktop and share them throughout the organization with web-based Tableau server. It leverages fast databases through live connections.
(iii)Tableau Online:
This is a hosted version of Tableau server which helps makes business intelligence faster and easier than before. You can publish Tableau dashboards with Tableau Desktop and share them with colleagues.
(iv)Tableau Reader:
It’s a free desktop application that enables you to open and view visualizations that are built in Tableau Desktop. You can filter, drill down data but you cannot edit or perform any kind of interactions.

(v)Tableau Public:
This is a free Tableau software which you can use to make visualizations with but you need to save your workbook or worksheets in the Tableau Server which can be viewed by anyone.
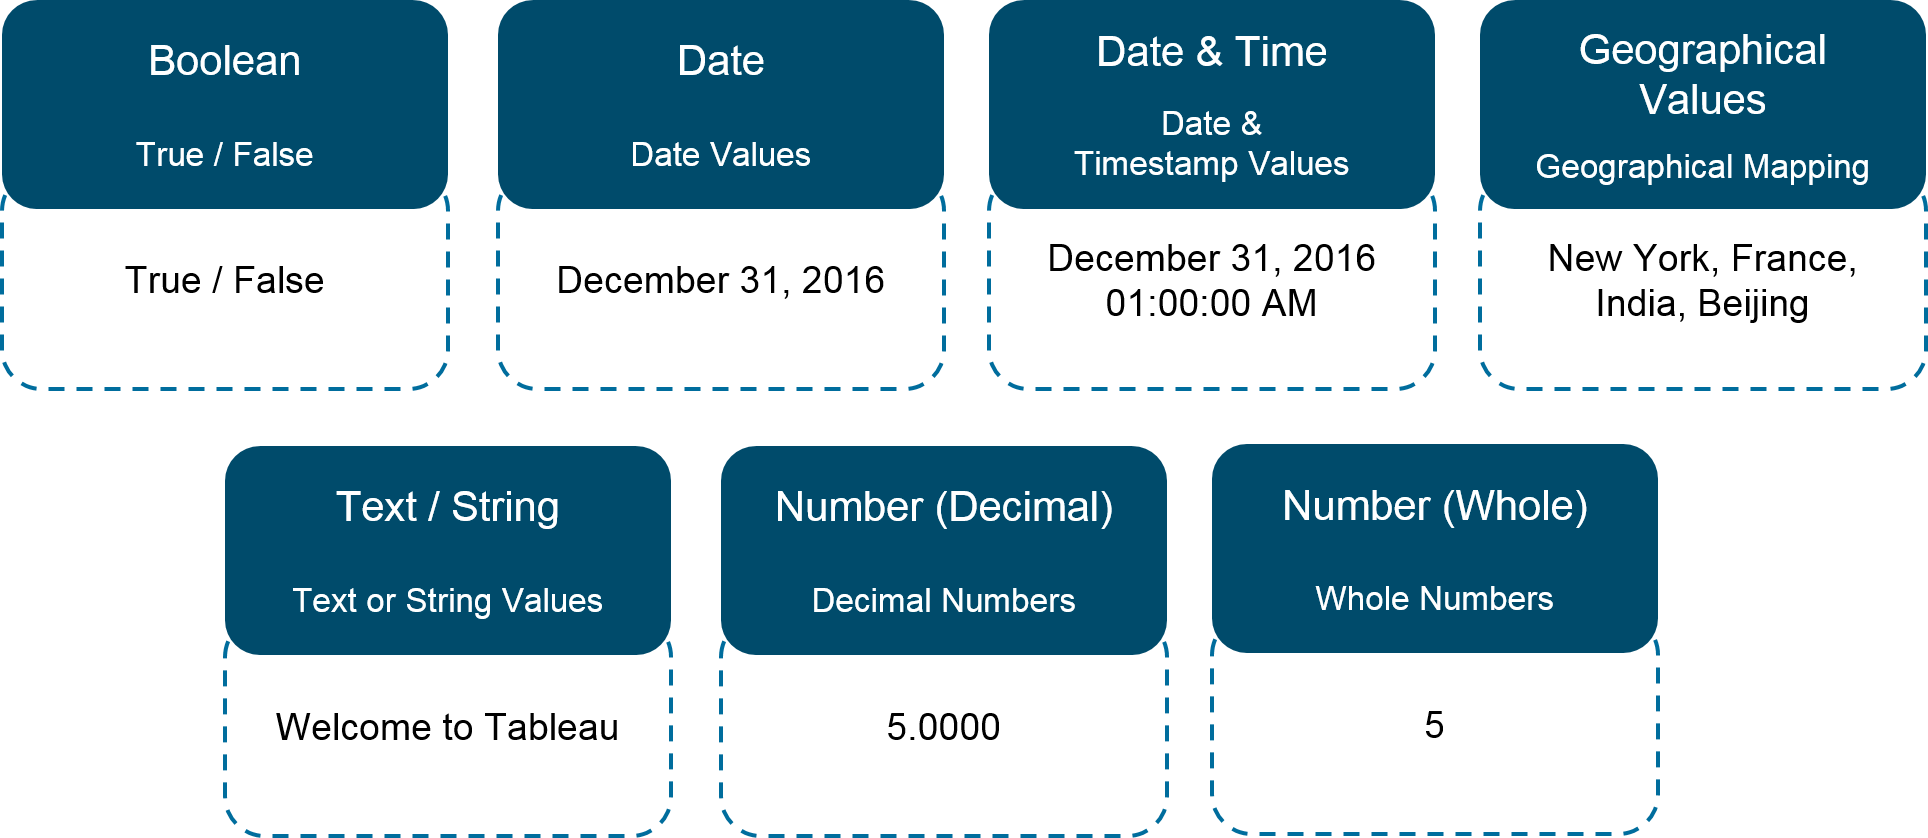
4. What are the different datatypes in Tableau?
Tableau supports the following data-types:
5. What are Measures and Dimensions?
Measures are the numeric metrics or measurable quantities of the data, which can be analyzed by dimension table. Measures are stored in a table that contain foreign keys referring uniquely to the associated dimension tables. The table supports data storage at atomic level and thus, allows more number of records to be inserted at one time. For instance, a Sales table can have product key, customer key, promotion key, items sold, referring to a specific event.
Dimensions are the descriptive attribute values for multiple dimensions of each attribute, defining multiple characteristics. A dimension table ,having reference of a product key form the table, can consist of product name, product type, size, color, description, etc.
Tableau Interview Questions & Answers | Edureka

This video will give you an overview of Tableau’s job market trends, career path in Tableau and how to get your dream Tableau job along with interview questions answered by a Tableau expert.
6. What is the difference between .twb and .twbx extension?
- A .twb is an xml document which contains all the selections and layout made you have made in your Tableau workbook. It does not contain any data.
- A .twbx is a ‘zipped’ archive containing a .twb and any external files such as extracts and background images.
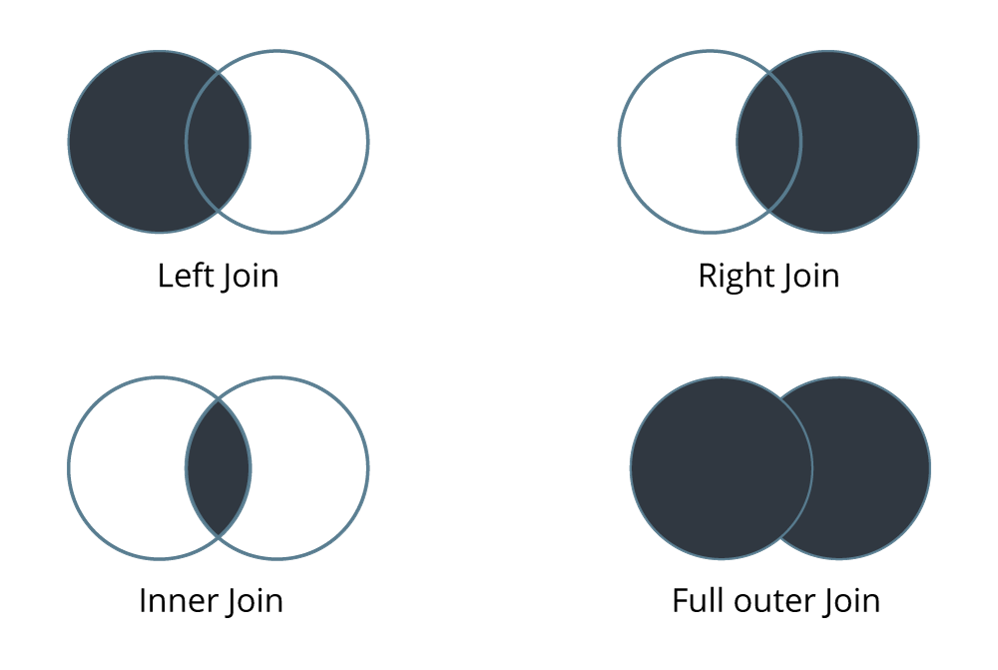
7. What are the different types of joins in Tableau?
The joins in Tableau are same as SQL joins. Take a look at the diagram below to understand it.
8. How many maximum tables can you join in Tableau?
You can join a maximum of 32 tables in Tableau.
9. What are the different connections you can make with your dataset?
We can either connect live to our data set or extract data onto Tableau.
- Live: Connecting live to a data set leverages its computational processing and storage. New queries will go to the database and will be reflected as new or updated within the data.
- Extract: An extract will make a static snapshot of the data to be used by Tableau’s data engine. The snapshot of the data can be refreshed on a recurring schedule as a whole or incrementally append data. One way to set up these schedules is via the Tableau server.
The benefit of Tableau extract over live connection is that extract can be used anywhere without any connection and you can build your own visualization without connecting to database.
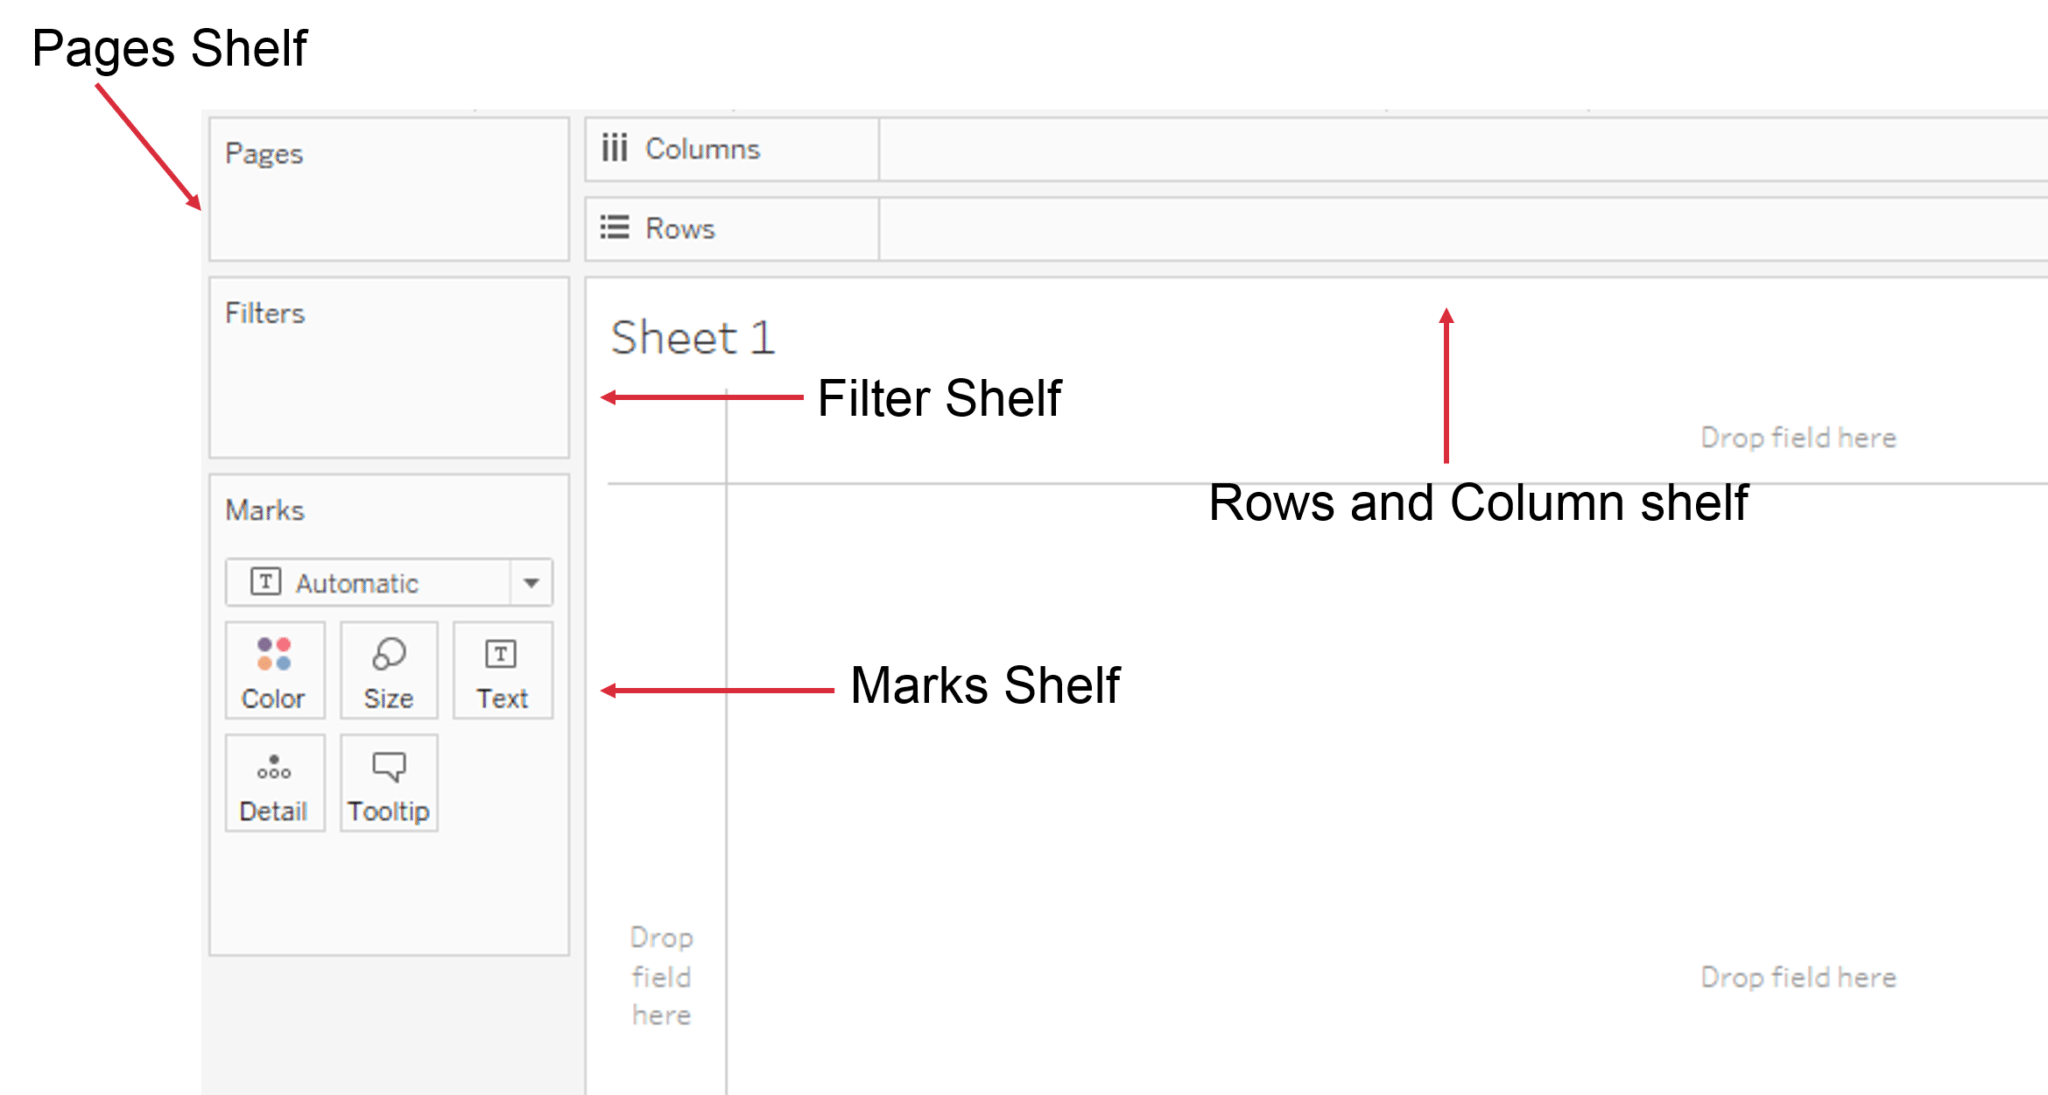
10. What are shelves?
They are Named areas to the left and top of the view. You build views by placing fields onto the shelves. Some shelves are available only when you select certain mark types.
11. What are sets?
Sets are custom fields that define a subset of data based on some conditions. A set can be based on a computed condition, for example, a set may contain customers with sales over a certain threshold. Computed sets update as your data changes. Alternatively, a set can be based on specific data point in your view.
12. What are groups?
A group is a combination of dimension members that make higher level categories. For example, if you are working with a view that shows average test scores by major, you may want to group certain majors together to create major categories.
13. What is a hierarchical field?
A hierarchical field in tableau is used for drilling down data. It means viewing your data in a more granular level.
14. What is Tableau Data Server?
Tableau server acts a middle man between Tableau users and the data. Tableau Data Server allows you to upload and share data extracts, preserve database connections, as well as reuse calculations and field metadata. This means any changes you make to the data-set, calculated fields, parameters, aliases, or definitions, can be saved and shared with others, allowing for a secure, centrally managed and standardized dataset. Additionally, you can leverage your server’s resources to run queries on extracts without having to first transfer them to your local machine.
Intermediate Level Tableau Interview Questions
15. What is Tableau Data Engine?
Tableau Data Engine is a really cool feature in Tableau. Its an analytical database designed to achieve instant query response, predictive performance, integrate seamlessly into existing data infrastructure and is not limited to load entire data sets into memory.
If you work with a large amount of data, it does takes some time to import, create indexes and sort data but after that everything speeds up. Tableau Data Engine is not really in-memory technology. The data is stored in disk after it is imported and the RAM is hardly utilized.
16. What are the different filters in Tableau and how are they different from each other?
In Tableau, filters are used to restrict the data from database.
The different filters in Tableau are: Quick , Context and Normal/Traditional filter are:
- Normal Filter is used to restrict the data from database based on selected dimension or measure. A Traditional Filter can be created by simply dragging a field onto the ‘Filters’ shelf.
- Quick filter is used to view the filtering options and filter each worksheet on a dashboard while changing the values dynamically (within the range defined) during the run time.
- Context Filter is used to filter the data that is transferred to each individual worksheet. When a worksheet queries the data source, it creates a temporary, flat table that is uses to compute the chart. This temporary table includes all values that are not filtered out by either the Custom SQL or the Context Filter.
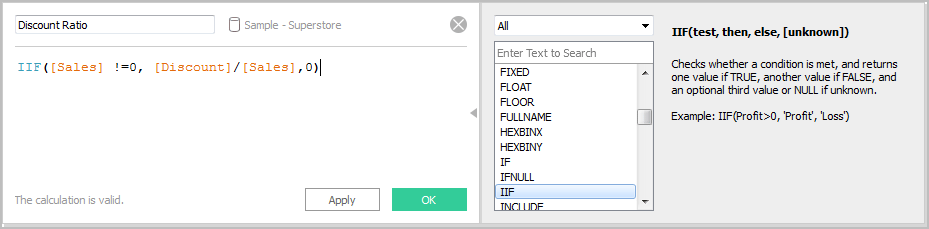
17. How to create a calculated field in Tableau?
- Click the drop down to the right of Dimensions on the Data pane and select “Create > Calculated Field” to open the calculation editor.
- Name the new field and create a formula.
Take a look at the example below:
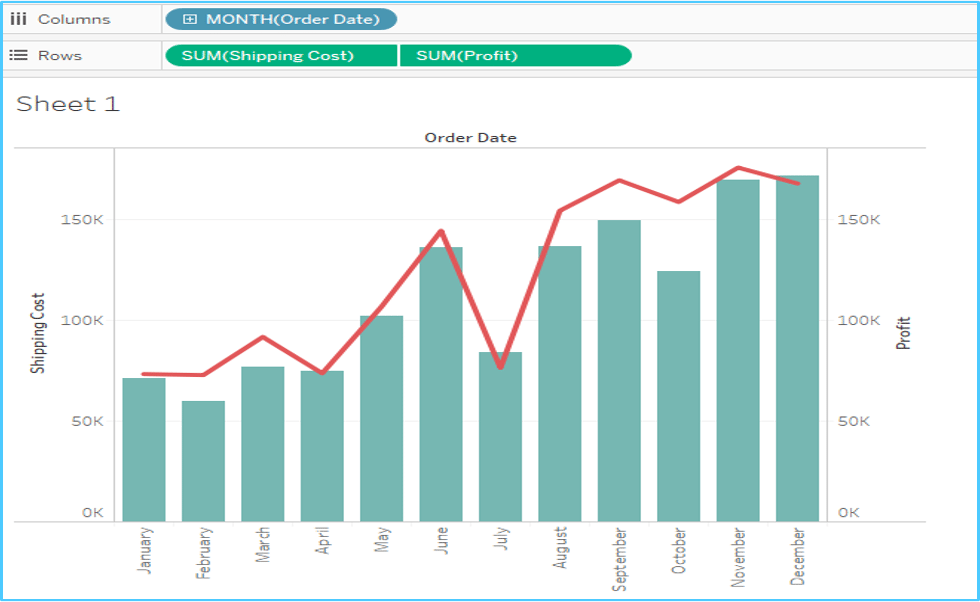
18. What is a dual axis?
Dual Axis is an excellent phenomenon supported by Tableau that helps users view two scales of two measures in the same graph. Many websites like Indeed.com and other make use of dual axis to show the comparison between two measures and their growth rate in a septic set of years. Dual axes let you compare multiple measures at once, having two independent axes layered on top of one another. This is how it looks like:
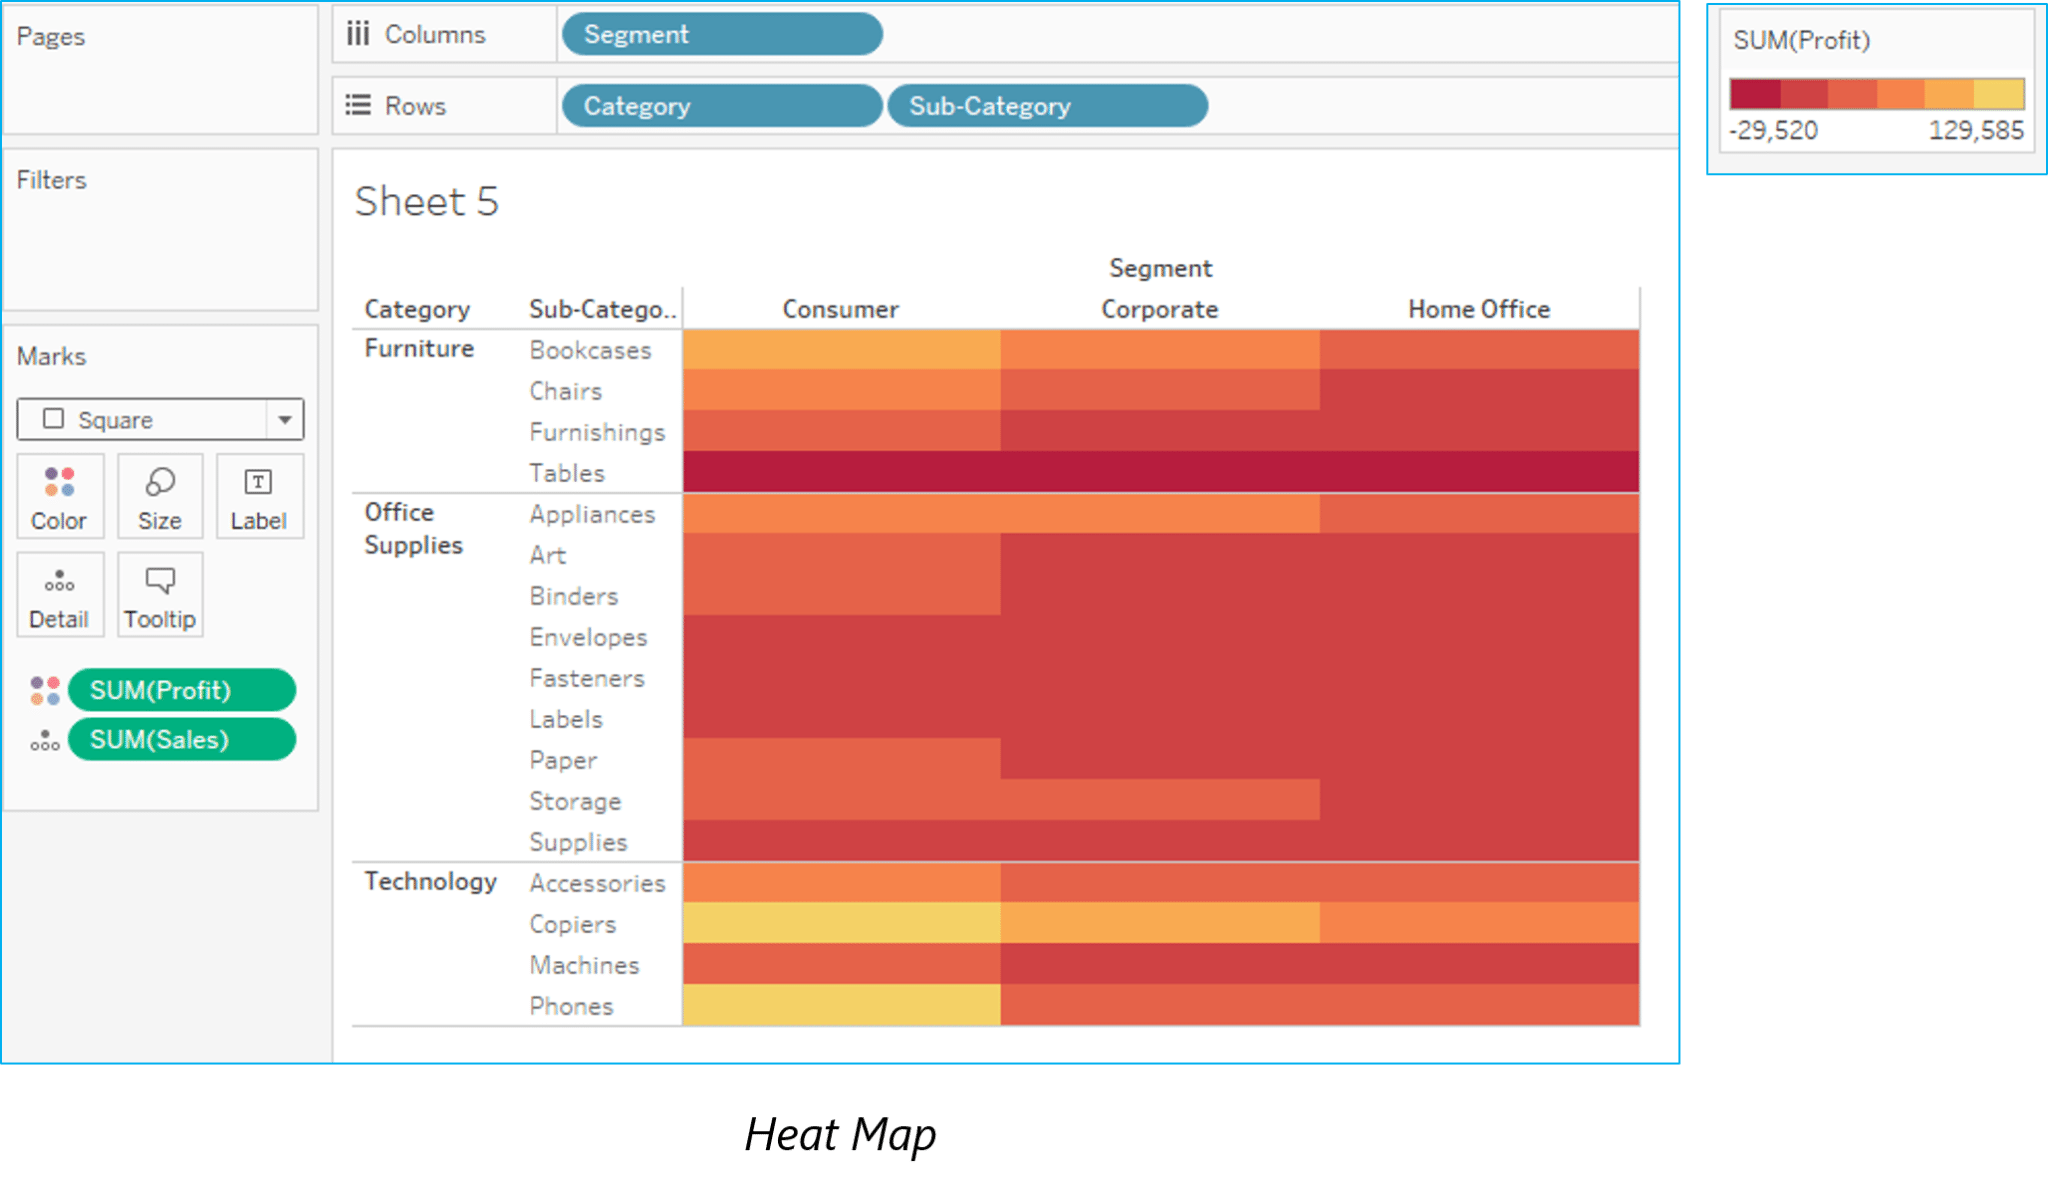
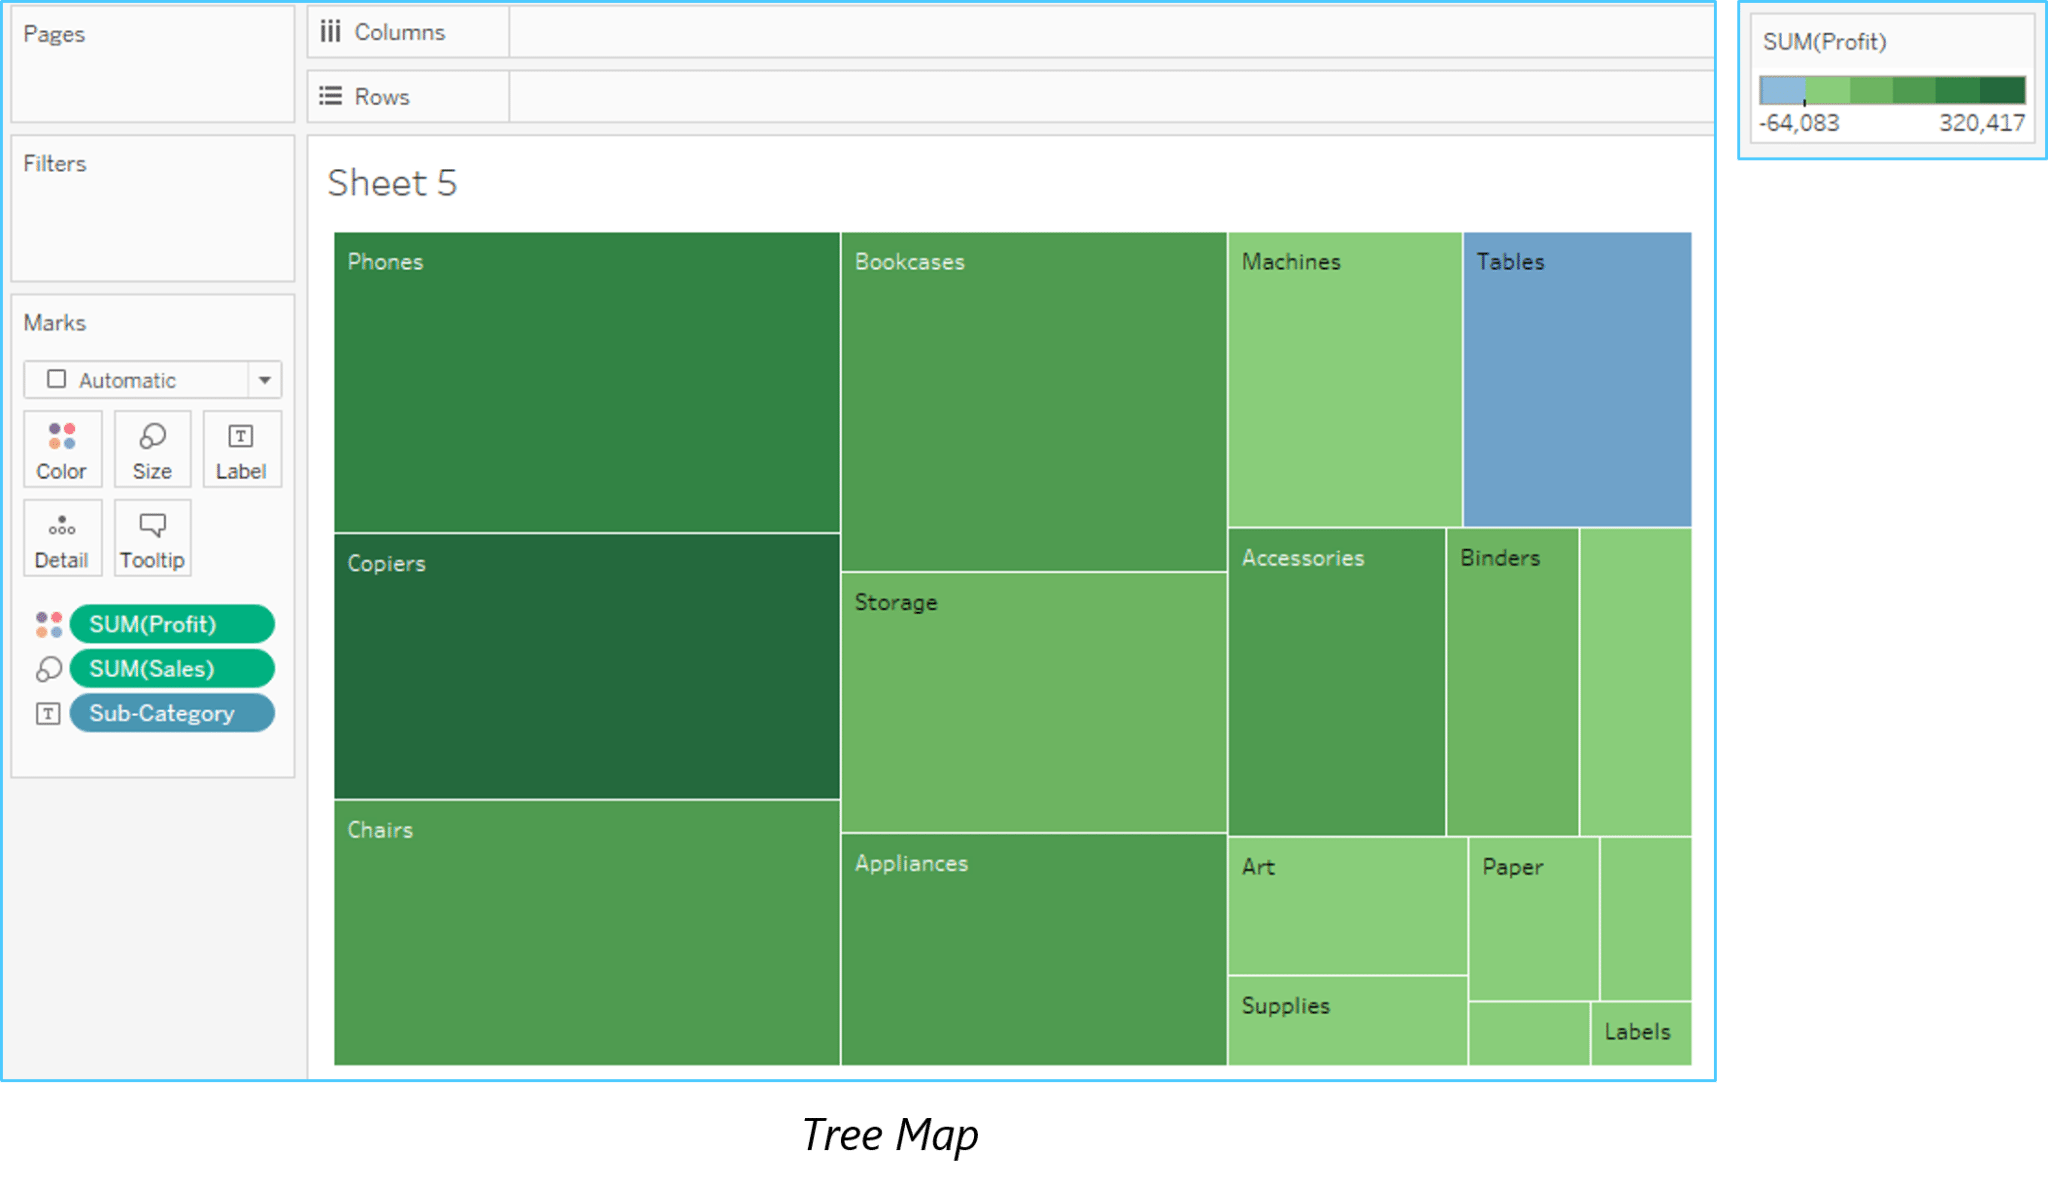
19. What is the difference between a tree map and heat map?
A heat map can be used for comparing categories with color and size. With heat maps, you can compare two different measures together.
20. What is disaggregation and aggregation of data?
The process of viewing numeric values or measures at higher and more summarized levels of the data is called aggregation. When you place a measure on a shelf, Tableau automatically aggregates the data, usually by summing it. You can easily determine the aggregation applied to a field because the function always appears in front of the field’s name when it is placed on a shelf. For example, Sales becomes SUM(Sales). You can aggregate measures using Tableau only for relational data sources. Multidimensional data sources contain aggregated data only. In Tableau, multidimensional data sources are supported only in Windows.
According to Tableau, Disaggregating your data allows you to view every row of the data source which can be useful when you are analyzing measures that you may want to use both independently and dependently in the view. For example, you may be analyzing the results from a product satisfaction survey with the Age of participants along one axis. You can aggregate the Age field to determine the average age of participants or disaggregate the data to determine what age participants were most satisfied with the product.
21. What is the difference between joining and blending in Tableau?
- Joining term is used when you are combining data from the same source, for example, worksheet in an Excel file or tables in Oracle database
- While blending requires two completely defined data sources in your report.
22. What are Extracts and Schedules in Tableau server?
Data extracts are the first copies or subdivisions of the actual data from original data sources. The workbooks using data extracts instead of those using live DB connections are faster since the extracted data is imported in Tableau Engine.After this extraction of data, users can publish the workbook, which also publishes the extracts in Tableau Server. However, the workbook and extracts won’t refresh unless users apply a scheduled refresh on the extract. Scheduled Refreshes are the scheduling tasks set for data extract refresh so that they get refreshed automatically while publishing a workbook with data extract. This also removes the burden of republishing the workbook every time the concerned data gets updated.
23. How to view underlying SQL Queries in Tableau?
Viewing underlying SQL Queries in Tableau provides two options:
- Create a Performance Recording to record performance information about the main events you interact with workbook. Users can view the performance metrics in a workbook created by Tableau.
Help -> Settings and Performance -> Start Performance Recording
Help -> Setting and Performance -> Stop Performance Recording. - Reviewing the Tableau Desktop Logs located at C:UsersMy DocumentsMy Tableau Repository. For live connection to data source, you can check log.txt and tabprotosrv.txt files. For an extract, check tdeserver.txt file.
24. How to do Performance Testing in Tableau?
Performance testing is again an important part of implementing tableau. This can be done by loading Testing Tableau Server with TabJolt, which is a “Point and Run” load generator created to perform QA. While TabJolt is not supported by tableau directly, it has to be installed using other open source products.
25. Name the components of a Dashboard.
- Horizontal – Horizontal layout containers allow the designer to group worksheets and dashboard components left to right across your page and edit the height of all elements at once.
- Vertical – Vertical containers allow the user to group worksheets and dashboard components top to bottom down your page and edit the width of all elements at once.
- Text – All textual fields.
- Image Extract – A Tableau workbook is in XML format. In order to extracts images, Tableau applies some codes to extract an image which can be stored in XML.
- Web [URL ACTION] – A URL action is a hyperlink that points to a Web page, file, or other web-based resource outside of Tableau. You can use URL actions to link to more information about your data that may be hosted outside of your data source. To make the link relevant to your data, you can substitute field values of a selection into the URL as parameters.
26. How to remove ‘All’ options from a Tableau auto-filter?
27. How to add Custom Color to Tableau?
28. What is TDE file?
There are two aspects of TDE design that make them ideal for supporting analytics and data discovery.
- Firstly, TDE is a columnar store.
- The second is how they are structured which impacts how they are loaded into memory and used by Tableau. This is an important aspect of how TDEs are “architecture aware”. Architecture-awareness means that TDEs use all parts of your computer memory, from RAM to hard disk, and put each part to work what best fits its characteristics.
29. Mention whether you can create relational joins in Tableau without creating a new table?
30. How to automate reports?
31. What is Assume referential integrity?
In some cases, you can improve query performance by selecting the option to Assume Referential Integrity from the Data menu. When you use this option, Tableau will include the joined table in the query only if it is specifically referenced by fields in the view.
32. Explain when would you use Joins vs. Blending in Tableau?
If data resides in a single source, it is always desirable to use Joins. When your data is not in one place blending is the most viable way to create a left join like the connection between your primary and secondary data sources.
33. What is default Data Blending Join?
Data blending is the ability to bring data from multiple data sources into one Tableau view, without the need for any special coding. A default blend is equivalent to a left outer join. However, by switching which data source is primary, or by filtering nulls, it is possible to emulate left, right and inner joins.
34. What do you understand by blended axis?
In Tableau, measures can share a single axis so that all the marks are shown in a single pane. Instead of adding rows and columns to the view, when you blend measures there is a single row or column and all of the values for each measure is shown along one continuous axis. We can blend multiple measures by simply dragging one measure or axis and dropping it onto an existing axis.
35. What is story in Tableau?
A story is a sheet that contains a sequence of worksheets or dashboards that work together to convey information. You can create stories to show how facts are connected, provide context, demonstrate how decisions relate to outcomes, or simply make a compelling case. Each individual sheet in a story is called a story point.
36. What is the difference between discrete and continuous in Tableau?
There are two types of data roles in Tableau – discrete and continuous dimension.
- Discrete data roles are values that are counted as distinct and separate and can only take individual values within a range. Examples: number of threads in a sheet, customer name or row ID or State. Discrete values are shown as blue pills on the shelves and blue icons in the data window.
- Continuous data roles are used to measure continuous data and can take on any value within a finite or infinite interval. Examples: unit price, time and profit or order quantity. Continuous variables behave in a similar way in that they can take on any value. Continuous values are shown as green pills.
37.How to create stories in Tableau?
There are many ways to create story in Tableau. Each story point can be based on a different view or dashboard, or the entire story can be based on the same visualization, just seen at different stages, with different marks filtered and annotations added. You can use stories to make a business case or to simply narrate a sequence of events.
- Click the New Story tab.
- In the lower-left corner of the screen, choose a size for your story. Choose from one of the predefined sizes, or set a custom size, in pixels.
- By default, your story gets its title from its sheet name. To edit it, double-click the title. You can also change your title’s font, color, and alignment. Click Apply to view your changes.
- To start building your story, drag a sheet from the Story tab on the left and drop it into the center of the view
- Click Add a caption to summarize the story point.
- To highlight a key takeaway for your viewers, drag a text object over to the story worksheet and type your comment.
- To further highlight the main idea of this story point, you can change a filter or sort on a field in the view, then save your changes by clicking Update above the navigator box.
38. What is the DRIVE Program Methodology?
Tableau Drive is a methodology for scaling out self-service analytics. Drive is based on best practices from successful enterprise deployments. The methodology relies on iterative, agile methods that are faster and more effective than traditional long-cycle deployment.
A cornerstone of this approach is a new model of partnership between business and IT.
39. How to use group in calculated field?
By adding the same calculation to ‘Group By’ clause in SQL query or creating a Calculated Field in the Data Window and using that field whenever you want to group the fields.
- Using groups in a calculation. You cannot reference ad-hoc groups in a calculation.
- Blend data using groups created in the secondary data source: Only calculated groups can be used in data blending if the group was created in the secondary data source.
- Use a group in another workbook. You can easily replicate a group in another workbook by copy and pasting a calculation.
40. Mention what is the difference between published data sources and embedded data sources in Tableau?
The difference between published data source and embedded data source is that,
- Published data source: It contains connection information that is independent of any workbook and can be used by multiple workbooks.
- Embedded data source: It contains connection information and is associated with a workbook.
41. Mention what are different Tableau files?
Different Tableau files include:
- Workbooks: Workbooks hold one or more worksheets and dashboards
- Bookmarks: It contains a single worksheet and its an easy way to quickly share your work
- Packaged Workbooks: It contains a workbook along with any supporting local file data and background images
- Data Extraction Files: Extract files are a local copy of a subset or entire data source
- Data Connection Files: It’s a small XML file with various connection information
Expert level Tableau Interview Questions
42. How to embed views onto Webpages?
You can embed interactive Tableau views and dashboards into web pages, blogs, wiki pages, web applications, and intranet portals. Embedded views update as the underlying data changes, or as their workbooks are updated on Tableau Server. Embedded views follow the same licensing and permission restrictions used on Tableau Server. That is, to see a Tableau view that’s embedded in a web page, the person accessing the view must also have an account on Tableau Server.
Alternatively, if your organization uses a core-based license on Tableau Server, a Guest account is available. This allows people in your organization to view and interact with Tableau views embedded in web pages without having to sign in to the server. Contact your server or site administrator to find out if the Guest user is enabled for the site you publish to.
You can do the following to embed views and adjust their default appearance:
- Get the embed code provided with a view: The Share button at the top of each view includes embed code that you can copy and paste into your webpage. (The Share button doesn’t appear in embedded views if you change the
showShareOptionsparameter tofalsein the code.) - Customize the embed code: You can customize the embed code using parameters that control the toolbar, tabs, and more. For more information, see Parameters for Embed Code.
- Use the Tableau JavaScript API: Web developers can use Tableau JavaScript objects in web applications. To get access to the API, documentation, code examples, and the Tableau developer community, see the Tableau Developer Portal.
43. Design a view in a map such that if user selects any state, the cities under that state has to show profit and sales.
According to your question you must have state, city, profit and sales fields in your dataset.
Step 1: Double click on the state field
Step 2: Drag the city and drop it into Marks card.
Step 3: Drag the sales and drop it into size.
Step 4: Drag profit and drop it into color.
Step 5: Click on size legend and increase the size.
Step 6: Right click on state field and select show quick filter.
Step 7: Select any state now and check the view.
44. Think that I am using Tableau Desktop & have a live connection to Cloudera Hadoop data. I need to press F5 to refresh the visualization. Is there anyway to automatically refresh visualization every ‘x’ seconds instead of pressing F5?
Here is an example of refreshing the dashboard for every 5 seconds.
All you need to do is replace the api src and server url with yours.
<!DOCTYPE html>

<html lang="en">

<head>

<title>Tableau JavaScript API </title>

<script type="text/javascript" src="http://servername/javascripts/api/tableau_v8.js"></script>

</head>

<div id="tableau Viz"></div>

<script type='text/javascript'>

var placeholderDiv = document.getElementById("tableau Viz");

var url = "http://servername/t/311/views/Mayorscreenv5/Mayorscreenv2";

var options={

hideTabs:True,

width:"100%",

height:"1000px"

};

var viz= new tableauSoftware.Viz(placeholderDiv,url,options);

setInterval (function() {viz.refreshDataAsync()},5000);

</script>

</body>

</html>
Some Additional Tricky Tableau Interview Questions
45. Suppose my license expires today, will users be able to view dashboards or workbooks which I published in the server earlier?
If your server license expires today, your username on the server will have the role ‘unlicensed’ which means you cannot access but others can. The site admin can change the ownership to another person so that the extracts do not fail.
46. Is Tableau software good for strategic acquisition?
Yes! For sure. It gives you data insight to the extent that other tools can’t. Moreover, it also helps you to plan and point the anomalies and improvise your process for betterment of your company.
47. Can we place an excel file in a shared location and and use it to develop a report and refresh it in regular intervals?
Yes, we can do it. But for better performance we should use Extract.
48. Can Tableau be installed on MacOS?
Yes, Tableau Desktop can be installed on both on Mac and Windows Operating System.
49. What is the maximum no. of rows Tableau can utilize at one time?
Tableau is not restricted by the no. of rows in the table. Customers use Tableau to access petabytes of data because it only retrieves the rows and columns needed to answer your questions.
50. When publishing workbooks on Tableau online, sometimes a error about needing to extract appears. Why does it happen occasionally?
This happens when a user is trying to publish a workbook that is connected to an internal server or a file stored on a local drive, such as a SQL server that is within a company’s network.
I hope that this Tableau Interview Questions were helpful to you. I will be coming up with more blogs on Tableau for you all very soon.
If you wish to master Tableau, Edureka has a curated course on Tableau Training & Certification which covers various concepts of data visualization in depth, including conditional formatting, scripting, linking charts, dashboard integration, Tableau integration with R and more. It comes with 24*7 support to guide you throughout your learning period. New batches are starting soon.
Got a question for us? Please mention it in the comments section and we will get back to you at the earliest.
Recommend
About Joyk
Aggregate valuable and interesting links.
Joyk means Joy of geeK