

Visualising an Online Marketplace
source link: https://treatwell.engineering/visualising-an-online-marketplace-1da3aba49cf9
Go to the source link to view the article. You can view the picture content, updated content and better typesetting reading experience. If the link is broken, please click the button below to view the snapshot at that time.
Visualising an Online Marketplace
Data visualisation tools are an essential means in every data related business area. They enable us to grasp, understand and share data in a simple way. Thus illustrations such as histograms, bar charts, timelines and many more have become natural parts of our day-to-day work. This is true for most data structures. However, visualising graph data to explore networks of any kind is rarely done in the modern business world.
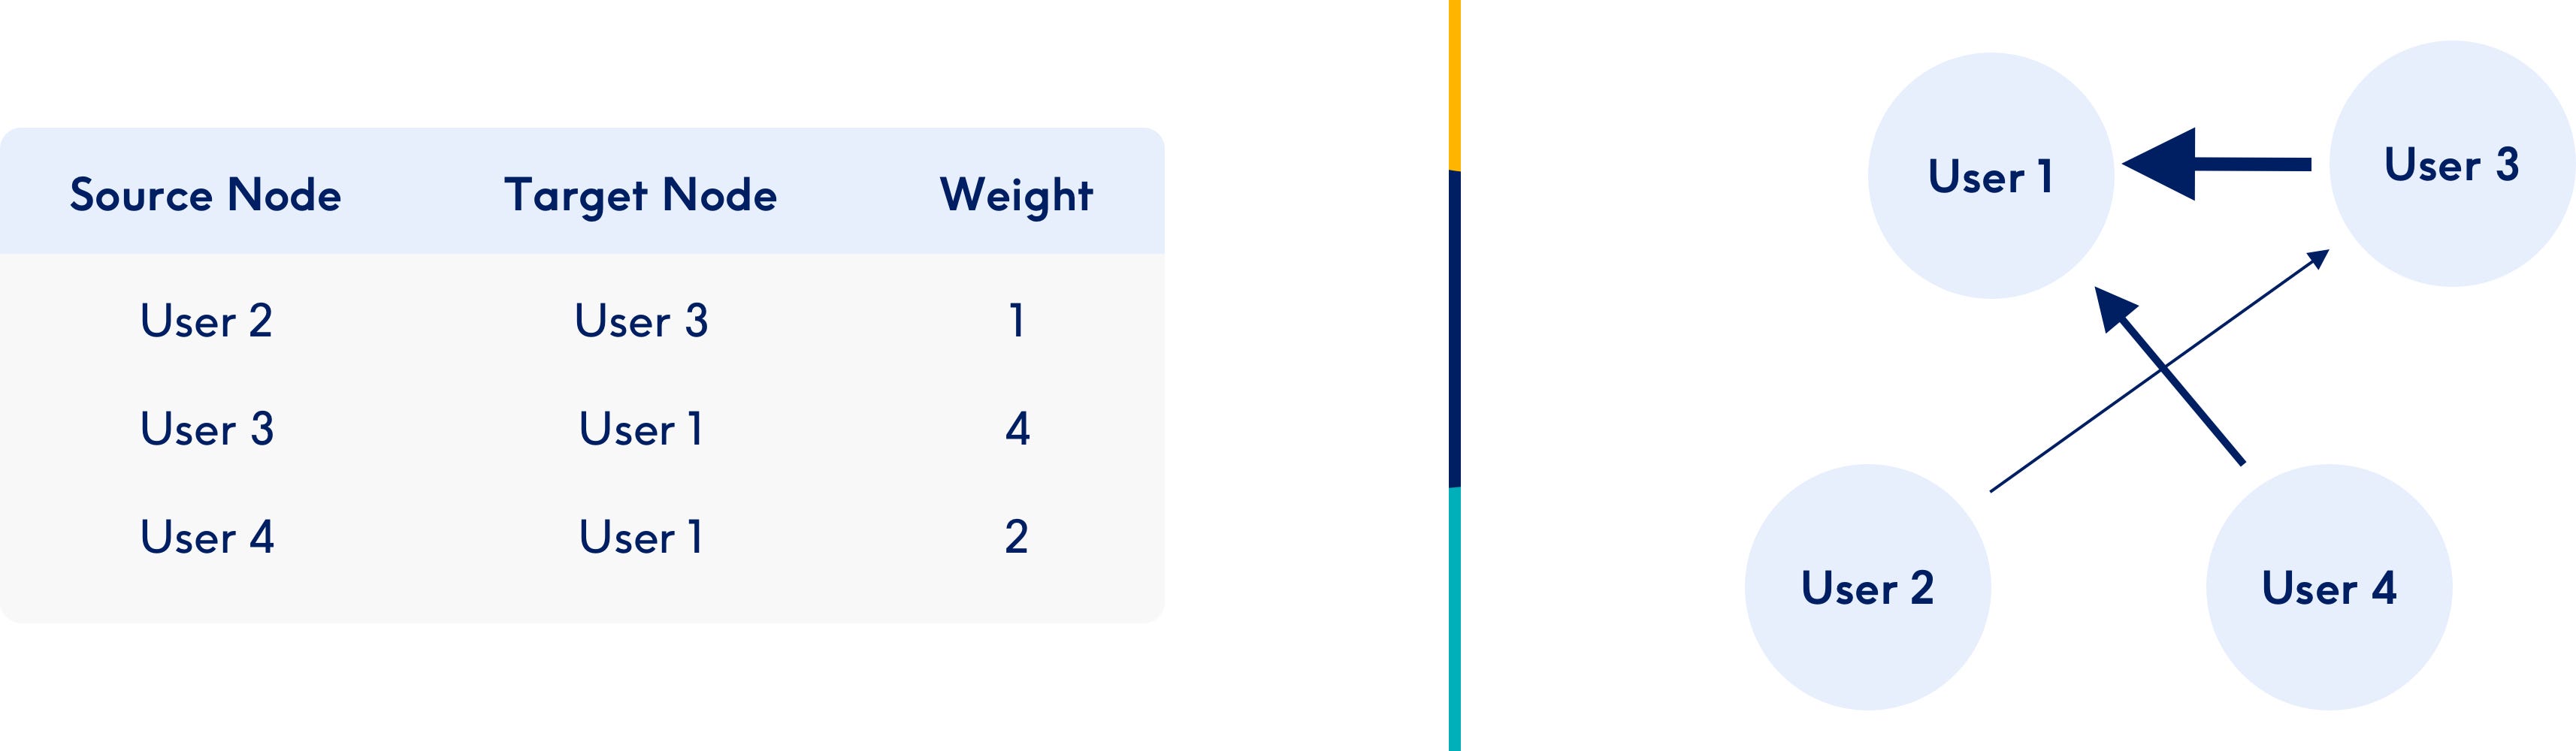
Being the largest hair and beauty booking platform in Europe, Treatwell has a rich amount of graph data, like many other companies do. This presents analysts with the challenge to derive valuable insights from these alleged treasures. But connected data that is represented in tables makes it difficult to discover any kind of connections in it. As you can see in the figure below, making sense of a very small network represented in a table is a challenge, whereas the visualisation of the same network is much more intuitive and easy to interpret.

As this example shows, visualisation is an incredibly powerful tool when it comes to looking into graph data. In this blog post, I will show how network visualisation can be used to derive valuable insights from a company’s graph data. After defining the use case, there are three main steps which I’ll explain:
- Defining similarity between salons
- Creating a visual map
- Manipulating the map to understand the structure of the network
The code used to create the network tables for the data visualisation tool is publicly available on Github (link at the end of this article).
The use case
Understanding why Treatwell users choose particular salons is crucial to optimise different aspects of our product. There are many factors a user could consider before booking with a particular salon: treatment type, price, location and the salon’s rating are just a few examples. The question is, which of these factors are the most important ones?
A possible approach to answer this question is looking at the venues’ customer circles. We can assume that a user always has the same priorities when picking a new salon, meaning that salons with overlapping customer circles will share these important attributes that are so meaningful to their (mutual) customers. Accordingly, clustering venues with similar customers and checking for shared attributes will give us an idea about what made these customers choose these salons.
Finding similarities in salon customer circles
To identify salons with similar customer circles, we need an eligible metric to measure the similarity between two sets. A popular and straight forward measure for cases like this is the Jaccard Coefficient:

Unfortunately, there is a significant drawback of using this index since it doesn’t take into account the relative sizes of different customer circles. For example, imagine the situation in the figure below:

- There is a very big salon (S1) whose customer circle overlaps with many other salons.
- There is a very small salon (S2) whose customer circle overlaps with the one of S1, but to a very high degree.
In this case, we would want the connection to be ranked very highly. However, since S1 shares customers with so many other venues, the score would in reality be fairly low.
To overcome this issue, I used a different metric which measures how important the two entities are for each other:

Using this metric, the similarity between S1 and S2, where the connection is only meaningful for one of the parties, would be around 0.5. If the connection was important for both sides, the value would converge to 1 while it would approximate 0 for very weak relations on both sides.
We can use this metric to build the input data for the network visualisation tool. This means we have to calculate the similarity between every possible pair of salons and collect the results in a table. This can then be taken as the input for our network, where every salon is represented by a node and the thickness of the edges between them is determined by their similarity. As a result, we receive a table similar to the one depicted in the image below.

Focusing on what’s important
For the current show case, we only look at data from salons in London. Since Treatwell has more than 5,000 salons in this area, the network visualisation is likely to become very confusing, so the number of nodes and thus edges should be reduced further. But even after reducing the number of venues to 1,032 by filtering for a minimum number of orders and customers, there are still more than 30,000 edges in the network.
Removing edges is an intricate problem, since deleting the wrong connections would change the structure of the network which we’re trying to analyse. The first intuition would be to keep only the most important (and thus strongest) edges of the network. However, this could result in leaving many nodes that only have weak connections very lonely by deleting all their incoming and outgoing edges. A better approach which helps to keep the networks original structure is to keep the most important edges of every single node instead. A reasonable threshold would be to retain the top 20% connections per node, which leaves us with round about 6,000 edges.
Visualising the salon network
After preparing the network data, it is finally time to visualise it! A great tool for this kind of visualisation is the open-source software Gephi. After feeding the data in, setting the parameters for the clustering algorithm in Gephi and starting the calculation, we can see how our network evolves:
Analysing customer circles
Finding the correct parameters for the network algorithm includes some trial and error and can take time. Once we arranged the nodes in a good way, Gephi provides different methods to manipulate the visual representation of the network. A good way to visualise categorical features is changing the nodes’ colours, while the node size is a suitable parameter to represent numerical features.
Recommend
About Joyk
Aggregate valuable and interesting links.
Joyk means Joy of geeK