

Web Performance Made Simple:
source link: https://medium.baqend.com/web-performance-made-simple-fc61d81d0c0e
Go to the source link to view the article. You can view the picture content, updated content and better typesetting reading experience. If the link is broken, please click the button below to view the snapshot at that time.


We at Baqend are working hard to make the Internet a faster place. And since we’ve already written several technical deep-dives on web performance in the past, we think now is the right time for a more synoptic discussion of page load time — and why it matters. Breaking with tradition, today’s article therefore paints the Big Picture of web performance.
If you are bored already, feel free to skip the first section.
WHAT Happens When a Website Loads?
When visiting a website, the user requests a webpage which is then transferred to and displayed on the user’s device. The central concepts behind this procedure are the following:
1.) Server
A server is a computer (program) whose main task is provisioning data, services, and other resources in a network. In the context of websites, a so-called server stores documents (HTML files, images, etc.) which it delivers to so-called clients.
2.) Client
A client is a software program (such as a browser) which is connected to a server and interacts with it. In the context of websites, the client (i.e. the browser) retrieves a website from a server (Internet address) and displays it to the user.
3.) Request
A request is a message sent from the client to the server in order to retrieve parts of a website. When a user visits a website, the browser therefore sends several requests to the web server, which then responds with the corresponding data.
4.) Response
The response is the message that the client gets in return for a request. For example, when a client sends a request for the landing page of a webshop, the response could contain an HTML file. After receipt, the client will analyze this file to determine whether additional resources need to be requested — these could be images or stylesheets, for example. If so, the client sends new requests to the server which then responds with the requested resources. For loading an average website, more than 100 requests have to be made.
5.) CRP — Critical Rendering Path
Rendering a website is like working in an assembly line: The browser has to perform a series of steps in order to display the website. Tied to these steps are so-called critical resources — without these, the browser cannot do its work. The sequence of critical assembly steps is called the critical rendering path. For optimal efficiency, developers need to minimize the number and size of critical resources and also make sure they are loaded in the order in which the browser processes them. Non-critical resources such as images, in contrast, can be loaded later in the process, because they do not block overall progress.
WHEN is a Website Actually Fast?
Users typically perceive a website as rather slow or fast, depending on when the first relevant content is displayed. Another indicator is how long it takes until you can enter data, click on the navigation bar, or interact with the website in some other way. But how can this subjectively perceived speed be translated into hard numbers that facilitate an objective comparison between websites?
While there is no single definitive answer to this question, there are various performance metrics to quantify the different aspects of page speed:
6.) TTFB — Time To First Byte
The TTFB describes how long the client has to wait from sending the first request until receiving the first data. A low TTFB does not automatically imply low page load times; there is a lot that can still go wrong until the website is fully rendered. However, minimizing the TTFB is mandatory for optimizing page speed, because some resources can only be loaded after receiving the first data. For example, images that are specified in the HTML file cannot be requested before the HTML file has been analyzed.
7) FMP — First Meaningful Paint
The FMP is the point in time at which the user gets to see important information for the first time, e.g. headline and text in a blog or search bar and product overview in a webshop. In consequence, the time until the FMP is a reasonable measure for whether or not the user perceives the website as fast. It is usually measured in seconds or milliseconds. To make it objectively measurable, the FMP is typically defined as the moment at which the viewport experiences the greatest visual change. To identify the exact moment at which this happens, measurement tools resort to video analysis.
8.) SI — Speed Index
The Speed Index is the average time until a visible element appears on-screen. Like the time to FMP, the Speed Index is also determined through video analysis and is also typically measured in seconds or milliseconds. Likewise, both measures are widely acknowledged as good numerical representations of user-perceived page speed; this distinguishes Speed Index and time to FMP from other metrics that capture hidden components of the loading process — such as TTFB.
9.) Latency
The latency of a request represents how long the client has to wait for the response to a given request. It is therefore also referred to as response time and can be seen as a speed measure for the network link between client and server. Low latency is the key to a fast website: The quicker the individual requests can be answered, the faster the browser transforms a white page into the finished website.
10.) Bandwidth
The bandwidth is also a measure of how fast the network link between client and server is. While the latency represents the time required for an individual request-response cycle, however, bandwidth represents the overall amount of data transmitted in a given timeframe. For fast Internet surfing, a transmission rate of 5 Mbit/s is generally recommended. Increasing bandwidth beyond that does not improve page load times in a significant way.
HOW Can a Website be Accelerated?
In summary of the above, the Speed Index and the time until the First Meaningful Paint are the pivotal metrics to evaluate the speed of a website objectively. But how can you turn a slow website into a fast one?
In the following, we explain different techniques that play a crucial role in performance optimization of today’s web offerings:
11.) Caching
In the context of the web, caching refers to intermediate storage of responses required for displaying websites. Through caching, a request does not have to travel all the way from the client to the original web server, but instead only from the client to the nearest cache. This reduces both workload for the original web server and request latency for the client. However, to make sure that changes to the original data are eventually reflected in the mirrored copies, all cached resources expire after a certain amount of time and are then removed automatically. The timeframe during which a resource resides in a cache is commonly referred to as its Time To Live (TTL). Since most caches keep data until expiry and do not update it until then, typically only static data is cached — i.e. information that changes infrequently or not at all.
12.) CDN — Content Delivery Network
A CDN is a globally distributed network of caching servers (so-called CDN nodes). They cache data from the original server in different locations around the world. When a client request reaches a CDN node, it immediately sends back the corresponding response (if it is already cached); otherwise, the CDN node will first forward the request to the original server and send the response as soon as it is available. In the latter case, the client’s request takes as long as a request to the actual web server. However, if many clients request the same resource from a CDN node, only the first request is slow and all subsequent ones are accelerated. Thus, the loading time of a popular website can be improved significantly by using a CDN.
13.) Browser Cache
Compared with a CDN, the browser cache brings data even closer to the client: It is located within the user’s device and therefore does not only provide fast, but instantaneous access to cached data. For example, images are not reloaded every time a user visits a website, but are typically stored in the browser cache and are thus immediately available. Unlike a CDN, though, the browser cache cannot be shared between users, so that it only improves performance when a user requests the same resource more than once.
14.) HTTP/2 — Hyper-Text Transfer Protocol, Version 2
HTTP is the standard protocol for client-server communication in the Internet. It specifies which data items are transferred in which order and how a server has to respond to a particular request. For years, Version 1 (HTTP/1.1) has been the measure of all things. But now, Version 2 (HTTP/2) is going to replace its predecessor. HTTP/2 brings many improvements, especially in the performance department. However, browser- and server-side optimizations are required for some of the new features. In consequence, only few websites are currently taking full advantage of HTTP/2.
15.) PWA — Progressive Web App
A PWA is a website that shares many of its features with native mobile apps — for example, push notifications and add-to-homescreen functionality. As a particularly relevant novelty in the context of web performance, a PWA has access to a special cache within the client device: Unlike the browser cache, though, it provides some additional functionality that make it better-suited for caching dynamic content. With this special cache, you can build websites that are usable even when there is no Internet connection at all: In offline mode, the PWA displays cached content instead of showing an error message. For the user, a progressive web app thus appears to be blazingly fast, even in scenarios where a traditional website would not even be usable at all.
WHY is Page Load Time Important For Your Business?
Various studies confirm that there is a connection between the speed of a website and its popularity among users. For instance, Amazon found that already 100 ms of additional page load time cause a revenue decline in the realm of single-digit percentages — at the size of Amazon, that’s upwards of US$1 billion per year. And also Google made their homework: If users have to wait only half a second longer for their search results, traffic drops by 20%.
In the final part of this article, we’ll go into more detail here and discuss the most important business metrics that are influenced by web performance:
16.) Traffic
The traffic of a website refers to the data flow produced by visitors. It thus loosely corresponds to the popularity of the website. There are different metrics to quantify traffic, e.g. the number of visitors or their time-on-site. As a basic rule, more traffic means more revenue for the website provider.
17.) UV — Unique Visitor
Unique visitors (UVs) are the individual people who visited the website during a given timeframe. Every single person can only contribute to the overall number by one in a given time window, no matter how often he or she visits the website.
18.) PI — Page Impression
In contrast, the number of page impressions (PIs) refers to the overall count of website visits. Here, it does not matter whether a single user visited a page twice or whether two users visited the same page once each: Every click counts as a PI. Since advertisements are typically paid for by how often they were displayed, the number of PIs often used for ad billing.
19.) CR — Conversion Rate
The conversion rate denotes the proportion of page visitors who switch from one status group to another; in e-commerce, for example, it often means the share of product page visitors who end up buying the product. Fast pages, in particular, facilitate high conversion rates, because user activity is not constantly interrupted by waiting times.
20.) BR — Bounce Rate
The bounce rate can be seen as a counterpart to the conversion rate: It denotes the share of visitors who drop out before interacting with the website. Long page load times are among the prime reasons why visitors lose interest and leave. If a website is particularly slow, potential customers might be gone, before they have even seen the website.
Conclusion: Page Load Time is Money
The speed of your website is intuitively perceivable, objectively measurable, and critical for your business success. However, there are many pitfalls on the way to a fast website — and whoever stumbles, loses the users’ favor and thus hard cash. A fast website is not only “nice to have”: It is essential to create an enjoyable user experience.
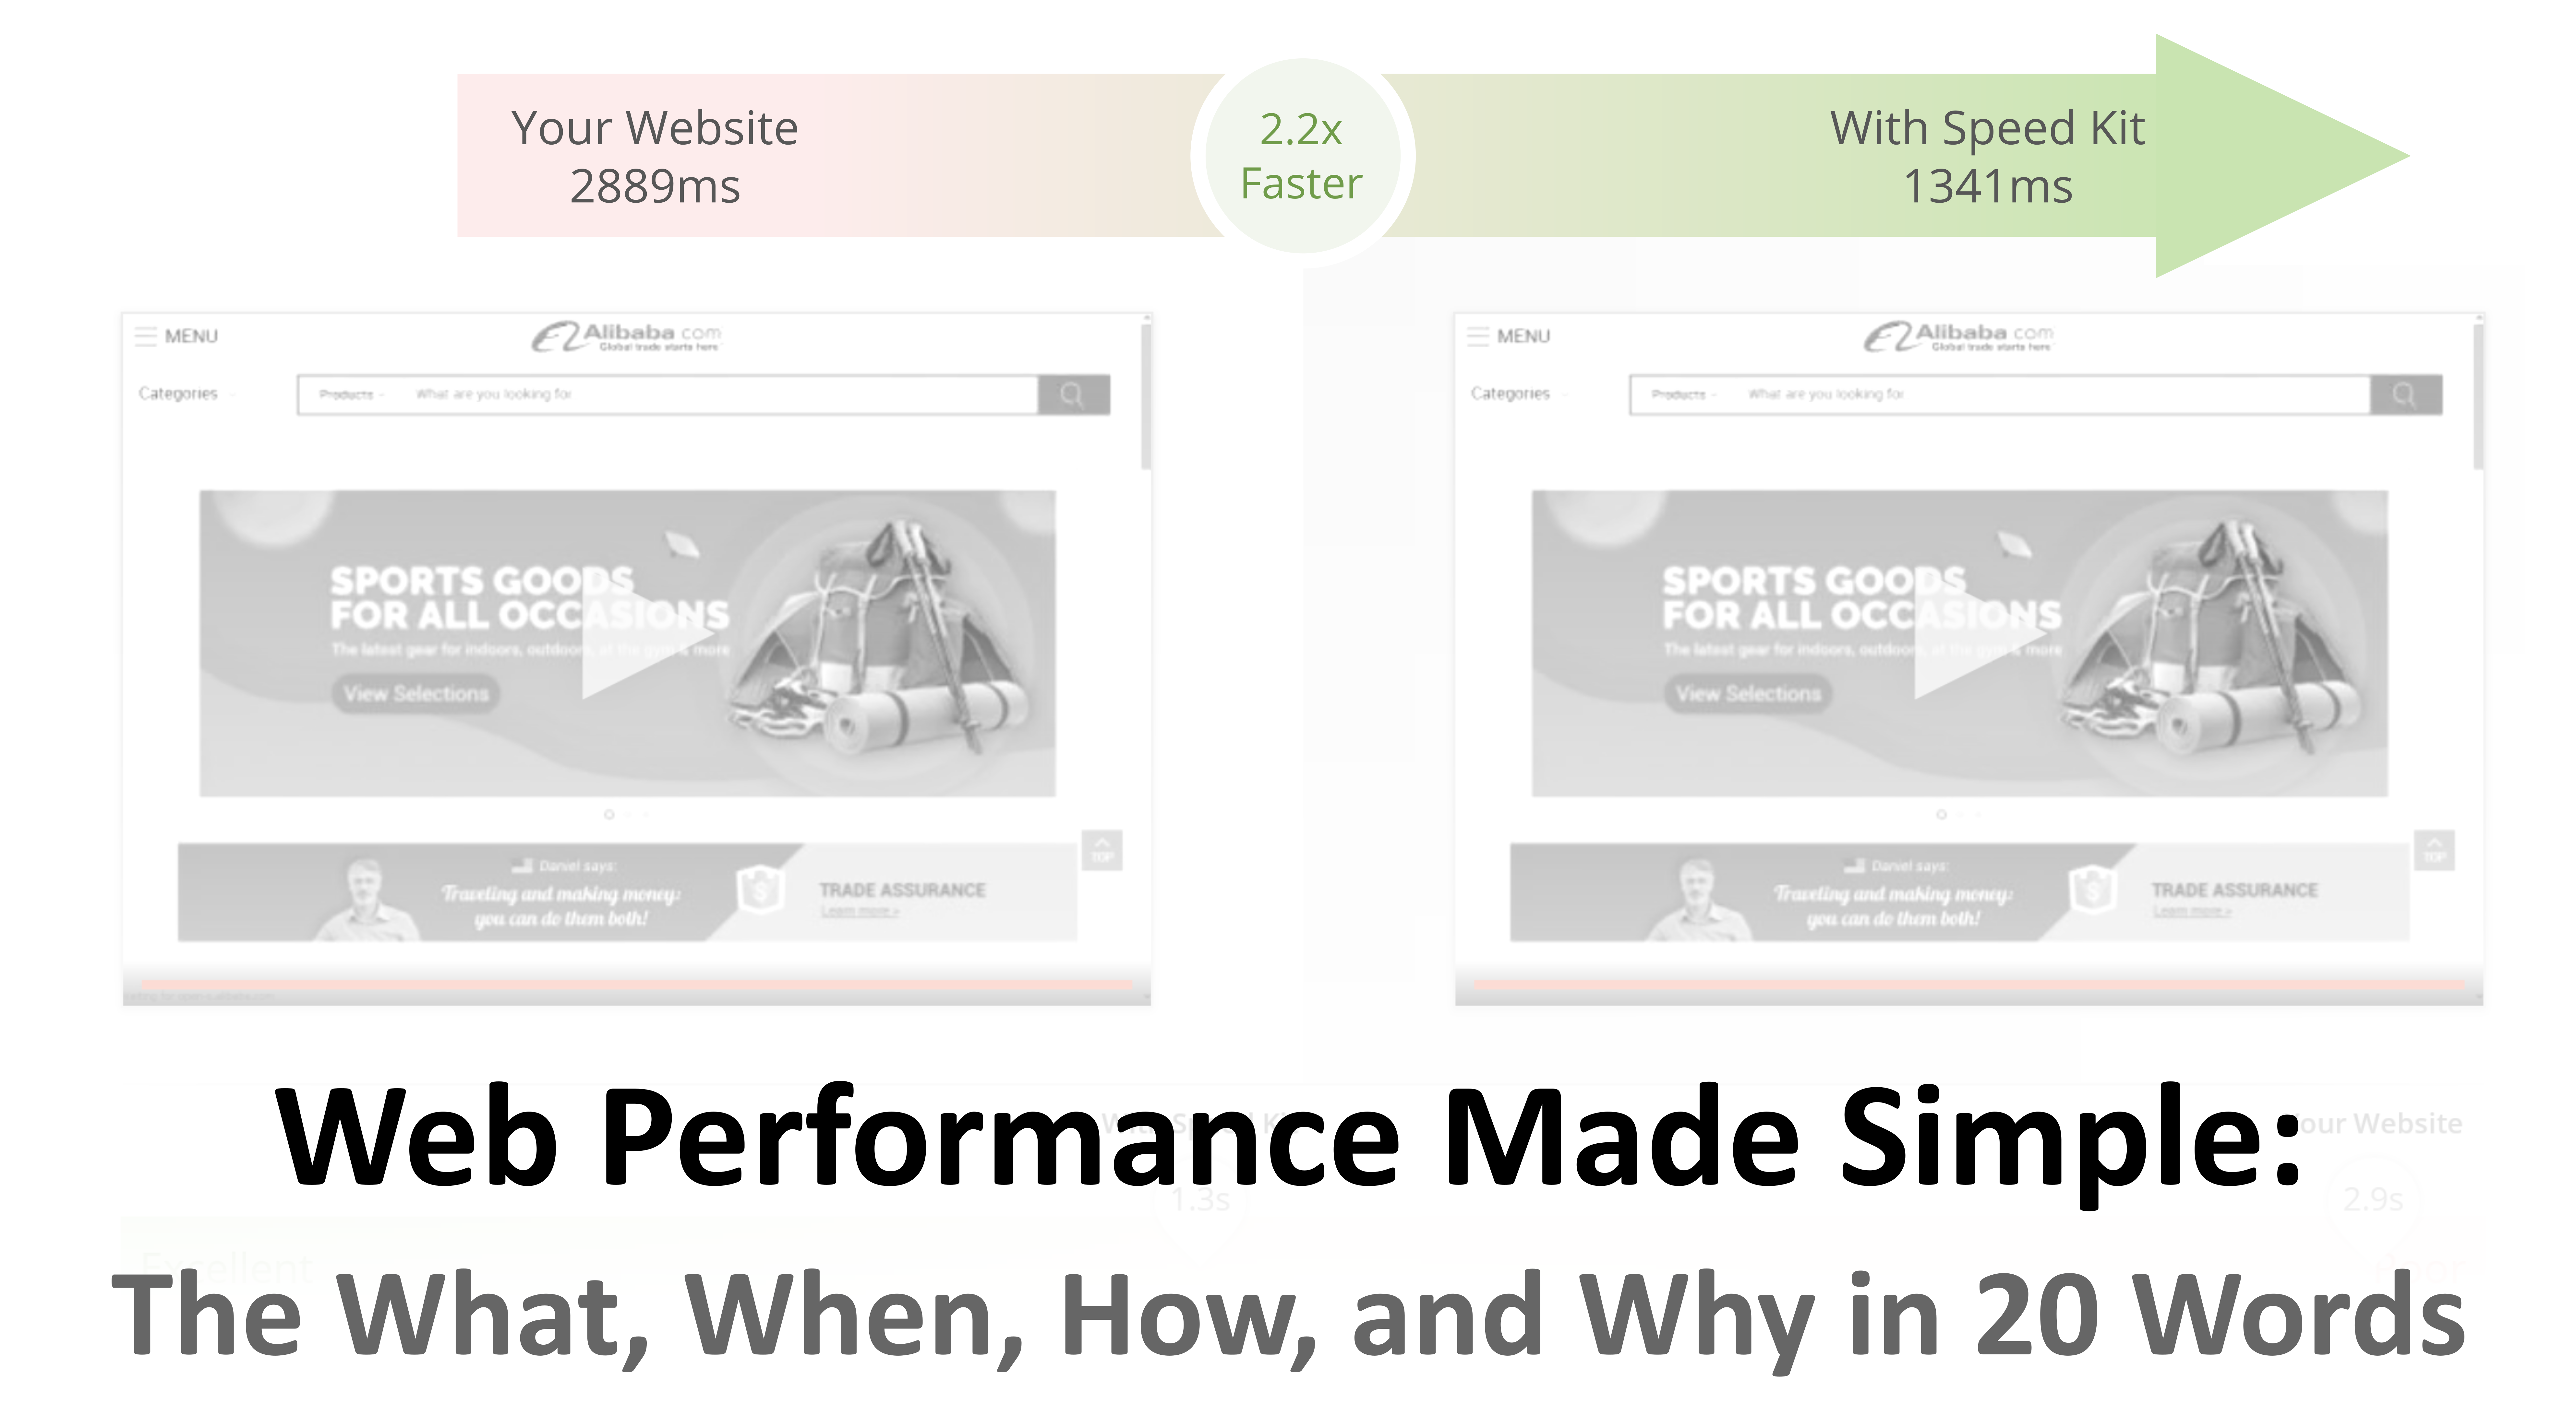
Make the Internet a Faster Place!
To remove the wizardry from performance optimization, we developed Speed Kit. It’s a plug-and-play solution that accelerates any website! Find out how fast your website could be and try Speed Kit today!
Recommend
About Joyk
Aggregate valuable and interesting links.
Joyk means Joy of geeK