

HDInsight + Hive vs BigQuery - A Detailed Comparison
source link: https://www.christoolivier.com/hdinsight-hive-vs-bigquery-a-detailed-comparison/
Go to the source link to view the article. You can view the picture content, updated content and better typesetting reading experience. If the link is broken, please click the button below to view the snapshot at that time.
HDInsight + Hive vs BigQuery - A Detailed Comparison
A big thank you goes to Daniel Haviv for his suggestion to use ORC with Snappy compression over Tez (with Vectorised reads) as well as the advice he provided to easily set this up. I have updated the post with the figures from this configuration.
A while ago I wrote about using Google BigQuery to deliver BI projects faster and for a fraction of cost. Google wrote the original white paper that gave rise to the Hadoop ecosystem we use today for Big Data, but abandoned the technology soon afterwards. Given that Google has moved in a different direction to some of the other vendors I thought it would be interesting to see how Microsoft's HDInsight stacks up against Google's offering in the Big Data space. In this post I am going to do a rather detailed comparison between the two Big Data offerings. Looking at not just query performance but also data loading, cost, data location and the reporting tools supported by each platform.
The test data
I prepared a test dataset which will be used on both platforms. I took the Contoso Retail DW sample database from Microsoft and I expanded it quite a bit to get us a more meaningful volume of data. There are 227,296,944 rows in our test dataset. Here is the schema of the data as it would be inside a SQL Server table:
[DateKey] [int],
[StoreKey] [int],
[ProductKey] [int],
[PromotionKey] [int],
[CurrencyKey] [int],
[CustomerKey] [int],
[SalesOrderNumber] [nvarchar](20),
[SalesOrderLineNumber] [int],
[SalesQuantity] [int],
[SalesAmount] [money],
[ReturnQuantity] [int],
[ReturnAmount] [money],
[DiscountQuantity] [int],
[DiscountAmount] [money],
[TotalCost] [money],
[UnitCost] [money],
[UnitPrice] [money],
[FullDate] [varchar](10),
[Month] [varchar](6),
[MonthYear] [varchar](10),
[Year] [varchar](4),
[YearName] [varchar](7),
[Quarter] [varchar](5),
[QuarterName] [varchar](7),
[ProductName] [nvarchar](500),
[ProductSubcategoryName] [nvarchar](50),
[ProductCategoryName] [nvarchar](30),
[Education] [nvarchar](40),
[BirthDate] [date],
[Gender] [nvarchar](1),
[HouseOwnerFlag] [nchar](1),
[CompanyName] [nvarchar](100),
[FirstName] [nvarchar](50),
[LastName] [nvarchar](50),
[MaritalStatus] [nchar](1),
[NumberCarsOwned] [tinyint],
[NumberChildrenAtHome] [tinyint],
[Occupation] [nvarchar](100),
[TotalChildren] [tinyint],
[YearlyIncome] [money],
[DiscountPercent] [float],
[PromotionName] [nvarchar](100),
[PromotionCategory] [nvarchar](50)
The dataset was extracted into CSV files using UTF-8 encoding. The total size on disk for the uncompressed CSV files is 63.5GB. While this is certainly not a large volume of data, it will be adequate for the overall comparison between the two tools. For example if the performance over this volume of data is not satisfactory for any of the two tools then adding a larger data volume will only exacerbate those performance woes or might show that more hardware is required which will in turn drive up the cost. The focus is to provide an overall comparison across many different areas of the two tools in question.
Loading data into the platforms
One of the challenges of large data volumes and cloud platforms is simply "How do I get my data loaded efficiently?" In our situation 63GB of data is small in the realm of Big Data but still would pose a challenge if you had to upload that amount of data each day to your specific cloud platform. Luckily both BigQuery and HDInsight support the use of compressed files, albeit in a very different manner.
HDInsight
HDInsight can use either HDFS or Azure Blob Storage as its file system. HDFS is the traditional Hadoop Distributed File System and has one major drawback which is that in order to have access to your data you need to keep the HDInsight cluster running. That means that if you spin down your cluster you lose the data that has been loaded into it and also any results of any jobs you have already run. Azure Blob Storage on the other hand eliminates this requirement to continuously run your cluster. By storing your data in Azure Blob Storage you can spin up your cluster, run your jobs which saves the results back to Azure Blob Storage, and then bring down your cluster. The results of your jobs will then still be available and you will not need to keep your cluster running 247. You will also be able to add more data easily by uploading that data to your storage and simply having it available to run jobs against whenever you need to. By using Azure Blob Storage you start to build out a Data Lake (a term coined by Pentaho CTO James Dixon). For those worrying about the performance of the solution Denny Lee did an excellent blog post explaining why it is a good idea to use Azure Blob Storage instead of HDFS, which can be found here. The next interesting step was to choose a method of compressing the data before uploading it. This would have the benefit of not requiring us to upload the larger volume of data. After initial investigation and reading some white papers I settled on GZip compression for my source files. As it showed to provide the best trade-off between compression and speed with Hadoop. I also took the decision to create two sets of data for testing, one where the CSV files were created per year and another where the CSV files were created by year and month. This was done based on this blog post by Jamie Thomson as well as guidance from some Microsoft Incubation Team members at a recent Big Data workshop I attended. Having both these data sets would also allow us to see what the impact of file size would be on our queries. The average file sizes were as follows:
- By year and month
- uncompressed: 587MB
- compressed: 26MB
- By year
- uncompressed: 7055MB
- compressed: 314MB
For uploading the data to Azure Blog Storage there are multiple options. I uploaded both compressed data sets to two separate Blob Containers using Azure Storage Explorer. For production command line use AzCopy would be the preferred choice. After the upload was complete the data looked as follows in my storage account.

BigQuery
In BigQuery data is loaded into tables and the storage of this data is handled by BigQuery itself. Data can be loaded into BigQuery tables in one of three ways:
- Data can be streamed directly into tables.
- Data can be uploaded as either CSV or JSON files, both either as uncompressed files or GZip compressed files.
- Data can be loaded from a Google Cloud Datastore backup.
The recommended way to load files into BigQuery is to first load the files into a Google Storage Bucket and then to load the files from there into the designated BigQuery table using the bq command line tool. Loading uncompressed data is faster than compressed data, however what time you save in the loading process you lose in the uploading time as the files will be much larger. One additional nice feature is the ability to kick off the loading of multiple files in parallel into the same target table asynchronously. This can speed up the loading of your data tremendously. The following link provides more information about preparing data for BigQuery. In order to load the data for this test into BigQuery I used the web interface to simply upload my 9 yearly files into a Google Storage Bucket. For production environments the bq command line tool would be the preferred way.

After the data was successfully uploaded into the Storage Bucket I used the bq command line tool to load the files into my BigQuery table. First I had to create a JSON file that represents the schema of my data, this file is used during the loading process to create the table that the data is inserted into. Alternatively I could have specify this schema as part of my call to the bq command but since we have a fair few columns the JSON file was easier to work with. Below is the bq command line syntax used to load all 9 files in parallel. (Notice the use of the triple caret symbol ^^^, this was used to escape the pipe symbol | in the windows command prompt.) For more information about using the bq command line tool you can look at the documentation here.


Querying data
In order to compare the performance of both platforms I created two queries. The first query is a very straight forward aggregation of the sales quantity grouped by year. The second query is a distinct count query that counts the number of distinct customers per product category per year. I chose the distinct count query specifically as it has traditionally been a performance challenging operation to perform in tools such as Analysis Services or in SQL Server itself. A TSQL example of each of these queries are shown below.
Sum Query:
SELECT YearName,
       SUM(SalesQuantity)
FROM [OnlineSales]
GROUP BY YearName
Distinct Count Query:
SELECT YearName,
       ProductCategoryName,
       COUNT(DISTINCT CustomerKey)
FROM [OnlineSales]
GROUP BY YearName,
      ProductCategoryName
HDInsight
Hive has become the de facto interface for Hadoop. It allows users to run map reduce jobs by using a query language called HiveQL which is very similar to SQL. Hive translates your HiveQL queries into MapReduce jobs and does incur an overhead for doing that. For this comparison we will be using Hive since most data professionals will be using Hive or one of the other tools that provide an abstraction on top of raw MapReduce as most reporting tools that work with Hadoop also uses this interface.
Spinning up clusters
HDInsight allows you to choose the size of the machines used in the cluster that you create. It also allows you to choose the number of data nodes in your cluster. In order to make sure that we get a good idea of the performance of HDInsight and the impact that different machine sizes in our cluster has I used three clusters with the following configurations:
Cluster 1
Region West Europe Operating System Windows Server 2012 Head Node Size A6 (4 cores, 28GB memory) Data Node Size A6 (4 cores, 28GB memory) No of Data Nodes 16 Total Cores 60Cluster 2
Region West Europe Operating System Windows Server 2012 Head Node Size D12 (4 cores, 28GB memory) Data Node Size D12 (4 cores, 28GB memory) No of Data Nodes 16 Total Cores 60Cluster 3
Region West Europe Operating System Windows Server 2012 Head Node Size A10 (8 cores, 56GB memory) Data Node Size A10 (8 cores, 56GB memory) No of Data Nodes 5 Total Cores 56I had to limit the number of data nodes to 13 for clusters 1 and 2, but had to reduce it to 5 for cluster 3 as I am only allowed to create a cluster with a maximum of 60 cores with my MSDN allowance. None the less these clusters should provide enough raw power to process through our 63GB of data. For those that don't know, the D machines are much more powerful machines than the normal A machines (60% faster CPU) and also have local SSD storage which the A machines do not have. The A8, 9, 10 and 11 machines are for compute intensive work so I decided to include a cluster using these machines as well. For more details about the machines have a look here. Spinning up a cluster is not instantaneous. The spin-up time for each cluster is shown in the table below.
Cluster Spin-up Time (minutes) 1 20 2 18 3 20Running the queries
All our queries were run using Hive on Apache Tez to take advantage of the performance benefits Tez provides. Each query was run once without intermediate and output compression and once with intermediate and output compression. The codec used for intermediate compression was Snappy and for output compression Gzip, this choice was based on the guidelines in the book Programming Hive as well as the Microsoft white paper Compression In Hadoop. There are many more codecs that can be used and exploring all of them falls outside of the focus of this blog post. As we were using Azure Blob Storage for our storage layer I created two external tables, one on each of the folders I loaded the datasets into. Other than changing the table name, the syntax of the queries did not need to be rewritten to run on Hive and could be run exactly as they were in TSQL. Granted these are very basic queries but it is still welcome to see as it makes HiveQL easier to pick up for new users. Below are two examples of the syntax used to run the queries.
Query without compression
SET hive.execution.engine = tez;

USE retaildata;

SELECT YearName,
       SUM(SalesQuantity)
FROM OnlineSalesByMonth
GROUP BY YearName;
Query with compression
SET mapred.map.output.compression.codec=org.apache.hadoop.io.compress.SnappyCodec;
SET hive.exec.compress.intermediate=true;
SET mapred.output.compression.type=BLOCK;
SET hive.exec.compress.output=true;
SET mapred.output.compression.codec=org.apache.hadoop.io.compress.GzipCodec;
SET hive.execution.engine = tez;

USE retaildata;

SELECT YearName,
       ProductCategoryName,
       COUNT(DISTINCT CustomerKey)
FROM OnlineSalesByMonth
GROUP BY YearName,
         ProductCategoryName;
The results of the queries on each cluster are shown below.
Cluster 1
QueryCompressionDatasetDuration (seconds) SUMNoBy Month141.215 SUMNoBy Year229.686 SUMYesBy Month129.161 SUMYesBy Year222.596 DISTINCT COUNTNoBy Month151.023 DISTINCT COUNTNoBy Year265.577 DISTINCT COUNTYesBy Month143.606 DISTINCT COUNTYesBy Year242.179Cluster 2
QueryCompressionDatasetDuration (seconds) SUMNoBy Month95.471 SUMNoBy Year159.023 SUMYesBy Month90.641 SUMYesBy Year152.811 DISTINCT COUNTNoBy Month103.223 DISTINCT COUNTNoBy Year176.069 DISTINCT COUNTYesBy Month99.291 DISTINCT COUNTYesBy Year167.413Cluster 3
QueryCompressionDatasetDuration (seconds) SUMNoBy Month138.261 SUMNoBy Year122.129 SUMYesBy Month72.342 SUMYesBy Year117.922 DISTINCT COUNTNoBy Month148.748 DISTINCT COUNTNoBy Year133.47 DISTINCT COUNTYesBy Month79.029 DISTINCT COUNTYesBy Year135.173In almost all cases, except for the DISTINCT COUNT on Cluster 3, the queries running with compression enabled were faster, and sometimes by significant margins. From the results it is also clear that the choice of machines, the size of your cluster and the way you split your source files have a significant impact on your performance. It is clear that there are a lot of factors to consider when creating HDInsight clusters and that creating an HDInsight cluster is a complex undertaking if you want to get the best performance for you money.
Update
Based on the comment from Daniel Haviv I have included a set of tests where I converted the data to ORC format and then ran the queries over Tez with Vectorised Reads. Below are the results on each of the clusters. It is worth noting that the process of converting the data from its compressed format in Azure Blob Storage to ORC format in HDInsight does take additional time. Each of the results below also shows how long it took to load the data into the ORC format before the queries could be run.
Cluster 1
Time to load into ORC format table: 923.19 seconds
QueryCompressionDatasetDuration (seconds) SUMYesORC53.074 DISTINCT COUNTYesORC153.105Cluster 2
Time to load into ORC format table: 593.646 seconds
QueryCompressionDatasetDuration (seconds) SUMYesORC37.952 DISTINCT COUNTYesORC91.71Cluster 3
Time to load into ORC format table: 424.607 seconds
QueryCompressionDatasetDuration (seconds) SUMYesORC34.971 DISTINCT COUNTYesORC77.395It is clear from the above results that the ORC format is much faster for the SUM aggregation however it seems that it did not improve the DISTINCT COUNT query times in any significant way.
BigQuery
Once the data has been loaded into a table in BigQuery it is ready for querying whenever you need. BigQuery does not have the concept of machines or a cluster like HDInsight. There is no hardware configuration or administration that needs to be done. BigQuery is a massively parallel processing column store technology built from Google's Dremel technology. That means that your queries would only run against those columns in a table which are defined in your queries. BigQuery uses its own SQL-like syntax which is constantly being brought closer to ANSI SQL. In some circumstance you might need to change your query to take advantage of BigQuery SQL functionality. A quick look at the details of our table in BigQuery shows us the following.
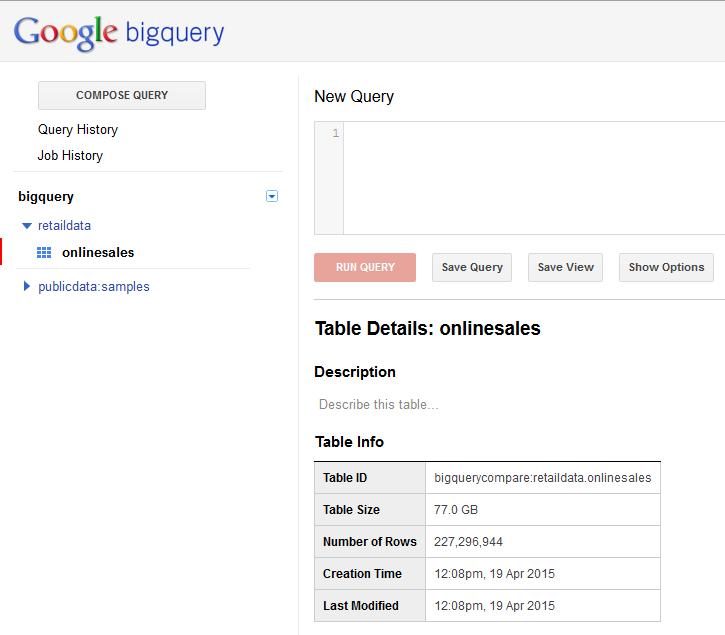
Our compressed files were extracted and takes up 77GB of space in BigQuery.
Running the queries
The first query is our SUM query. This query requires no modification, other than changing the table name against which it is running. There is no compression settings or engine settings to configure. The only settings are shown in the screenshot below.

The most interesting here is the Query Caching and Query Priority. Query Caching will fetch the results of a query from the query cache if the results exist in the cache. This normally translates into an extremely fast response if the results have previously been cached and also has the added benefit that Google does not charge you for results fetched from the cache. For more information see the documentation here. Query Priority determines how fast your query will be submitted and executes. If set to Interactive the query is run immediately and is billed at a higher rate. If set to Batch the query is executed when idle resources becomes available which is normally within a few minutes but could take up to a maximum of 3 hours. Batch queries do not count to your concurrent rate limit in BigQuery, making it easier to start many queries at once. For more information see the documentation here. The SUM query completed and returned the results in 1.3 seconds and processed 3.6GB of data.
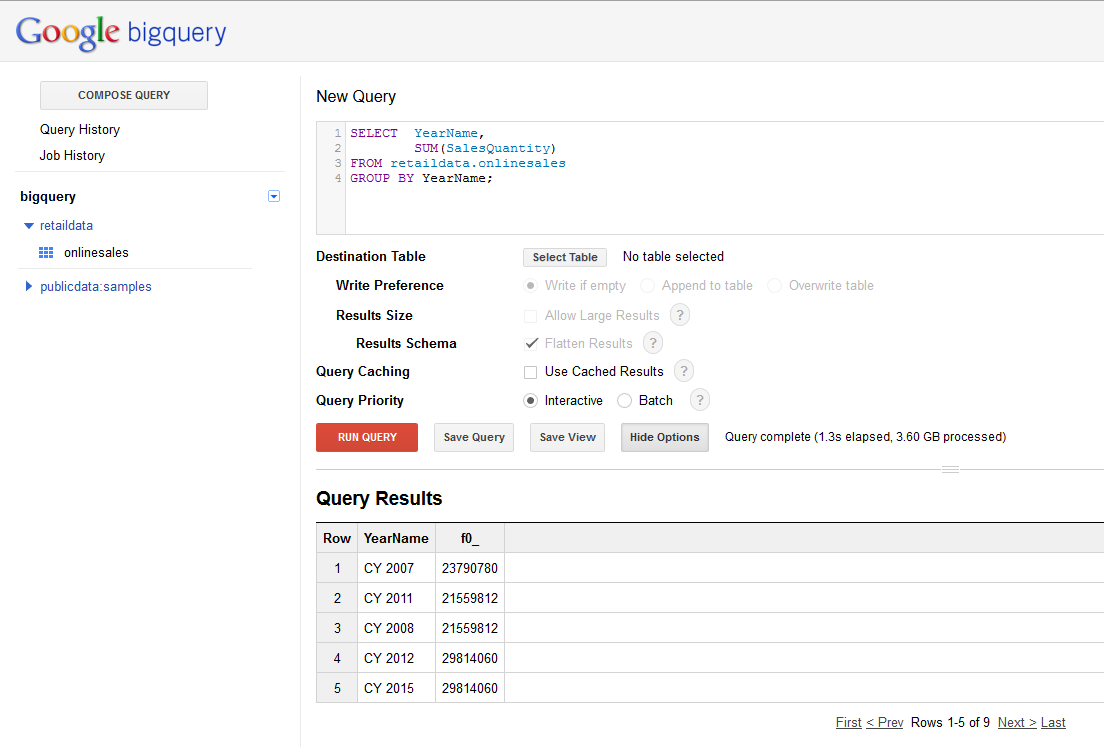
The DISTINCT COUNT query also required no syntactic changes. The query completed and returned the results in 2.2 seconds and processed 6.89GB of data.

Below is a table that shows the execution times of each query with Batch and Interactive priority as well as with Caching turned on.
QueryInteractive / BatchQuery CachingDuration (seconds)Data Processed (GB) SUMInteractiveNo1.33.6 SUMInteractiveYes0.6N/A SUMBatchNo78.23.6 SUMBatchYes71.7N/A DISTINCT COUNTInteractiveNo2.26.89 DISTINCT COUNTInteractiveYes1.3N/A DISTINCT COUNTBatchNo79.56.89 DISTINCT COUNTBatchYes72.9N/AData location
One of the most contentious issues with regards to using cloud service is the issue of data location. Due to the regulations that govern some organisations this can prevent the use of services that cannot guarantee that data would not leave a specific geographic region. This was an area where up to recently HDInsight was ahead of BigQuery, specifically within Europe, as Microsoft Azure provided many more regional options for deploying your clusters. However Google has recently announced the availability of European data availability control, so at least in Europe we now have a choice.
HDInsight
HDInsight supports the following Regions:
- East Asia
- Southeast Asia
- North Europe
- West Europe
- East US
- West US
- North Central US
- South Central US
You have the option to configure where your cluster is created from the Azure portal, making it a simple and straight forward process.
BigQuery
Currently BigQuery supports the following Regions:
- Europe
In order to specify where your data is located you need to get in touch with the Google Cloud Platform technical support team. This does introduce a manual step and it would be welcome if in future this could be provided as a configuration choice similar to how HDInsight provides it.
Reporting against results
Once you have your results you need to display this information to your users. Both of the two platforms support many different reporting tools however native support is not always available in all reporting solutions.
HDInsight
As can be expected HDInsight benefits from native support in the Microsoft reporting tools. Power Query has built-in capabilities to pull data from both HDInsight as well as Azure Blob Storage which allows you to expose datasets from HDInsight easily to end users and tools such as Power View. A Hive ODBC Data Source is also available which allows you to run data against Hive from any tool that can create an ODBC connection. HDInsight is also supported by many of the other popular reporting tool through the ODBC driver that Microsoft makes available with HDInsight.
BigQuery
BigQuery does not have native integrated into the Microsoft reporting tools. You will not see a BigQuery option under you drop downs for data sources in Power Query. However a BigQuery ODBC driver is available from Simba or CDATA which will allow you to bring data from BigQuery into any application that allows you to configure ODBC connections. This means you will be able to bring your big query data into Excel and Power Query and in that way supply it for use with the other Microsoft reporting tools. You would need to do more planning if you want that data to be accessible for published dashboards in PowerBI or SharePoint. Outside of the Microsoft reporting tools BigQuery is natively supported by many other reporting tools such as:
For a list of third-party tools that have support for BigQuery have a look at the documentation of BigQuery here. (This list is not exhaustive and many other tools exist.)
The pricing model between the two products differ greatly, which makes a head to head comparison extremely difficult. HDInsight charges for the up-time of the machines used in your cluster while BigQuery charges based on how much data you have stored as well as the amount of data your queries process. BigQuery does not charge for the availability of the service. In order to do a comparison I performed two types of calculation. Our first calculation will be a look at how much it would cost to keep each service running for an entire month 24 hours per day. The second calculation will be a per query calculation to show how much it would cost to run each of our queries.
HDInsight
For calculating the cost of running our clusters I used the Azure Pricing site. For the purposes of our calculation we will calculate our storage for only one dataset of 2.83GB and not for both of the datasets I loaded for testing. We will also calculate 1 month as 744 hours (24 hours * 31 days).
Monthly Cost
Cluster 1
Cost Per Month (£) Total 4840.28 Blob Storage 2.83GB0.07 Head Nodes645.79 Data Nodes4194.42Cluster 2
Cost Per Month (£) Total 5498.17 Blob Storage 2.83GB0.07 Head Nodes733.08 Data Nodes4765.02Cluster 3
Cost Per Month (£) Total 5218.49 Blob Storage 2.83GB0.07 Head Nodes1490.98 Data Nodes3727.44Per Query Cost
The per query cost is calculated using the following formula:
(Total Monthly Cost / Seconds in a month) * Duration of query in seconds
Cluster 1
Cost per second = (£4840.28 / 2678400) = £0.0018
QueryCompressionDatasetDuration (seconds)Cost (£) SUMNoBy Month141.2150.2542 SUMNoBy Year229.6860.4134 SUMYesBy Month129.1610.2325 SUMYesBy Year222.5960.4007 SUMYesORC53.0740.0955 DISTINCT COUNTNoBy Month151.0230.2718 DISTINCT COUNTNoBy Year265.5770.4780 DISTINCT COUNTYesBy Month143.6060.2585 DISTINCT COUNTYesBy Year242.1790.4359 DISTINCT COUNTYesORC153.1050.2756Cluster 2
Cost per second = (£5498.17 / 2678400) = £0.0021
QueryCompressionDatasetDuration (seconds)Cost (£) SUMNoBy Month95.4710.2005 SUMNoBy Year159.0230.3339 SUMYesBy Month90.6410.1903 SUMYesBy Year152.8110.3209 SUMYesORC37.9520.0797 DISTINCT COUNTNoBy Month103.2230.2168 DISTINCT COUNTNoBy Year176.0690.3697 DISTINCT COUNTYesBy Month99.2910.2085 DISTINCT COUNTYesBy Year167.4130.3516 DISTINCT COUNTYesORC91.710.1926Cluster 3
Cost per second = (£5218.49 / 2678400) = £0.0019
QueryCompressionDatasetDuration (seconds)Cost (£) SUMNoBy Month138.2610.2627 SUMNoBy Year122.1290.2320 SUMYesBy Month72.3420.1374 SUMYesBy Year117.9220.2241 SUMYesORC34.9710.0664 DISTINCT COUNTNoBy Month148.7480.2826 DISTINCT COUNTNoBy Year133.470.2536 DISTINCT COUNTYesBy Month79.0290.1502 DISTINCT COUNTYesBy Year135.1730.2568 DISTINCT COUNTYesORC77.3950.1471BigQuery
As mentioned earlier BigQuery charges based on the amount of data stored in all of the tables in your BigQuery project plus the total data processed in each column your queries select. As we saw earlier our queries only processed a small subset of the total amount of data stored in our table, this is due to BigQuery using a columnar data structure. BigQuery charges $5 per TB of data queried per month, with the first 1TB being free, and $0.020 per GB stored per month. In our scenario we did not stream data directly into BigQuery in a real-time fashion, this is charged at a different rate as well. For an entire breakdown of the pricing of BigQuery please have a look at the BigQuery Pricing site.
Monthly Cost
In order to perform our calculation for a monthly cost I will create three scenarios ranging in storage size as well as query size. In order to calculate the amount in British Pounds (£) I am using the current exchange rate of $1 = £0.66. As mentioned earlier the first 1TB of queries per month is free and thus this is reflected in the price of each scenario.
Scenario 1 (our current test scenario)
Cost Per Month ($)Cost Per Month (£) Total 1.541.02 Storage 77GB1.541.02 Queries 1TB00Scenario 2
Cost Per Month ($)Cost Per Month (£) Total 4026.40 Storage 1TB2013.20 Queries 5TB2013.20Scenario 3
Cost Per Month ($)Cost Per Month (£) Total 40002640 Storage 100TB20001320 Queries 500TB20001320Per Query Cost
In order to calculate our per query cost I simply divided the price that Google provides for their 1TB of queries to get a per GB price which I then multiplied with the amount of data our queries processed. This gives us $0.005 per GB. As mentioned earlier the first 1TB of queries per month is free and thus the price per query shown here would only be applicable after that free quota was consumed.
QueryInteractive / BatchQuery CachingDuration (seconds)Data Processed (GB)Cost ($)Cost (£) SUMInteractiveNo1.33.60.01800.0119 SUMInteractiveYes0.6N/A00 SUMBatchNo78.23.60.01800.0119 SUMBatchYes71.7N/A00 DISTINCT COUNTInteractiveNo2.26.890.03450.0228 DISTINCT COUNTInteractiveYes1.3N/A00 DISTINCT COUNTBatchNo79.56.890.03450.0228 DISTINCT COUNTBatchYes72.9N/A00Summary
Each section in this post has given detail of how both HDInsight and BigQuery work and stack up against each other. My overall feeling after spending a lot of time with both solutions is that they differ vastly. Below are some final thoughts about each product.
HDInsight
HDInsight would probably work better for completely unstructured data sets, however in the scenario we have tested here it did not impress me at all. Firstly HDInsight requires a lot of planning and administration to ensure that your files are in the correct format and size to allow for optimal query performance. On top of this planning you still have to deal with all the administration of starting up cluster and bringing them down once you have finished running your jobs. The performance of HDInsight and Hive was unimpressive at best when not using ORC and Snappy compression. Storing data in ORC format with Snappy compression did provide some much needed reductions in the SUM aggregation query times, however the DISTINCT COUNT was not reduced by much if at all. HDInsight and Hive is not suitable for real-time querying of your data directly from reporting tools. It would need to be combined with some other technology like SQL Server Analysis Service, which incidentally is one of the solutions proposed by Microsoft. The cost of HDInsight is yet another pain point for me. HDInsight quickly becomes very expensive when you start using large clusters with powerful machines. The fact that you can use them on an on-demand basis does alleviate some of the issues with cost but increases your administration burden, and could lead to very expensive mistakes if a cluster is not brought down and left to run for longer than required. On a positive note HDInsight integrates extremely well with the Microsoft ecosystem of tools. The support for it in all of the Microsoft reporting tools allows for some very interesting use cases and does make it easy to integrate into any analytics projects on the Microsoft platform. HDInsight and Azure Blob Storage work extremely well together and allows you to build a data lake with ease. Another area in which HDInsight, and the Azure platform as a whole, performs extremely well is with regards to its fine grained control of data regions. HDInsight provides many regions to choose from and administering this is a straight forward and easy matter thanks to a great user interface or alternatively the easy to use API allowing it to be done programmatically. The documentation for HDInsight and the rest of the Azure platform is very good. This is something that is taken for granted by those who have been working with Microsoft technologies. Being able to get detailed continuously update documentation on almost everything about a product or platform should never be overlook and for this HDInsight and Azure gets top marks.
BigQuery
BigQuery is billed by Google as a true cloud service for Big Data due to it requiring no administration of machines of any kind. In this regards BigQuery is definitely the easier product to use. It requires absolutely no administration of machines and is always ready allowing you to query your data on demand. The performance of BigQuery was orders of magnitude faster than HDInsight. BigQuery is a real-time querying tool for large volumes of data that delivers on its promises. In our tests we used a small dataset of only 63GB but BigQuery was designed, and is used, to query Petabytes of data and is the tool used internally at Google to crunch through the mountains of data created by their data centres. Another area where BigQuery shines is with regards to cost. It is an extremely cost-effective solution and remains cost-effective as your data volumes grow. Not only is it vastly cheaper to run than HDInsight but the billing is also much simpler. Where BigQuery starts to suffer is when you try to integrate it with the Microsoft reporting tools. By using the 3rd party ODBC drivers for BigQuery you can integrate it with the Microsoft Reporting tools but none of the tools support BigQuery natively. If you however use any of the other non-Microsoft reporting suites such as Tableau, Qlikview or Targit then you have no problems at all as they have built in support for BigQuery and integrate perfectly with it. Another area where BigQuery lags behind HDInsight is with regards to the data regions in which your data can be located. Not only is the choice of data regions more limited but in order to set the location of your data you need to contact the Google Cloud Platform technical support team. Hopefully this process will be improved in future to remove the manual step and also to increase the number of regions to choose from. BigQuery is let down somewhat by its documentation. The documentation is not as good as the HDInsight documentation and sometimes contains code snippets that are old. This lack of constantly curated and updated documentation does BigQuery a great injustice as it detracts from an otherwise fantastic tool and can cause some frustration for its users.
Recommend
About Joyk
Aggregate valuable and interesting links.
Joyk means Joy of geeK