

METHODOLOGY
source link: https://www.datadoghq.com/docker-adoption/
Go to the source link to view the article. You can view the picture content, updated content and better typesetting reading experience. If the link is broken, please click the button below to view the snapshot at that time.

Updated June 2018. Earlier editions of this article were published in 2015, 2016, and 2017.
With thousands of companies using Datadog to monitor their infrastructure and applications, we can see software trends emerging in real time. Today we're excited to share our latest research into Docker adoption and usage.
Our first edition of this report, in 2015, showed that Docker had already built a great deal of momentum at that time. Each subsequent report has chronicled the increasing rise of containerization, which shows no sign of slowing. This edition draws from the largest sample size to date: more than 10,000 companies and 700 million containers in real-world use.
Throughout this article we refer to companies' adoption status: "adopted," "dabbling," or "abandoned." Our method for determining adoption status is described in the Methodology section below.
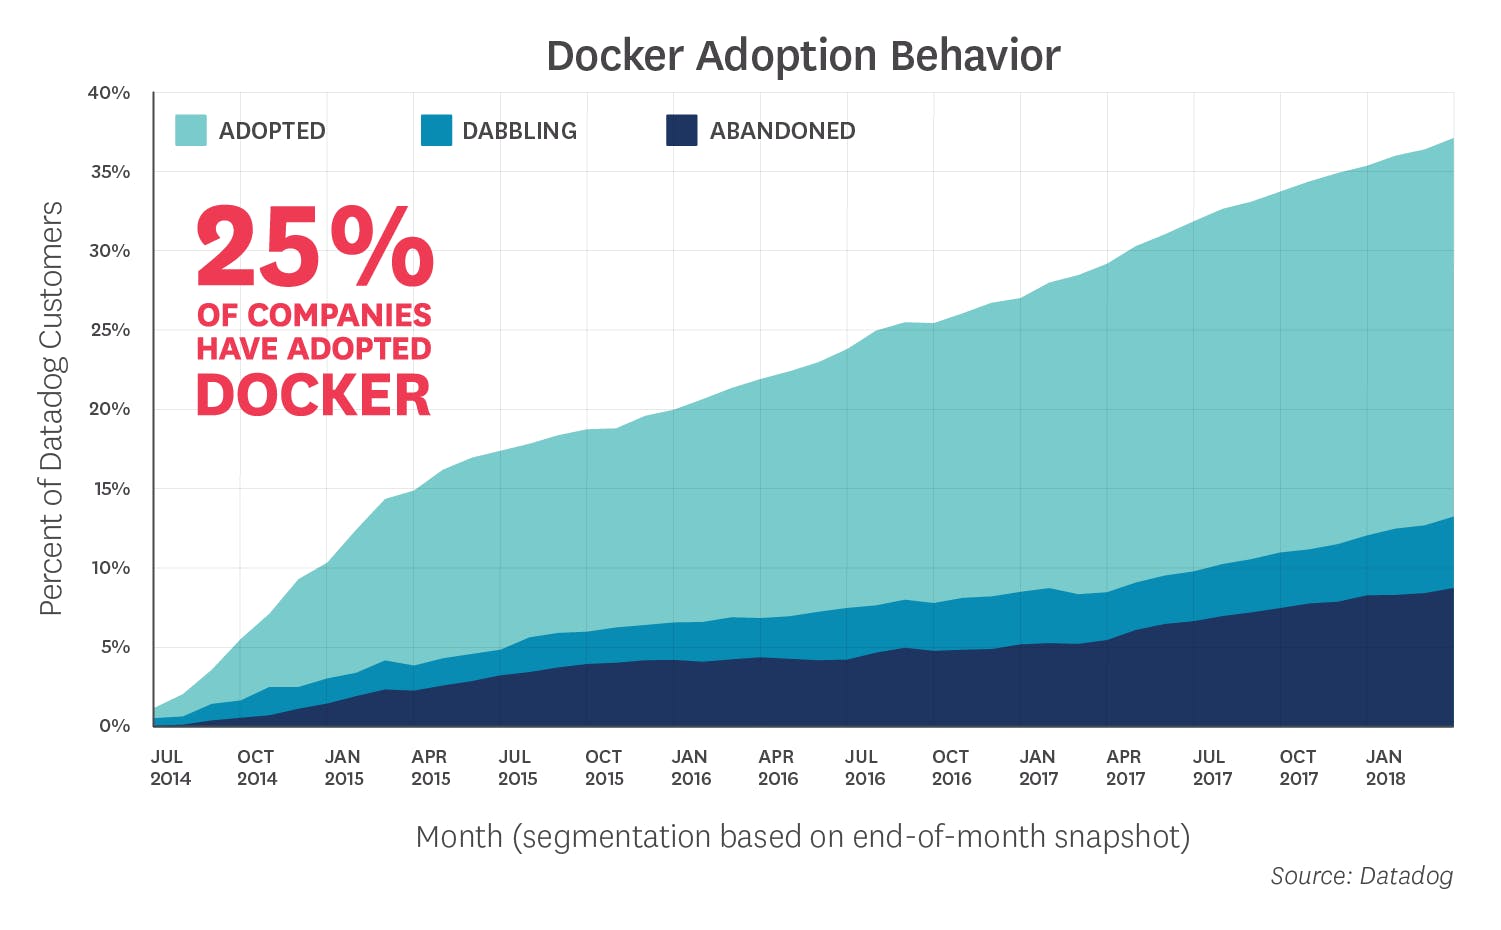
Nearly One Quarter of Companies
Have Adopted Docker
At the beginning of April 2018, 23.4 percent of Datadog customers had adopted Docker, up from 20.3 percent one year earlier. Since 2015, the share of customers running Docker has grown at a rate of about 3 to 5 points per year.
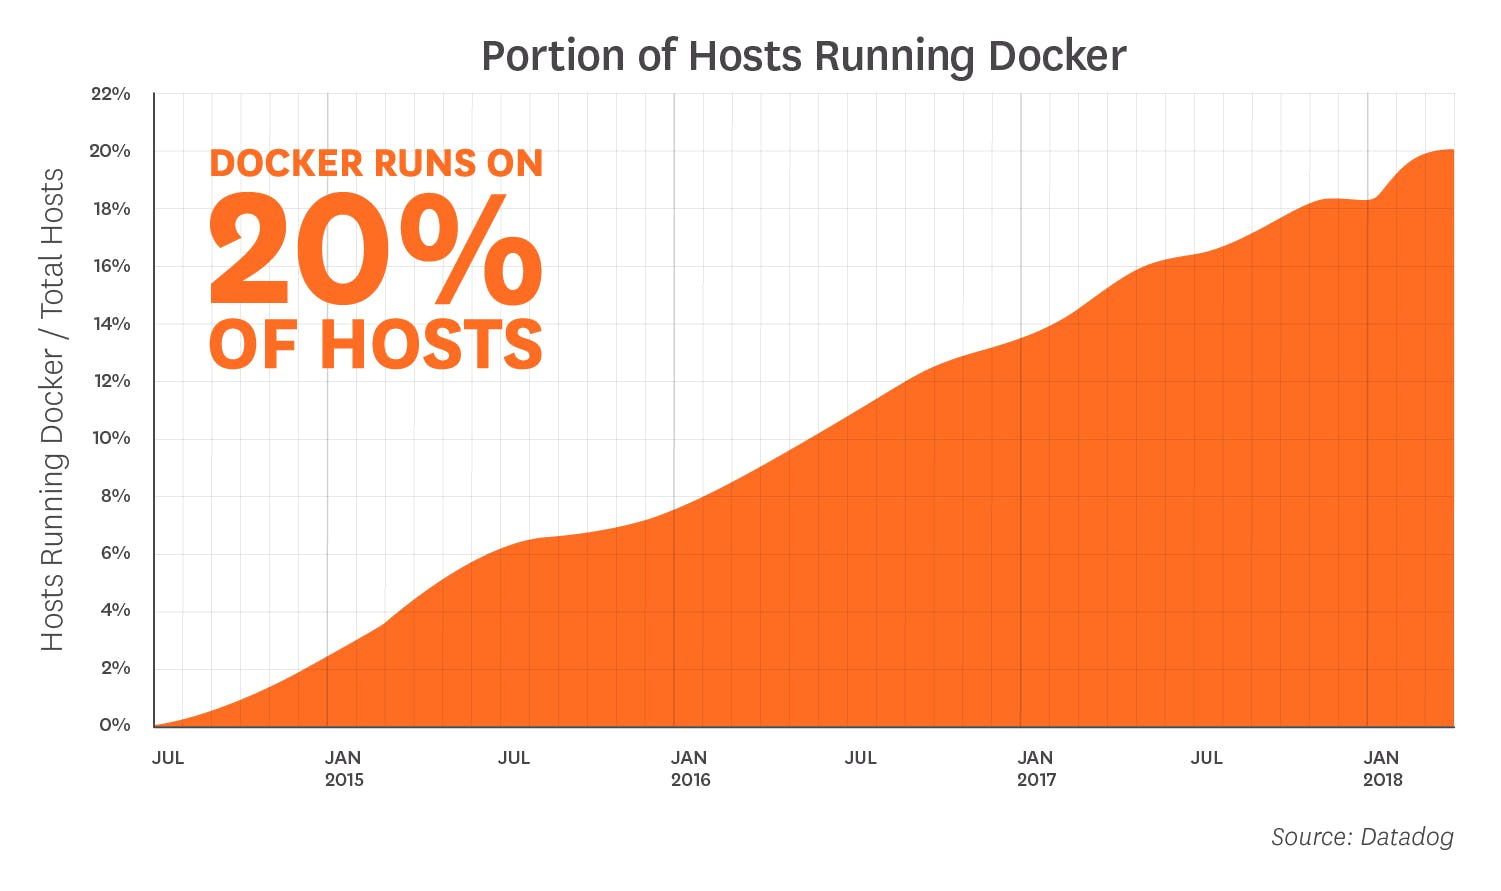
Docker Now Runs on
More Than 20% of Hosts
Across all the environments monitored by Datadog, the share of hosts running Docker also continues to climb. Approximately 21 percent of all hosts now run Docker, as of April 2018. That share has increased at a steady clip of about 5 points per year.
THREE

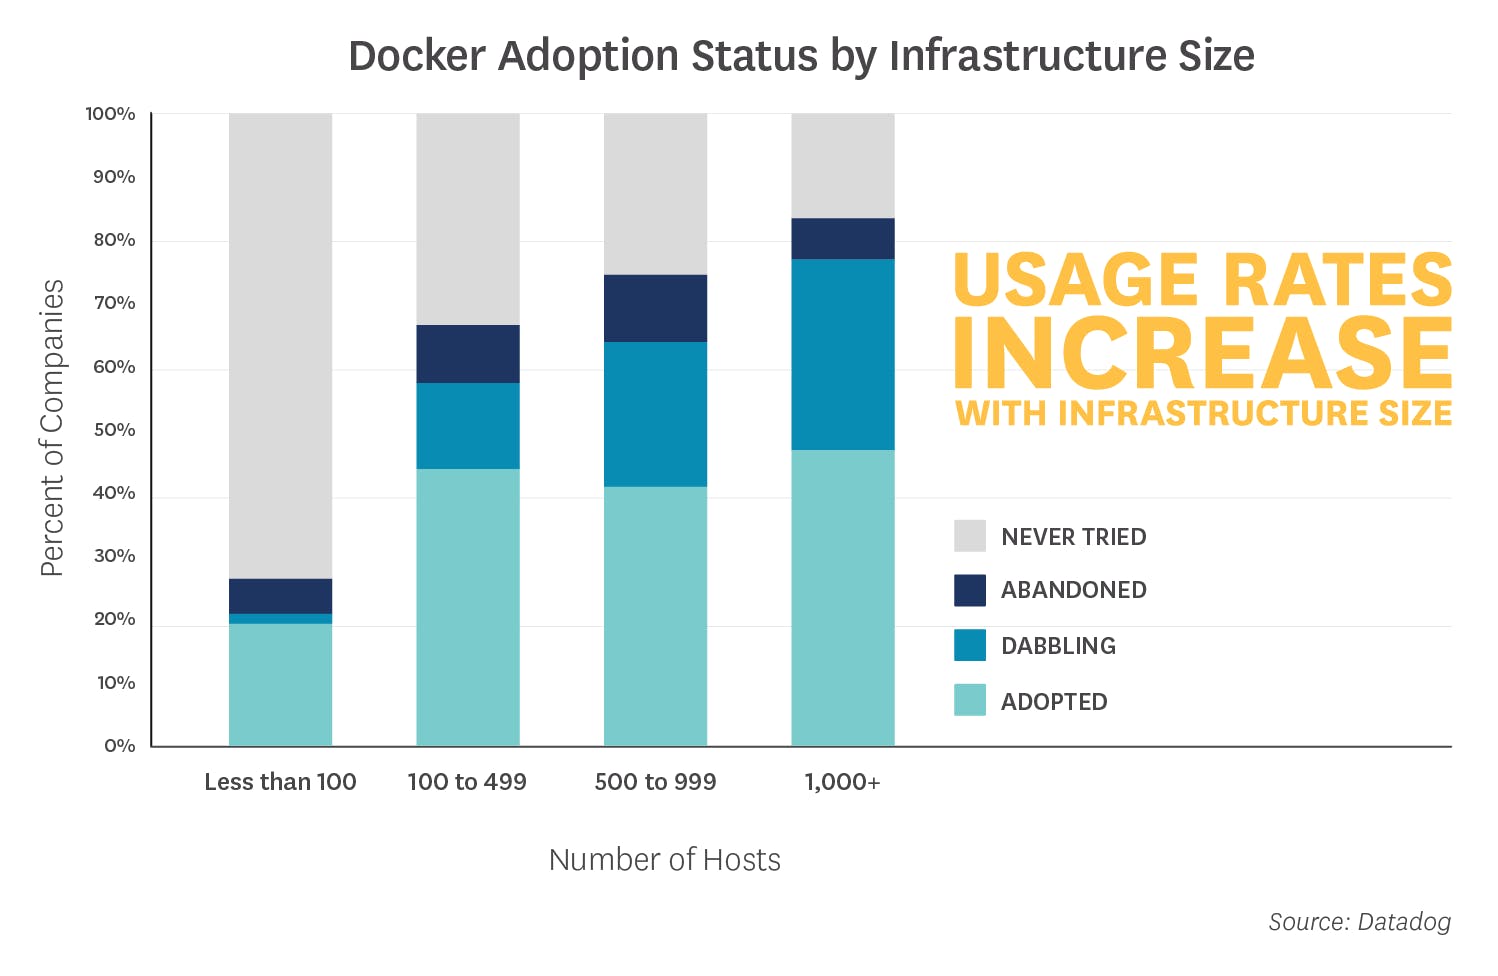
Docker Usage Rates Increase
with Infrastructure Size
When we issued the first edition of this report in 2015, we were surprised to find that the more hosts a company had, the more likely it was that the company had adopted Docker. Far from being an experimental technology only deployed by fast-moving startups, it was apparent that Docker adoption was being driven by companies with more sizable infrastructure deployments.
That trend holds true today: among the organizations with at least 1,000 hosts, 47 percent have adopted Docker, as compared to only 19 percent of organizations with fewer than 100 hosts. An additional 30 percent of organizations with 1,000 or more hosts are currently dabbling with Docker.
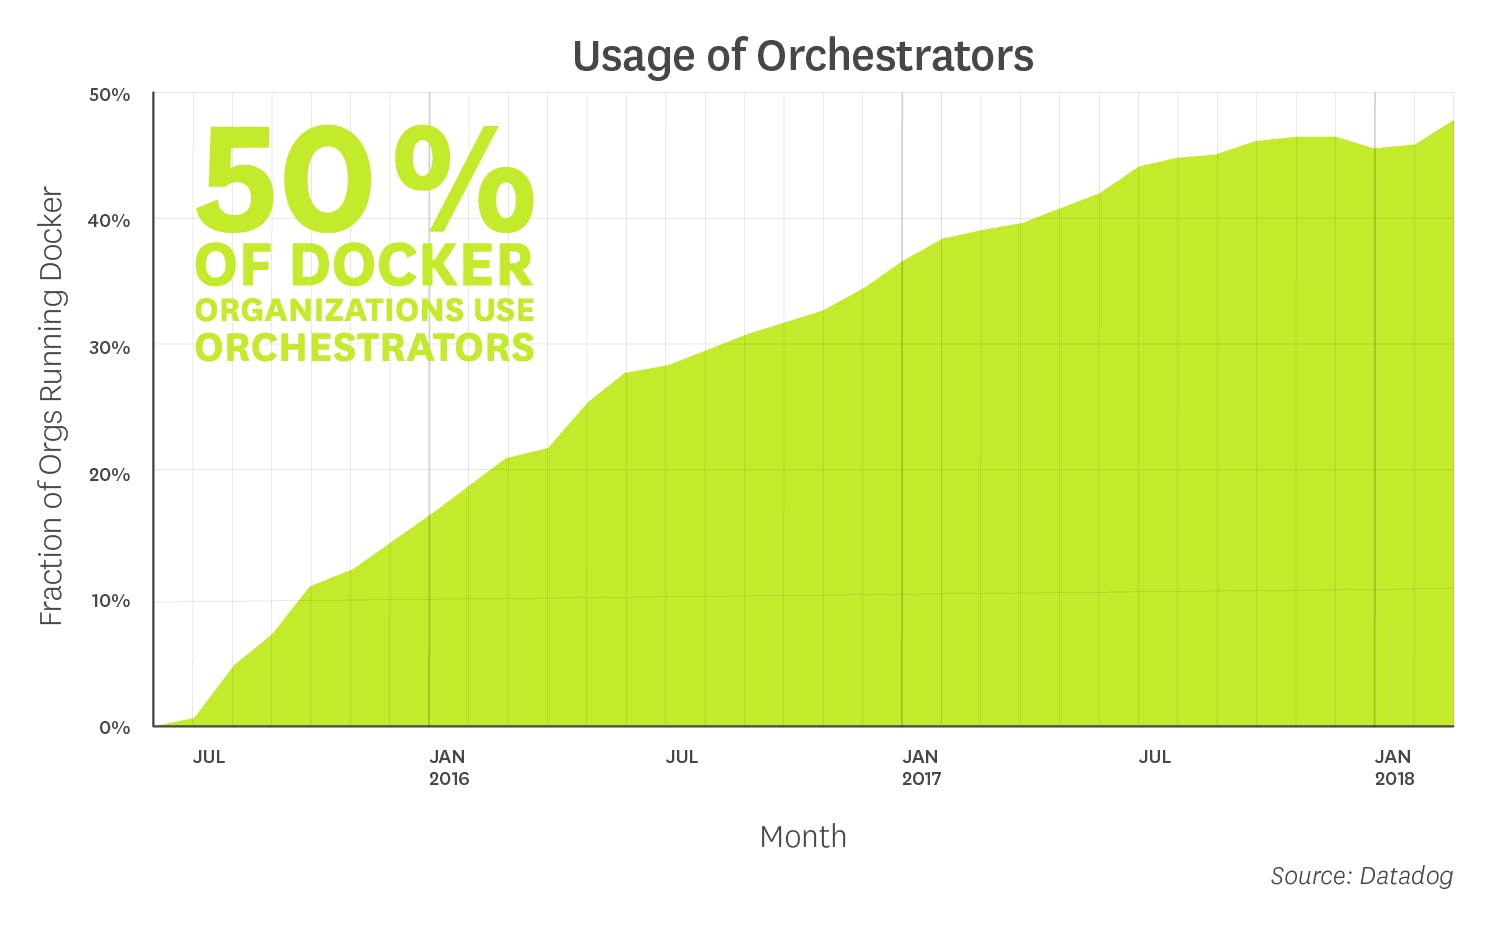
Half of Docker Environments
Are Orchestrated
Increasingly, Docker is not being run as a standalone technology but as part of a larger containerization strategy, which includes automated orchestration of workloads. Roughly half of the companies that monitor Docker with Datadog now also monitor an orchestrator such as Kubernetes or Mesos, or a hosted orchestration platform from AWS, Azure, or Google Cloud Platform.
In AWS environments, where Elastic Container Service (ECS) enables users to launch a container cluster in a matter of clicks, orchestration is especially prevalent. Roughly 70 percent of companies running both Docker and AWS infrastructure are also using orchestration. ECS continues to lead in AWS organizations, with 45 percent market share, but Kubernetes has also made steady gains and is now running in 30 percent of AWS Docker environments. With the recent launch of Amazon Elastic Container Service for Kubernetes (EKS), we expect Kubernetes adoption to accelerate in AWS over the coming months.
Across our customer base, Kubernetes is now the fastest-growing orchestration technology, and with the launch of EKS, it has now been adopted by all the major cloud providers.
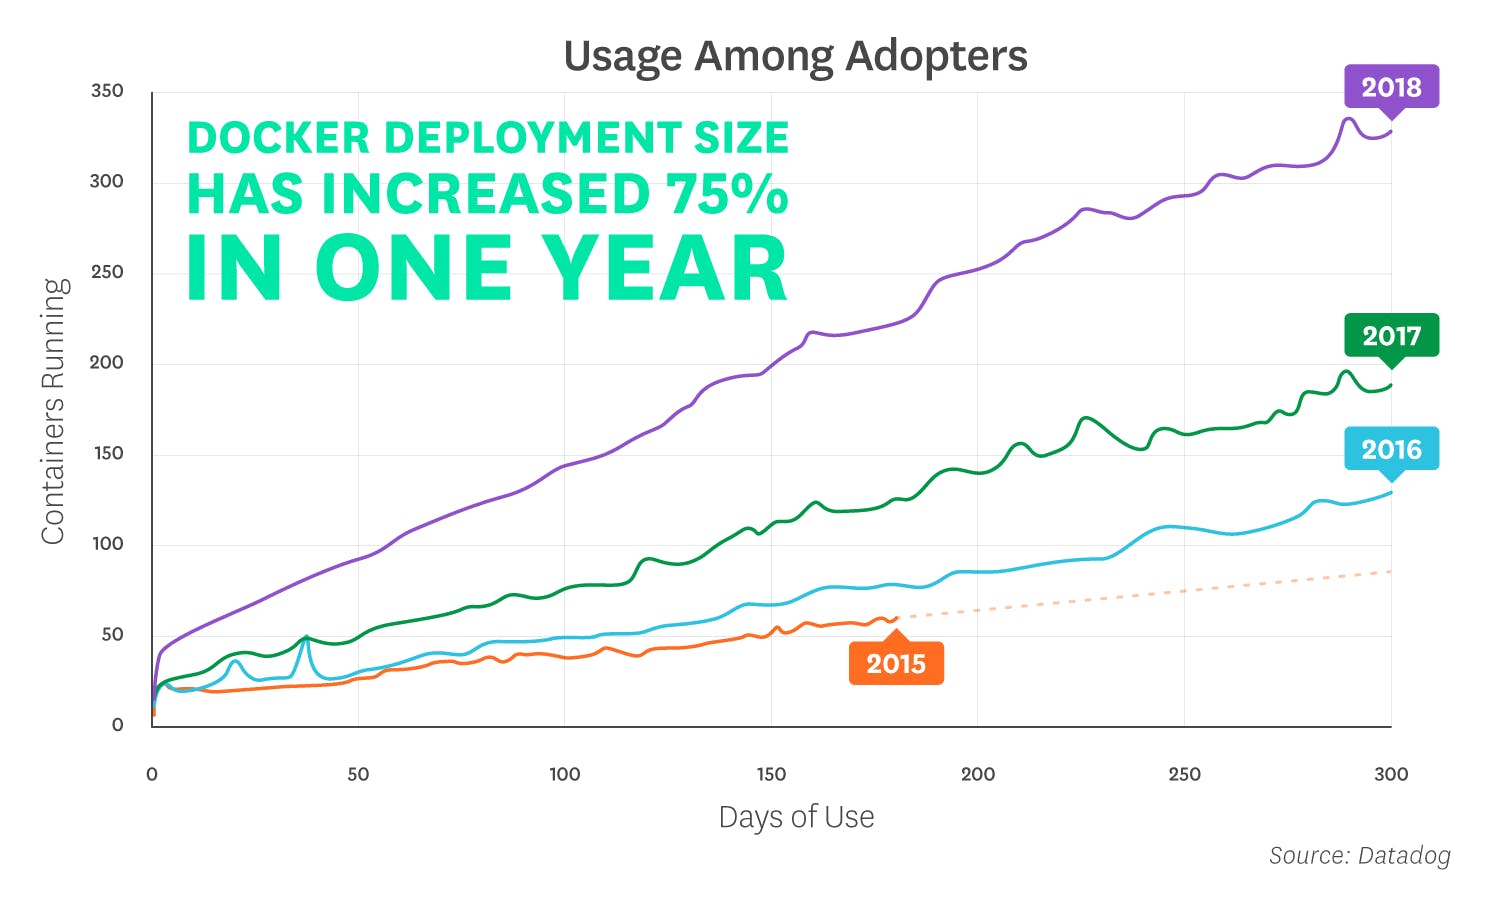
The Average Size of a Docker Deployment
Has Grown 75% in One Year
In organizations that adopt Docker, deployments tend to increase steadily in scale long after the initial rollout. Deployments are also growing faster than they have in the past—the average size of a 10-month-old Docker deployment has increased 75% since last year.

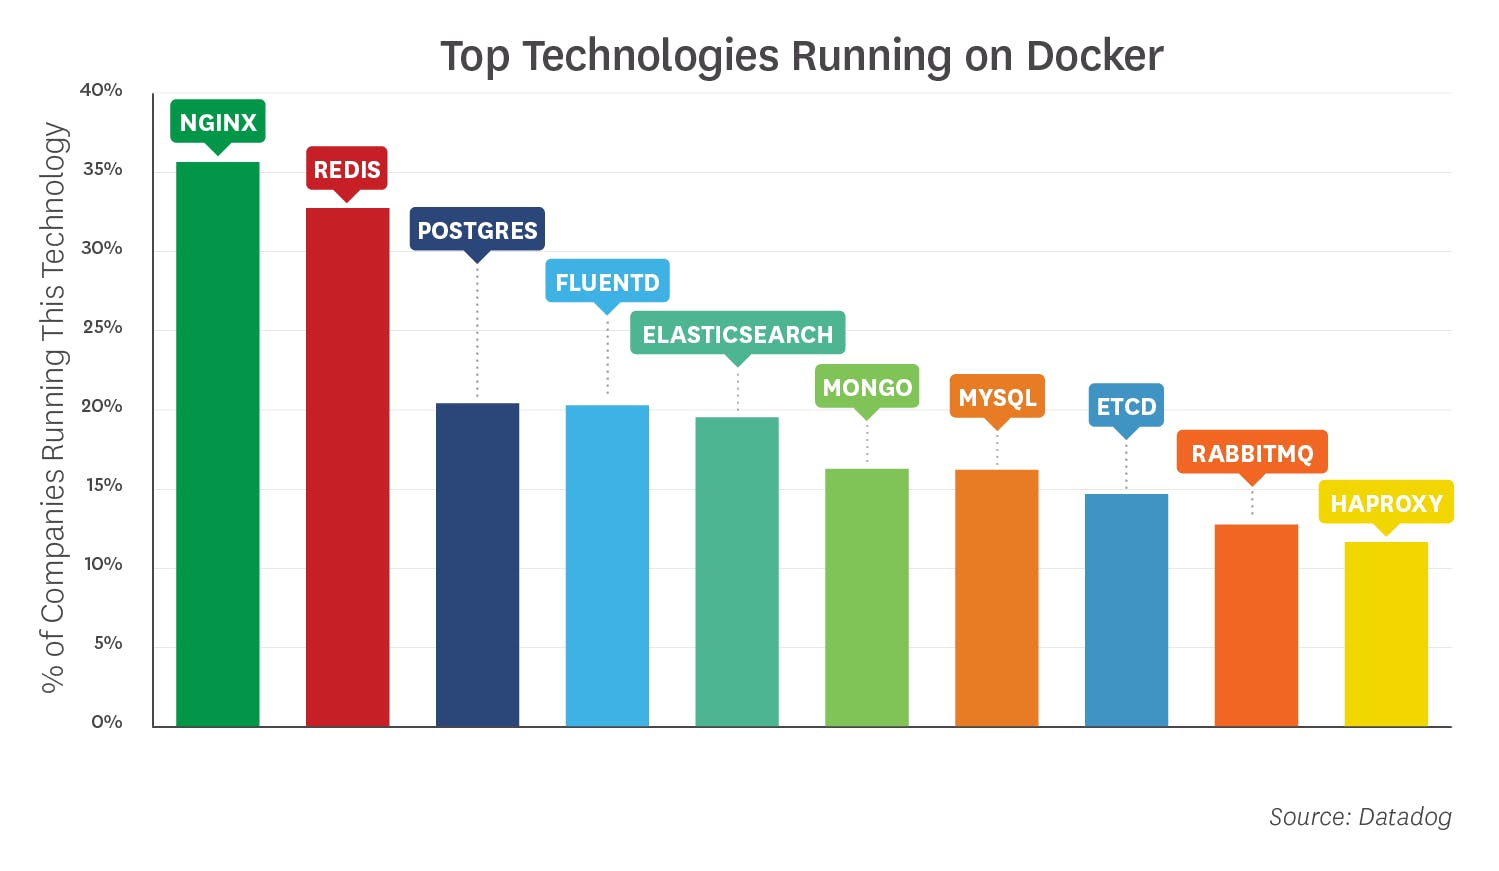
The Most Widely Used Images Are
NGINX, Redis, and Postgres
The most common technologies running in Docker are:
- NGINX: Docker is often used to deploy and run HTTP servers. NGINX has been a perennial leader on this list since we began tracking image use in 2015.
- Redis: This popular key-value store has also been a regular feature atop the list of container images. Redis is often used as an in-memory database, message queue, or cache.
- Postgres: The open source relational database has been steadily increasing in popularity. It has climbed in rank every year since it appeared in the 10th position on this list in 2015.
- Fluentd: The use of this open source "unified logging layer" in Docker infrastructure has skyrocketed, jumping from approximately 12 percent market share in our last report to more than 20 percent.
- Elasticsearch: The distributed datastore and full-text search engine remains one of the most widely deployed applications in modern container environments.
- MongoDB: The widely used document store is the go-to technology for a general-purpose NoSQL database.
- MySQL: The most popular open source database in the world continues to find wide use in Docker infrastructure.
- etcd: The distributed key-value store is used to provide consistent configuration across a Docker cluster.
- RabbitMQ: The open source message broker finds plenty of use in microservice architectures—and, the data shows, in Docker environments.
- HAProxy: The open source proxy is a popular choice for TCP and HTTP load balancing.
SEVEN
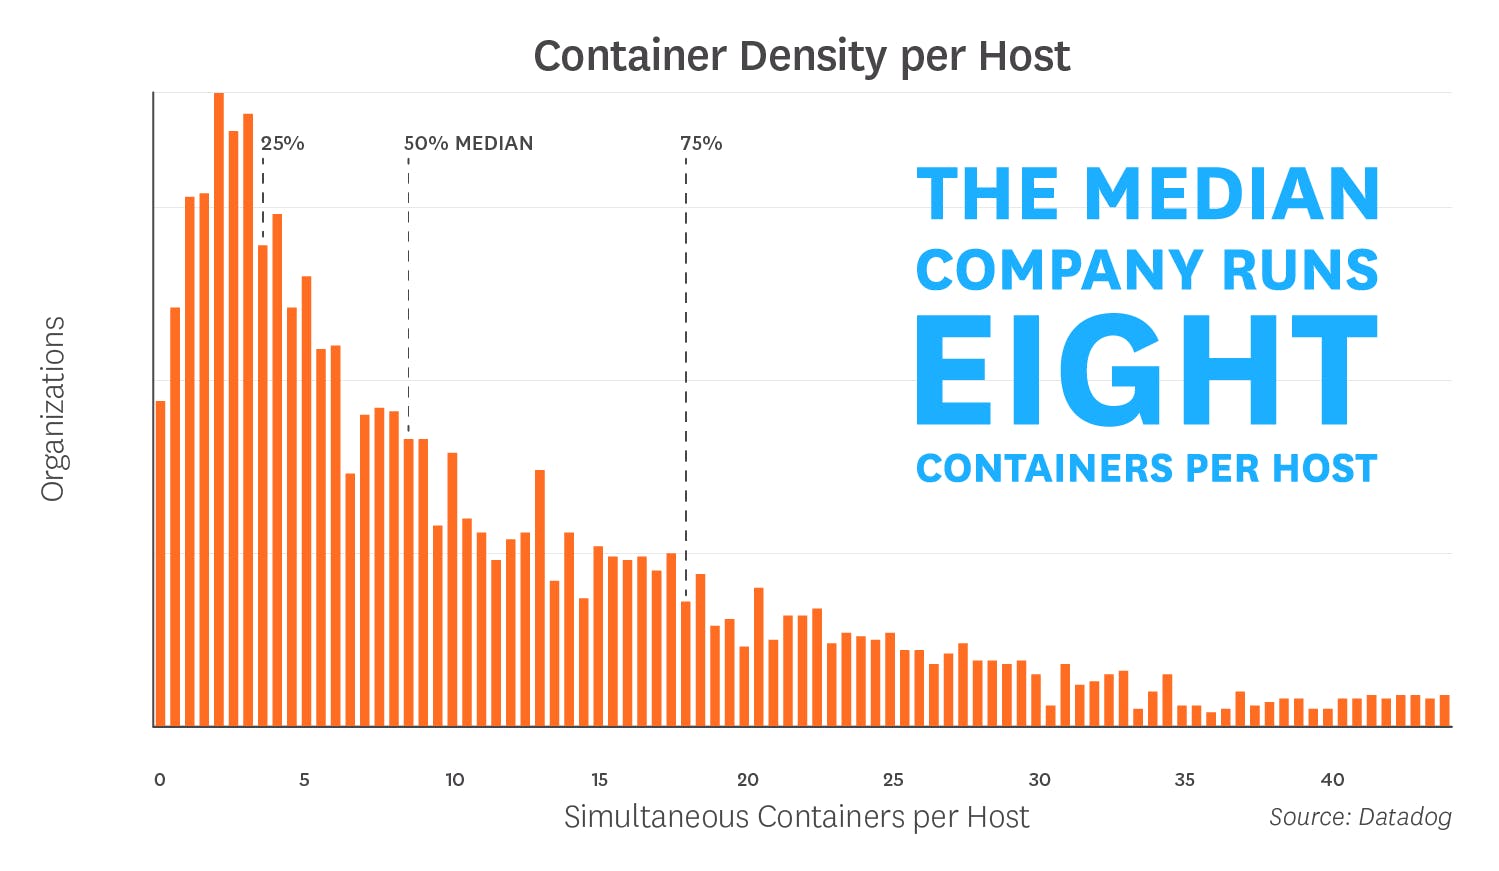
The Median Docker Organization
Runs Eight Containers per Host
The median company that adopts Docker runs eight containers simultaneously on each host, a figure that has climbed steadily over the years. This fact indicates that Docker is often used as a lightweight way to share compute resources, not just as a standardized, versioned runtime environment. Bolstering this observation, 25% of companies run 18 or more containers simultaneously on each host.
Part of the increase in container density over time may be due to the rise of orchestration technologies, which correlate with a greater number of containers per host. The typical organization that uses a container orchestrator runs 11.5 containers per host, as compared to about 6.5 containers per host in unorchestrated environments. One factor that likely contributes to the difference: orchestrators can place workload containers on any node that has sufficient resources, leading to more efficient use of host resources and increased container density.
EIGHT
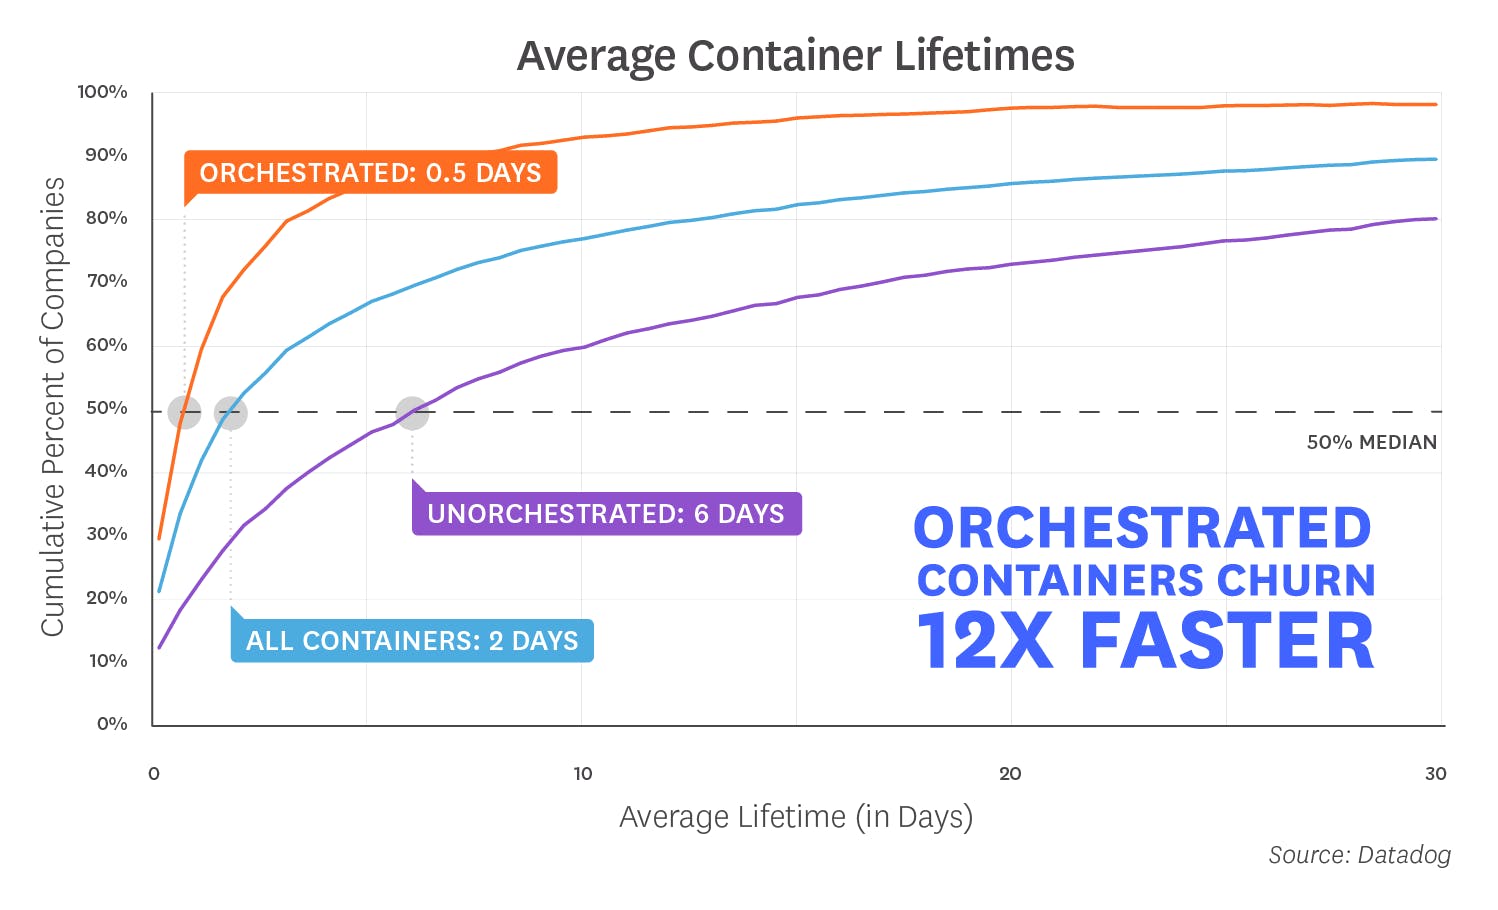
Orchestrated Containers
Churn 12x Faster
At companies that adopt Docker, containers have an average lifespan of about two days, which means that containers churn tens of times faster than hosts, where lifetimes can often be measured in months.
The rapid adoption of orchestrators (see fact 4) appears to be driving containers toward even shorter lifetimes, as the automated starting and stopping of containers leads to a higher churn rate. In organizations running an orchestrator, the typical lifetime of a container is about 12 hours. At organizations without orchestration, the average container lives for six days.
Containers' short lifetimes and increased density have significant implications for infrastructure monitoring. They represent an order-of-magnitude increase in the number of components that must be managed and monitored, and the rapid churn of containers makes it all but impossible to track and monitor containers manually. We thus expect Docker to continue to drive the sea change in monitoring practices that the cloud began several years ago: from pets to cattle, from manual to automatic deployment and configuration, and from static to dynamic infrastructure platforms.
METHODOLOGY
Population
As noted in the introduction, we compiled usage data from a sample of more than 10,000 companies and 700 million containers. However, while Datadog's customers span most industries, and run the gamut from startups to Fortune 100s, they do have some things in common. First, they take their software infrastructure seriously, and second they tend to be public and private cloud users. All the results in this article are biased by the fact that the data comes from our customers, a large but imperfect sample of the entire global market. Caveat lector.
Averages
When we talk about average numbers within our customer base (for example, the average container lifespan) we are not actually talking about the mean value within the population. Rather we compute the average for each customer individually, and then report the median customer’s number. We found that when we took a true average, results were unduly skewed by unusual Docker practices employed by relatively few companies. For example, using a container as a queueable unit of work could cause individual companies to use thousands of containers per hour.
Adoption Segments
This article categorizes companies as Docker "adopters," "dabblers," and "abandoners." Each company is recategorized at the end of each month, based on their Docker activity that month.
- Adopter: the average number of containers running during the month was at least 50% the number of distinct hosts run, or there were at least as many distinct containers as distinct hosts run during the month.
- Dabbler: used Docker during the month, but did not reach the "adopter" threshold.
- Abandoner: a currently active company that used Docker in the past, but hasn't used it at all in the last month.
Note that the adoption-segmentation thresholds are not derived from a natural grouping within the data; the data covers a continuous spectrum of use. Rather we used numbers that we felt would be intuitively meaningful to our readers.
Counting
Containers running only the Datadog Agent were excluded from this investigation, so Docker hosts that were only running the Agent were also excluded.
Fact #2
For each technology we monitor, we exclude from this calculation the organizations that are in the top 1% of its users. In other words, if a small number of companies use a particular technology in an unusual way, and use it quite heavily, they are excluded from the calculation.
Note, too, that the same basic shape of the "Percent hosts running Docker" graph persists even if we limit our population to Docker-using companies, or if we exclude the top 5% of the Docker-using companies. In all cases, the percentage of hosts running Docker has been increasing steadily since late 2015.
Fact #3
This finding is resilient to different infrastructure-size cut-points. Whether the cut-points are increased or decreased, the relative shape of the graph hardly changes, and the conclusion remains the same.
Recommend
About Joyk
Aggregate valuable and interesting links.
Joyk means Joy of geeK