

从零搭建基于 Prometheus+Grafana+AlertManager 的监控报警系统
source link: https://geekvic.top/post/c795510d.html
Go to the source link to view the article. You can view the picture content, updated content and better typesetting reading experience. If the link is broken, please click the button below to view the snapshot at that time.
业务中是否经常遇到服务器负载过高问题,或者经常碰到后台服务挂掉,却没有自动提醒功能,因此搭建一套监控报警系统势在必行。
Prometheus 目前在开源社区相当活跃,在 GitHub 上拥有两万多 Star,是当前最流行的监控系统,相比 Zabbix,定制灵活度更高,而且 Prometheus 在云环境、容器支持这块优势明显。
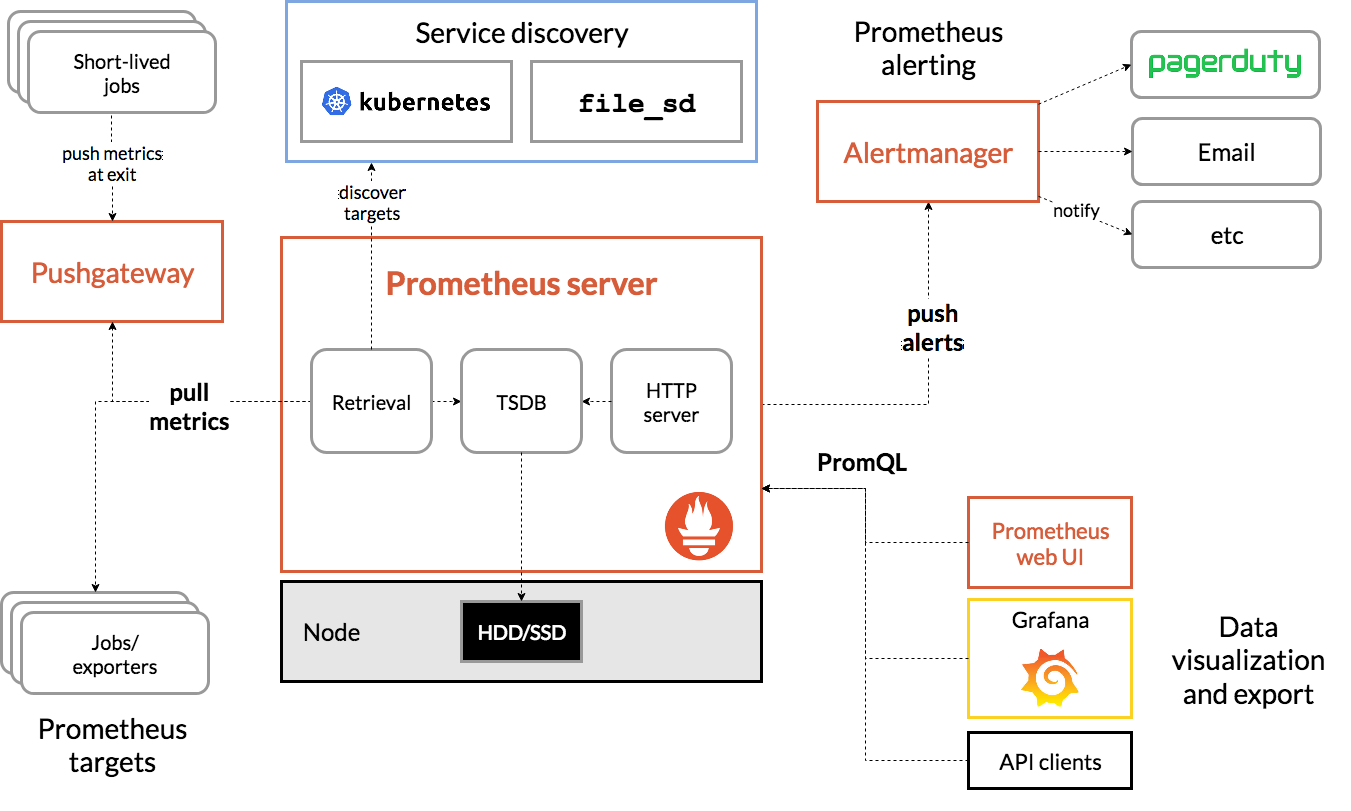
Prometheus
Prometheus 是一套开源的监控 & 报警 & 时间序列数据库的组合,基于应用的 metrics 来进行监控的开源工具。
下载 & 安装
解压:tar zxvf prometheus-2.12.0.linux-amd64.tar.gz
编辑: prometheus.yml,其中包括全局、alertmanager、告警规则、监控 job 配置,具体内容如下。
1
2
3
4
5
6
7
8
9
10
11
12
13
14
15
16
17
18
19
20
21
22
23
24
25
26
27
28
29
30
31
32
33
34
35
36
37
38
39
# my global config
global:
  scrape_interval:     15s # Set the scrape interval to every 15 seconds. Default is every 1 minute.
  evaluation_interval: 15s # Evaluate rules every 15 seconds. The default is every 1 minute.
  # scrape_timeout is set to the global default (10s).

# Alertmanager configuration
alerting:
  alertmanagers:
  - static_configs:
    - targets:
       - 192.168.88.69:9093

# Load rules once and periodically evaluate them according to the global 'evaluation_interval'.
rule_files:
   - "test_rules.yml"
  # - "second_rules.yml"

# A scrape configuration containing exactly one endpoint to scrape:
# Here it's Prometheus itself.
scrape_configs:
  # The job name is added as a label `job=<job_name>` to any timeseries scraped from this config.
  - job_name: 'prometheus'

# metrics_path defaults to '/metrics'
    # scheme defaults to 'http'.

static_configs:
    - targets: ['192.168.88.69:9090']

- job_name: 'monitor'
    scrape_interval: 5s
    metrics_path: '/actuator/prometheus'
    static_configs:
    - targets: ['192.168.88.69:8008']

- job_name: 'node-exporter'
    static_configs:
    - targets: ['192.168.88.69:9100']
启动:./prometheus &
验证安装:访问地址:http://192.168.88.69:9090/targets
Spring Boot 集成 Prometheus
配置 pom 文件
1
2
3
4
5
6
7
8
9
<!--监控-->
<dependency>
   <groupId>org.springframework.boot</groupId>
   <artifactId>spring-boot-starter-actuator</artifactId>
</dependency>
<dependency>
   <groupId>io.micrometer</groupId>
   <artifactId>micrometer-registry-prometheus</artifactId>
</dependency>
配置 yml
1
2
3
4
5
6
7
8
9
10
11
12
13
server:
  port: 8008
spring:
  application:
    name: monitor
management:
  endpoints:
    web:
      exposure:
        include: '*'
  metrics:
    tags:
     application: ${spring.application.name}
添加配置类
1
2
3
4
5
6
7
@Configuration
public class MeterRegistryConfig {
    @Bean
    MeterRegistryCustomizer<MeterRegistry> configurer(@Value("${spring.application.name}") String applicationName) {
        return (registry) -> registry.config().commonTags("application", applicationName);
    }
}
AlertManager
Alertmanager 对收到的告警信息进行处理,包括去重,降噪,分组,策略路由告警通知。
修改 alertmanager.yml,当前配置的是邮箱告警,当然还支持企业微信、钉钉等,内容如下:
1
2
3
4
5
6
7
8
9
10
11
12
13
14
15
16
17
18
19
global:
  resolve_timeout: 5m
  smtp_smarthost: 'smtp.mxhichina.com:25'       # smtp地址
  smtp_from: '[email protected]'                   # 发送邮箱地址
  smtp_auth_username: '[email protected]'          # 邮箱用户
  smtp_auth_password: '123456'            # 邮箱密码

route:
  group_by: ["instance"]                       # 分组名
  group_wait: 10s                              # 当收到告警的时候,等待十秒看是否还有告警,如果有就一起发出去
  igroup_interval: 10s                          # 发送警告间隔时间
  repeat_interval: 1h                          # 重复报警的间隔时间
  receiver: mail                               # 全局报警组,这个参数是必选的,和下面报警组名要相同

receivers:
- name: 'mail'                                 # 报警组名
  email_configs:
  - to: '[email protected]'                     # 收件人邮箱
    headers: {Subject: "告警测试邮件"}
命令:./alertmanager & ,端口号:9093
Grafana
Grafana 是一款用 Go 语言开发的开源数据可视化工具,可以做数据监控和数据统计,带有告警功能。
解压 grafana-6.3.5.linux-amd64.tar.gz,启动 ./grafana-server &,访问地址 http://192.168.88.69:3000
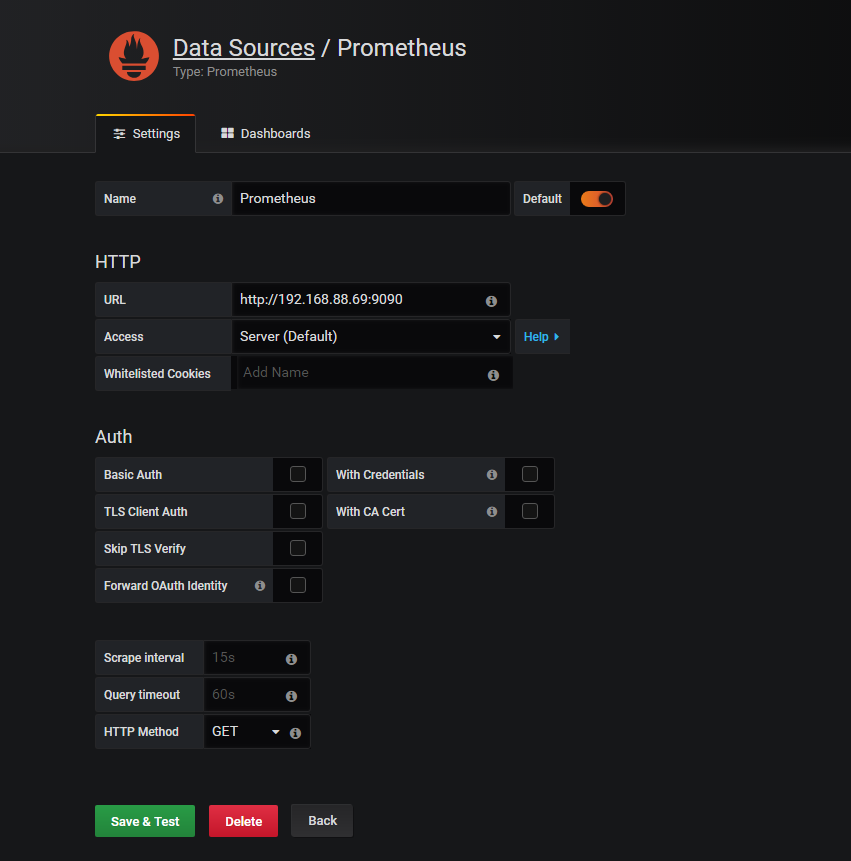
配置 Data Sources
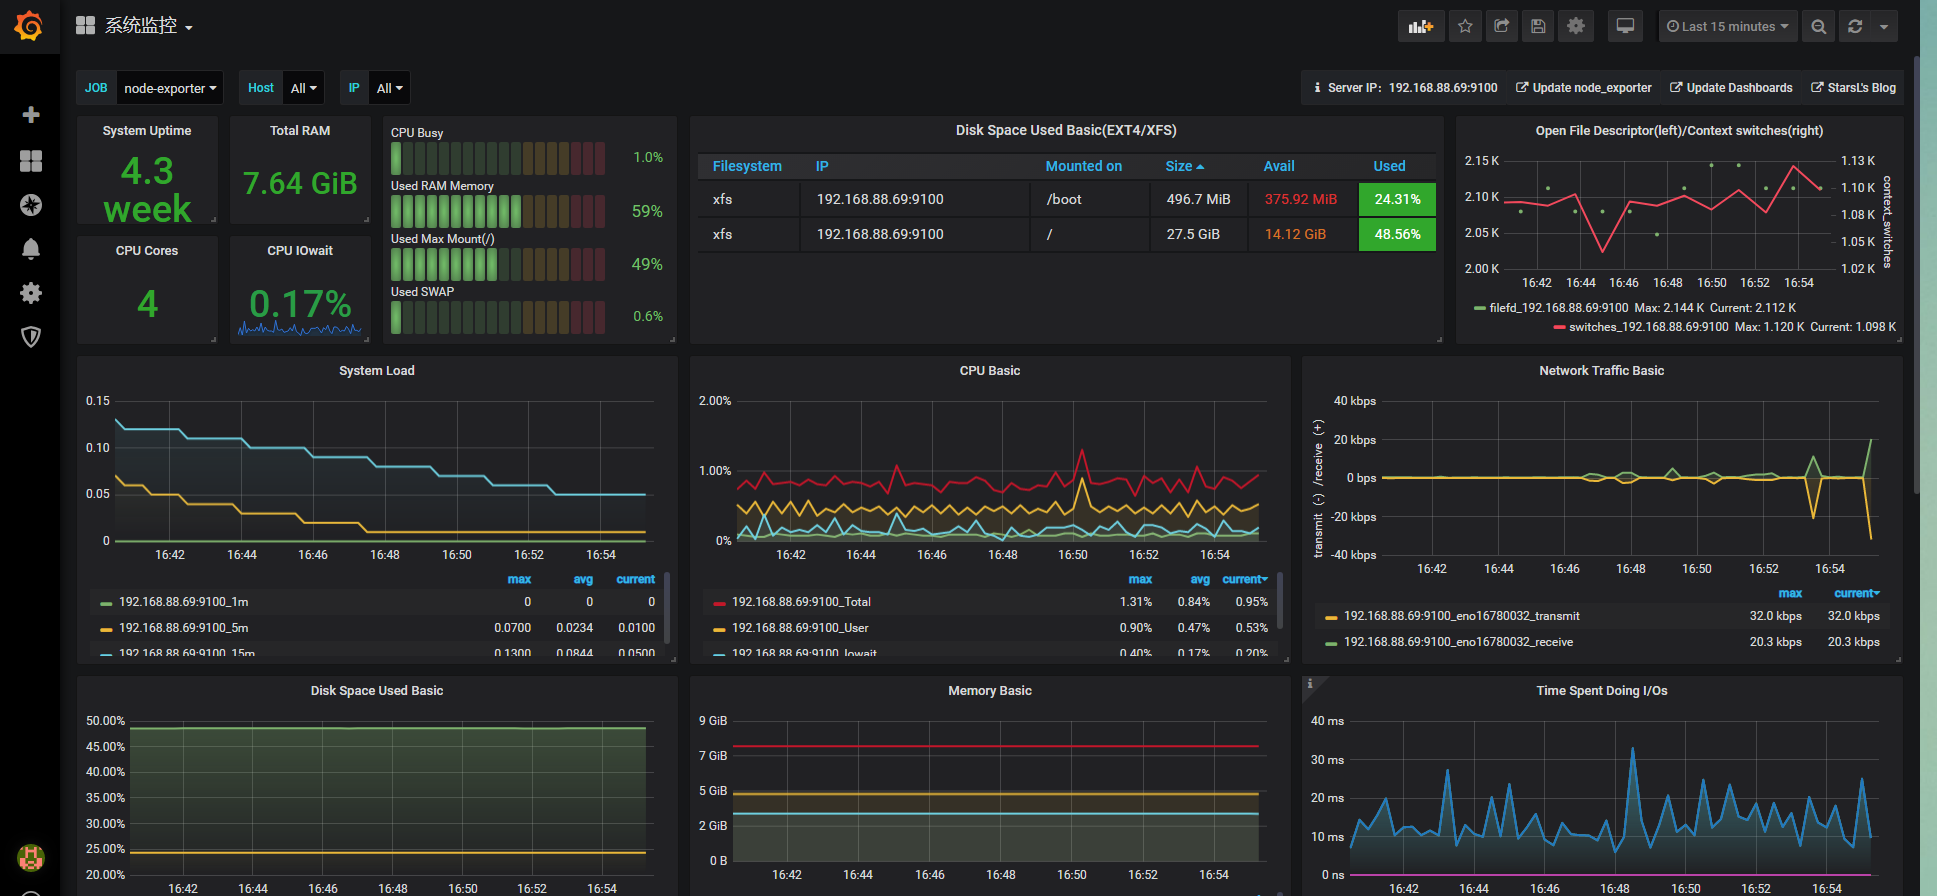
安装 exporter,如要监控服务器的运行状态,需要安装 node_exporter,并启动项目,端口号:9100,并在 prometheus 里配置节点,并重启 prometheus。
导入模板,可以在 Grafana 官网找下,地址:https://grafana.com/grafana/dashboards。
Recommend
About Joyk
Aggregate valuable and interesting links.
Joyk means Joy of geeK