

Using Chrome DevTools to debug frontend and backend JavaScript
source link: https://medium.com/chris-opperwall/using-chrome-devtools-to-debug-frontend-and-backend-javascript-ae4815065cb4
Go to the source link to view the article. You can view the picture content, updated content and better typesetting reading experience. If the link is broken, please click the button below to view the snapshot at that time.

Using Chrome DevTools to debug frontend and backend JavaScript
A console.log intervention
Using debugging tools is an excellent way to understand what is happening in your application. A debugger can help you quickly pinpoint the cause of a bug, and can also give you a more complete snapshot of your program’s state than by using console.logs. If your original hypothesis of why your program is failing is incorrect, you can potentially step further into your program without having to rerun it, which saves you time. Chrome DevTools provides a fairly good debugging experience for JavaScript not only in the browser, but for NodeJS programs that run on the backend. This post aims to show how to debug both types of programs by recreating an actual debugging experience.
The Example
The project used for this example is called Pulldasher, an open source NodeJS application written by iFixit that serves as a realtime pull request status dashboard. The code used in this example can be checked out at this commit.
The Problem At Hand
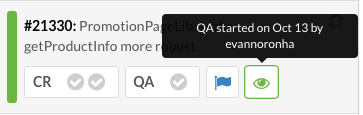
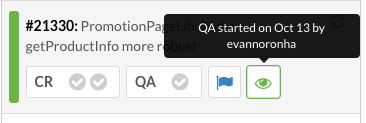
Sometime last week, an engineer at iFixit noticed that there was a display bug on Pulldasher. For background, each Pull Request has a listing on the dashboard, and each listing can contain indicators that show information about the Pull Request. When a Pull Request is being tested, an “eye” icon shows up that has a tooltip with the username of the tester and the day they started testing it. The expected behavior is shown below.
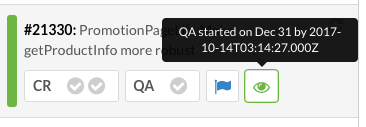
However, the tooltip was showing a Date string for the username instead of the tester’s name, as well as an incorrect date for the start time.
First Up: Front End Debugging
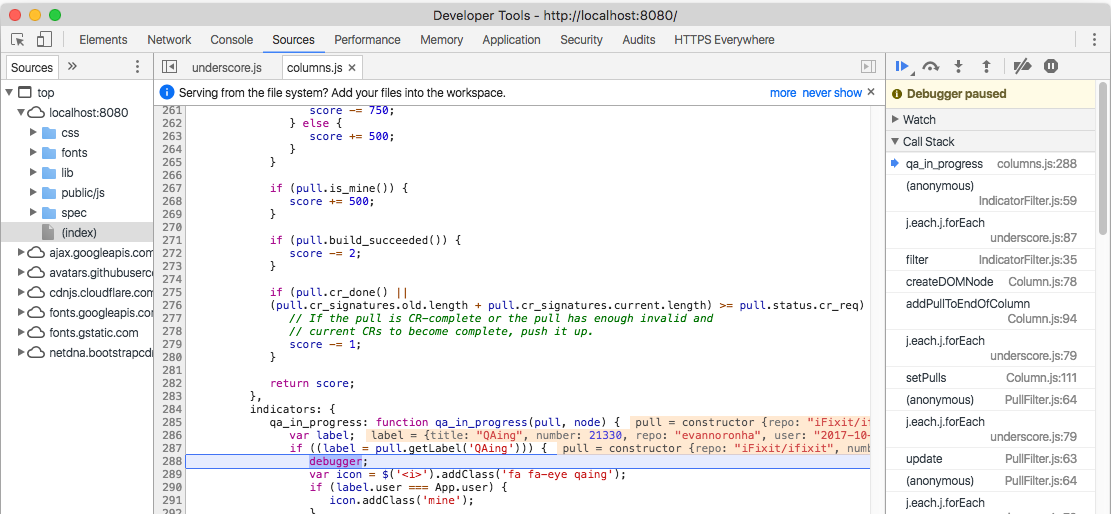
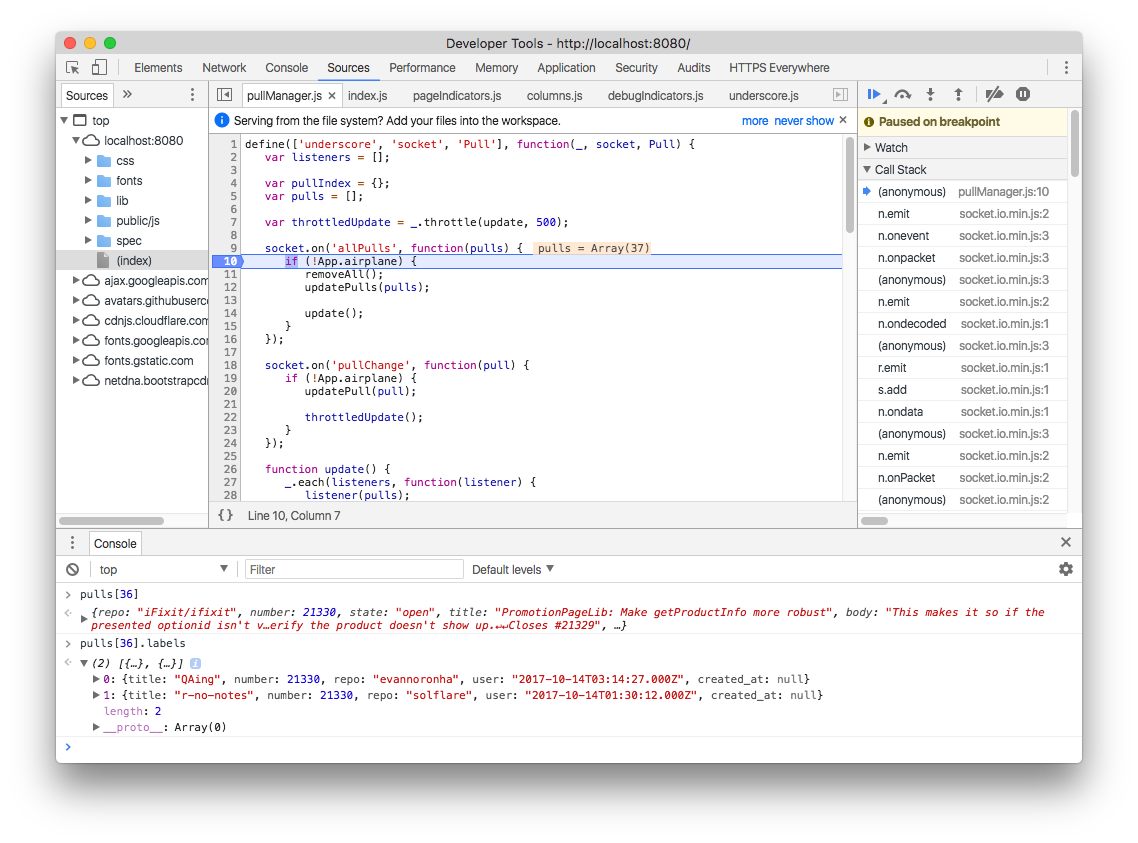
My first thought was that the front end display logic wasn’t correctly accessing the fields from the Pull Request object sent from the backend. In order to test this, I threw a debugger statement where the “eye” icon is added to the page. If you have Chrome DevTools open, it will stop execution at the line that you place the debugger statement. From there you can see the entire call stack so far on the right hand of the window, the location where the program stopped highlighted in blue, and the values of variables declared so far shown in orange/peach next to their uses in the source. You can also use the console to access variables that are currently in scope where the program is stopped. In the console I typed in label to see what the key/value pairs of the object looked like. From what I can see, the value for user is a Date string, the value for created_at is null, and the value for repo is the value that user should be set to. If we need to look further in the source for the bug, we could step through the program using the buttons above the Debugger paused text in the top right. However, at this point we know that the data is wrong, so we have to look elsewhere.
The first attempt didn’t find the bug, but that’s okay because we can add a new breakpoint earlier in the program and see if the problem exists when we get the data from the backend. The place where the frontend receives data from the backend exists in public/js/pullManager.js, so we can click on that file in the file browser on the left and click the line number (in this case line 10) to set a new breakpoint. Reload the page to trigger the breakpoint. Once the program reaches the breakpoint, you can use the console to find the Pull Request object that had the bad label object. From there we can look at the labels field. The console shows that both labels on the pull have the same issue that we saw before, which means that there must be a problem with how labels are being constructed on the backend. We’ll have to setup the NodeJS application to work with a debugger.
Next Step: Debugging the Backend
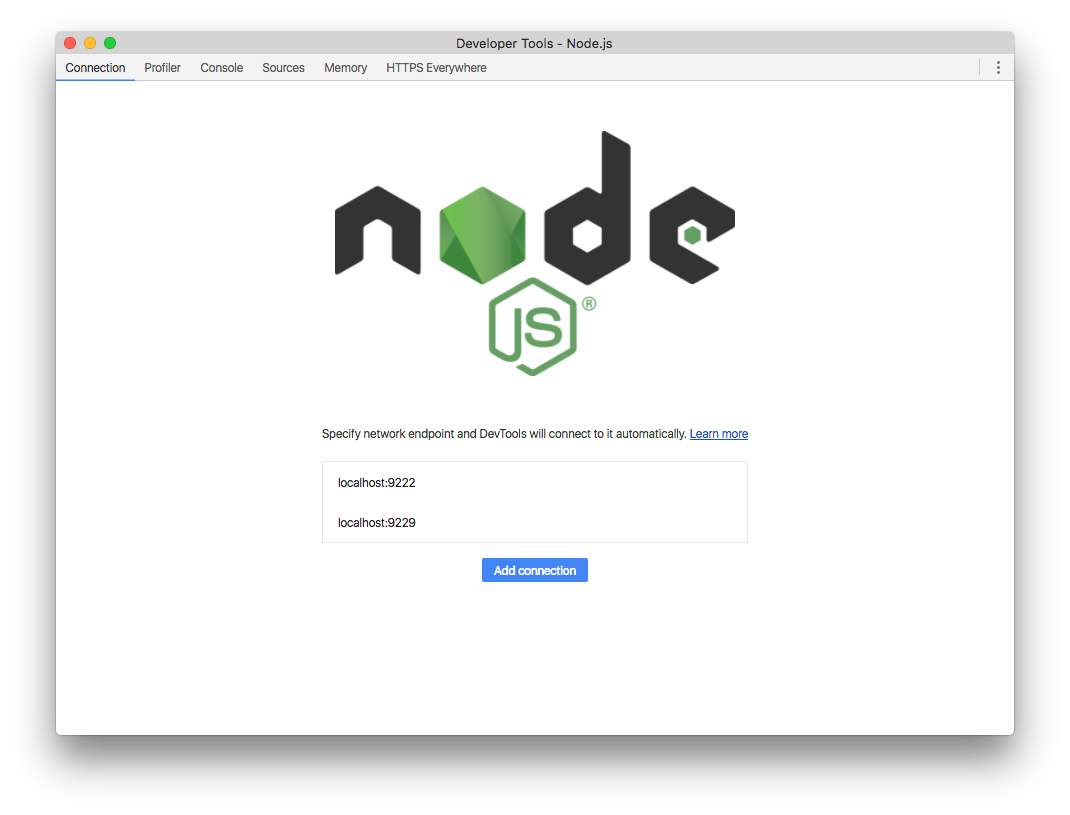
Setting up the backend for debugging can be a little intimidating, since the application may be running on a difference machine or in a container. For Pulldasher development, we use a docker-compose setup to run the NodeJS app and MySQL server in docker containers on our local machines. Instead of trying to set up a debugging solution within the Pulldasher container, we can use remote debugging by telling node to listen at a specific port for a debugger. You can do this by adding the --inspect flag to the node command that starts the application. By default this will listen on 127.0.0.1:9229 for a debugger, but you can supply a host and/or port. For example, node --inspect="192.168.1.2:3000" bin/pulldasher will listen on IP address 192.168.1.2 and port 3000. In order to get DevTools for NodeJS to find our containerized node process, we set the flag to --inspect="0.0.0.0:9229".
To start up Chrome DevTools for NodeJS, open Chrome and type chrome://inspect in the address bar. From there, click Open dedicated DevTools for Node. You should find yourself at a page with a list of network endpoints. If you set your --inspect flag to use a non-default address, make sure to add that network address. Make sure the address you specify is reachable from your computer. If you are running node from within a container and don’t want to map the port to your host, set the inspect value to 0.0.0.0:9229 and then specify the container’s IP address and port in the list of network addresses.
Now that that’s setup, we need to add a breakpoint somewhere in the backend. One easy target is to check out where the label object is created, models/label.js. The specific method Label.getFromDB takes an object called data that represents a row in the labels MySQL table and constructs a Label object from it. To get a better idea of how this function looks, throw a debugger statement in the first line of the function and start the application with the DevTools for NodeJS window open.
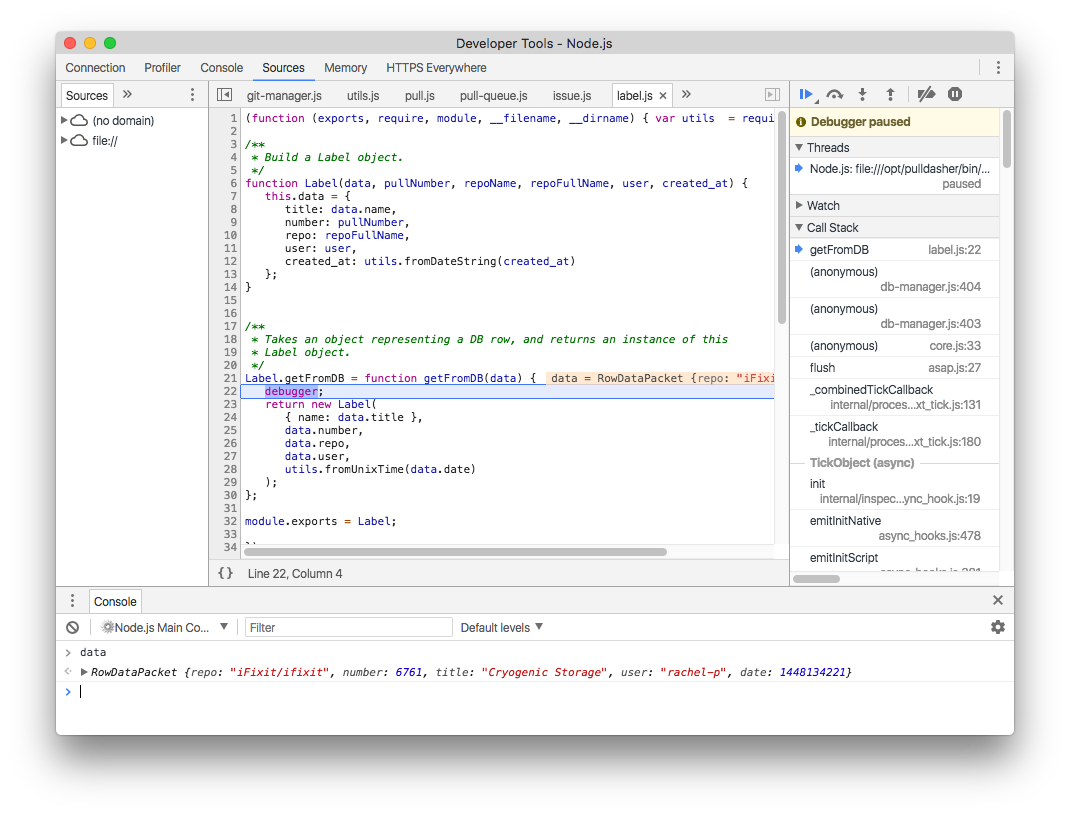
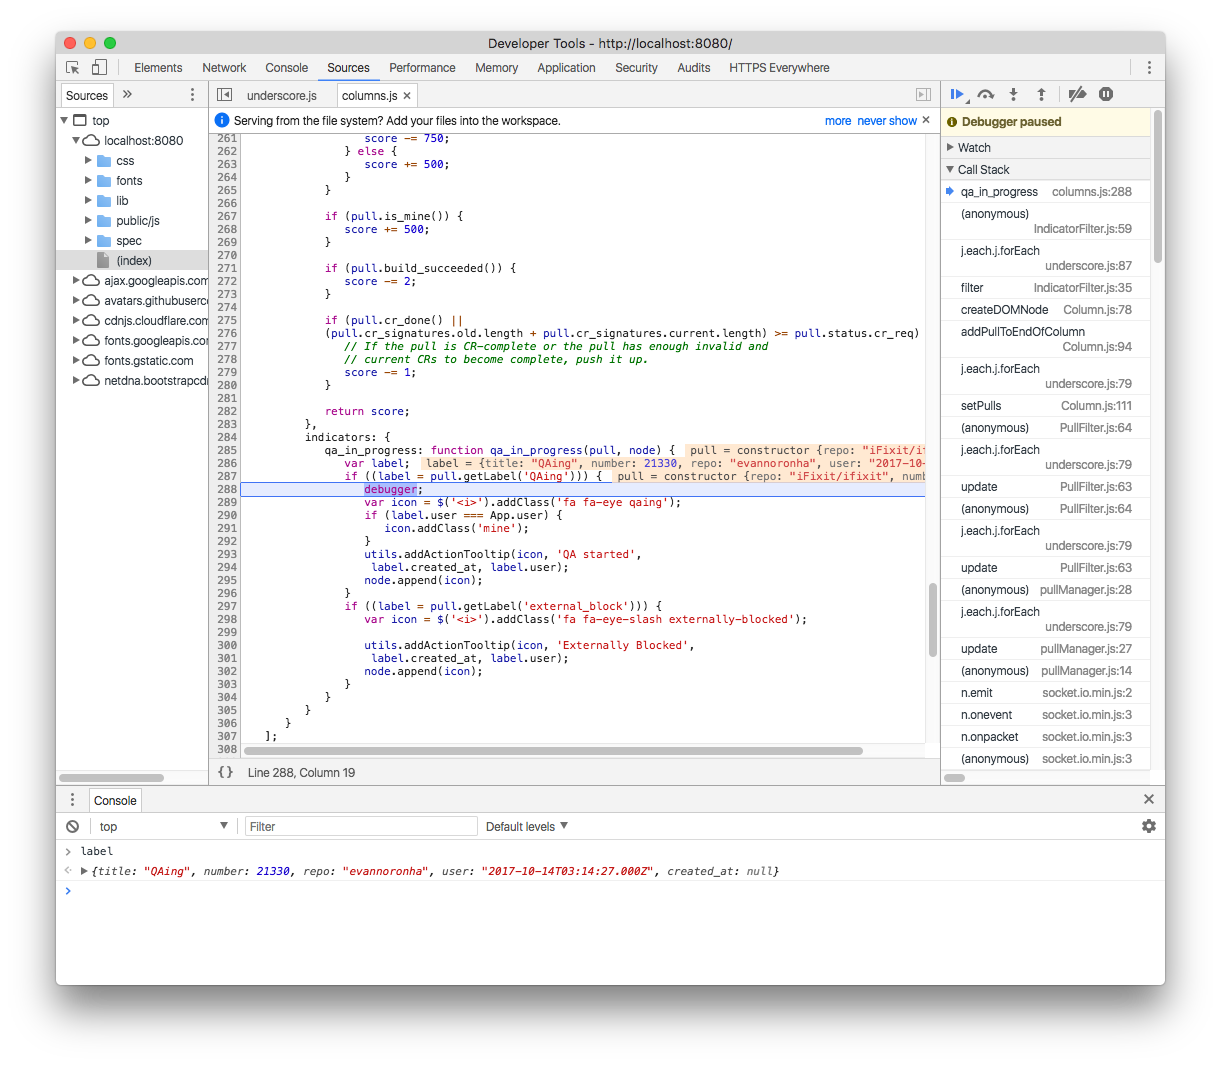
Once the program hits the breakpoint, the DevTools window should open the Sources tab and show the same contents from when we were debugging the frontend. Using the console, we can check the value of the data parameter. As shown in the picture on the left, the value of each key contains a correct type of value. The user key no longer has a Date value, and the repo key is no longer a GitHub username. Since the program is in a good state at this point, we should continue a little further to see if the Label constructor works correctly given this data from the database.
To step into the next function, click the icon in the top right that has an arrow pointing towards a dot. It’s in the row above the Debugger paused text and it’s tooltip says Step into next function call. Clicking that should advance the program into the Label constructor, which is defined on line 6 in the same file. If the debugger steps into a function that you’re not interested in, you can click on the button to the right of the “Step into” button and advance the program until the end of where that function is called. This is called “stepping out” of a function. You can also just click line 7 in the file to set a new breakpoint and press the play button in that same toolbar to advance to that new breakpoint. Once we’re inside the constructor, it’s a good idea to check the value of the parameters.
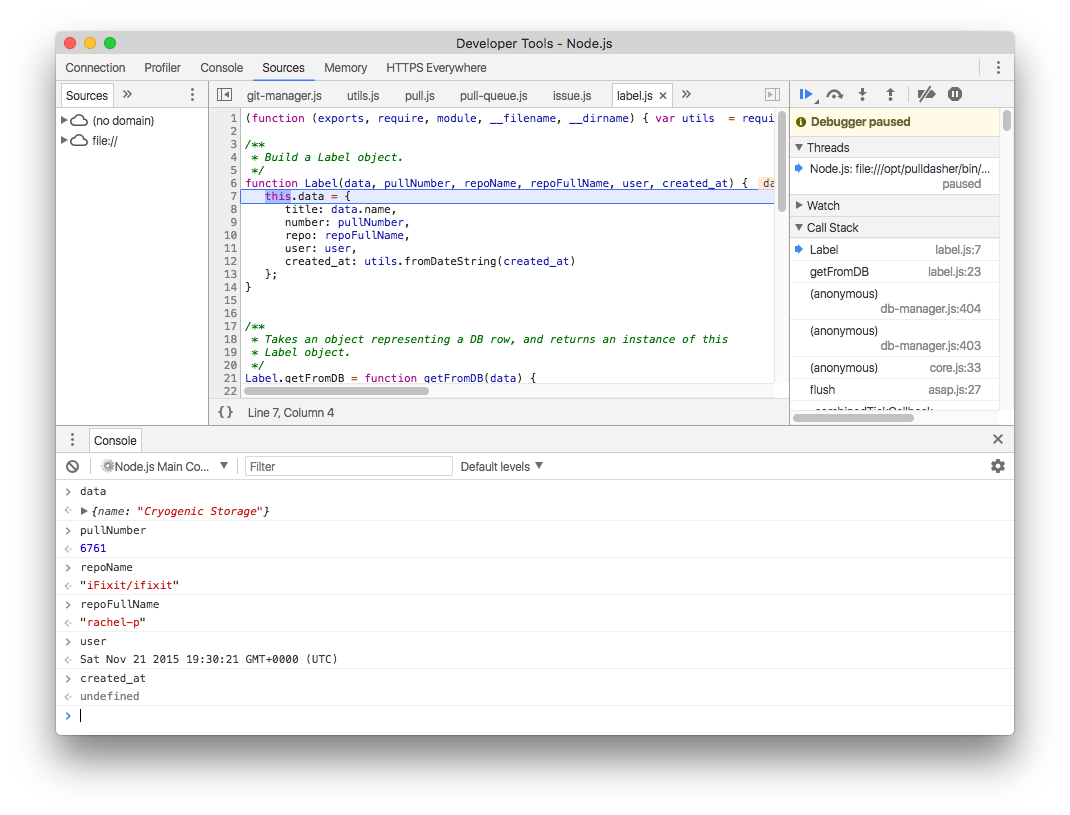
Using the console to inspect each variable, you can see that there’s both a repoName and repoFullName parameter, but the repoName is set to the GitHub repo and repoFullName is set to the username from Label.getFromDB. Uh-oh. Further investigation shows that repoName isn’t even used within the function. repoName must have been leftover from a previous refactor and wasn’t removed once the rest of the legacy code was removed. By removing repoName as a parameter, the function correctly builds a Label object, and the tooltip on the front end displays correctly.
With that change (and a few other ones listed here iFixit/pulldasher#118), we fixed the regression!
By using DevTools for NodeJS, we’ve been able to reason about the back end much quicker than when we only used debug logs and one-off console.logs. Getting remote debugging can take a little bit of overhead to get setup, but I really recommend it if you’re having trouble working through some NodeJS code.
If you’d like to check out how we set up remote debugging with docker-compose, check out this pull request iFixit/pulldasher#121.
If you’d like to learn more about Chrome DevTools, Google has a great demo https://developers.google.com/web/tools/chrome-devtools/javascript/.
Thanks for reading. If anything in this post was unclear, incorrect, or could be explained a little better, feel free to leave a comment or let me know on Twitter. If you liked this feel free to let me know too :)
</div
Recommend
About Joyk
Aggregate valuable and interesting links.
Joyk means Joy of geeK