

使用 pprof 和 Flame-Graph 调试 Golang 应用
source link: http://io.upyun.com/2018/01/21/debug-golang-application-with-pprof-and-flame-graph/?amp%3Butm_medium=referral
Go to the source link to view the article. You can view the picture content, updated content and better typesetting reading experience. If the link is broken, please click the button below to view the snapshot at that time.

最近用 Golang 实现了一个日志搜集上报程序(内部称 logger 项目),线上灰度测试过程发现 logger 占用 CPU 非常高(80% - 100%)。而此项目之前就在线上使用,用于消费 NSQ 任务, CPU 占用一直在 1%,最近的修改只是添加了基于磁盘队列的生产者消费者服务,生产者使用 go-gin 实现了一个 httpserver,接收数据后写入磁盘队列;消费者为单个 goroutine 循环 POST 数据。而 httpserver 压力不大(小于 100 QPS),不至于占用如此高的 CPU,大致 review 代码后未发现异常,借助 pprof 和 flame-graph 来分析定位问题。
pprof
pprof 我理解是 program profile(即程序性能剖析之意),Golang 提供的两个官方包
runtime/pprof,
net/http/pprof
能方便的采集程序运行的堆栈、goroutine、内存分配和占用、io 等信息的 .prof 文件,然后可以使用 go tool pprof 分析 .prof 文件。两个包的作用是一样的,只是使用方式的差异。
runtime/pprof
如果程序为非 httpserver 类型,使用此方式;在 main 函数中嵌入如下代码:
import "runtime/pprof"

var cpuprofile = flag.String("cpuprofile", "", "write cpu profile `file`")
var memprofile = flag.String("memprofile", "", "write memory profile to `file`")

func main() {
    flag.Parse()
    if *cpuprofile != "" {
        f, err := os.Create(*cpuprofile)
        if err != nil {
            log.Fatal("could not create CPU profile: ", err)
        }
        if err := pprof.StartCPUProfile(f); err != nil {
            log.Fatal("could not start CPU profile: ", err)
        }
        defer pprof.StopCPUProfile()
    }

    // ... rest of the program ...

    if *memprofile != "" {
        f, err := os.Create(*memprofile)
        if err != nil {
            log.Fatal("could not create memory profile: ", err)
        }
        runtime.GC() // get up-to-date statistics
        if err := pprof.WriteHeapProfile(f); err != nil {
            log.Fatal("could not write memory profile: ", err)
        }
        f.Close()
    }
}
./logger -cpuprofile cpu.prof -memprofile mem.prof
可以得到 cpu.prof 和 mem.prof 文件,使用 go tool pprof 分析。
go tool pprof logger cpu.prof
go tool pprof logger mem.prof
net/http/pprof
如果程序为 httpserver 类型, 则只需要导入该包:
import _ "net/http/pprof"
如果 httpserver 使用 go-gin 包,而不是使用默认的 http 包启动,则需要手动添加 /debug/pprof 对应的 handler,github 有封装好的模版:
import "github.com/DeanThompson/ginpprof"
...
router := gin.Default()
ginpprof.Wrap(router)
...
导入包重新编译程序后运行,在浏览器中访问 http://host:port/debug/pprof 可以看到如下信息,这里 host 和 port 是程序绑定的 host 和 port,例如我自己的 logger 程序,访问如下地址:
http://127.0.0.1:4500/debug/pprof/
/debug/pprof/

profiles:
0	block
62	goroutine
427	heap
0	mutex
12	threadcreate

full goroutine stack dump
点击对应的 profile 可以查看具体信息,通过浏览器查看的数据不能直观反映程序性能问题,go tool pprof 命令行工具提供了丰富的工具集:
查看 heap 信息
go tool pprof http://127.0.0.1:4500/debug/pprof/heap
查看 30s 的 CPU 采样信息
go tool pprof http://127.0.0.1:4500/debug/pprof/profile
其他功能使用参见 官方 net/http/pprof 库
pprof CPU 分析
采集 profile 数据之后,可以分析 CPU 热点代码。 执行下面命令:
go tool pprof http://127.0.0.1:4500/debug/pprof/profile
会采集 30s 的 profile 数据,之后进入终端交互模式,输入 top 指令。
~ # go tool pprof http://127.0.0.1:4500/debug/pprof/profile
Fetching profile over HTTP from http://127.0.0.1:4500/debug/pprof/profile
Saved profile in /home/vagrant/pprof/pprof.logger.samples.cpu.012.pb.gz
File: logger
Type: cpu
Time: Jan 19, 2018 at 2:01pm (CST)
Duration: 30s, Total samples = 390ms ( 1.30%)
Entering interactive mode (type "help" for commands, "o" for options)
(pprof) top
Showing nodes accounting for 360ms, 92.31% of 390ms total
Showing top 10 nodes out of 74
      flat  flat%   sum%        cum   cum%
     120ms 30.77% 30.77%      180ms 46.15%  compress/flate.(*compressor).findMatch /usr/local/go/src/compress/flate/deflate.go
     100ms 25.64% 56.41%      310ms 79.49%  compress/flate.(*compressor).deflate /usr/local/go/src/compress/flate/deflate.go
      60ms 15.38% 71.79%       60ms 15.38%  compress/flate.matchLen /usr/local/go/src/compress/flate/deflate.go
      20ms  5.13% 76.92%       20ms  5.13%  compress/flate.(*huffmanBitWriter).indexTokens /usr/local/go/src/compress/flate/huffman_bit_writer.go
      10ms  2.56% 79.49%       10ms  2.56%  compress/flate.(*huffmanBitWriter).writeTokens /usr/local/go/src/compress/flate/huffman_bit_writer.go
      10ms  2.56% 82.05%       10ms  2.56%  hash/adler32.update /usr/local/go/src/hash/adler32/adler32.go
      10ms  2.56% 84.62%       10ms  2.56%  runtime.futex /usr/local/go/src/runtime/sys_linux_amd64.s
      10ms  2.56% 87.18%       10ms  2.56%  runtime.memclrNoHeapPointers /usr/local/go/src/runtime/memclr_amd64.s
      10ms  2.56% 89.74%       10ms  2.56%  runtime.pcvalue /usr/local/go/src/runtime/symtab.go
      10ms  2.56% 92.31%       10ms  2.56%  runtime.runqput /usr/local/go/src/runtime/runtime2.go
(pprof)
从统计可以 top5 操作全是数据压缩操作, logger 程序本身开启了压缩等级为 9 的 gzip 压缩,如果希望减少压缩 CPU 占用,可以调整压缩等级。
pprof mem 分析
同时 pprof 也支持内存相关数据分析
--inuse_space 分析常驻内存
go tool pprof -alloc_space http://127.0.0.1:4500/debug/pprof/heap
~ # go tool pprof -alloc_space http://127.0.0.1:4500/debug/pprof/heap
Fetching profile over HTTP from http://127.0.0.1:4500/debug/pprof/heap
Saved profile in /home/vagrant/pprof/pprof.logger.alloc_objects.alloc_space.inuse_objects.inuse_space.006.pb.gz
File: logger
Type: alloc_space
Time: Jan 19, 2018 at 2:21pm (CST)
Entering interactive mode (type "help" for commands, "o" for options)
(pprof) top
Showing nodes accounting for 47204.90MB, 99.16% of 47606.01MB total
Dropped 230 nodes (cum <= 238.03MB)
Showing top 10 nodes out of 39
      flat  flat%   sum%        cum   cum%
28290.79MB 59.43% 59.43% 28290.79MB 59.43%  bytes.makeSlice /usr/local/go/src/bytes/buffer.go
 8706.78MB 18.29% 77.72% 10082.12MB 21.18%  compress/flate.NewWriter /usr/local/go/src/compress/flate/deflate.go
 8559.74MB 17.98% 95.70%  8559.74MB 17.98%  github.com/nsqio/go-diskqueue.(*diskQueue).readOne /home/vagrant/go/src/github.com/nsqio/go-diskqueue/diskqueue.go
 1343.78MB  2.82% 98.52%  1343.78MB  2.82%  compress/flate.(*compressor).init /usr/local/go/src/compress/flate/deflate.go
  298.81MB  0.63% 99.15%   298.81MB  0.63%  github.com/nsqio/go-nsq.ReadResponse /home/vagrant/go/src/github.com/nsqio/go-nsq/protocol.go
       2MB 0.0042% 99.15% 12097.28MB 25.41%  main.(*PostPublisher).Publish /home/vagrant/logger/src/handler.go
    1.50MB 0.0032% 99.15% 26358.53MB 55.37%  io/ioutil.readAll /usr/local/go/src/io/ioutil/ioutil.go
       1MB 0.0021% 99.16% 26378.74MB 55.41%  github.com/gin-gonic/gin.LoggerWithWriter.func1 /home/vagrant/go/src/github.com/gin-gonic/gin/logger.go
    0.50MB 0.0011% 99.16% 26434.42MB 55.53%  net/http.(*conn).serve /usr/local/go/src/net/http/server.go
         0     0% 99.16% 26357.03MB 55.36%  bytes.(*Buffer).ReadFrom /usr/local/go/src/bytes/buffer.go
(pprof)
--alloc_objects 分析临时内存
go tool pprof -inuse_space http://127.0.0.1:4500/debug/pprof/heap
~ # go tool pprof -inuse_space http://127.0.0.1:4500/debug/pprof/heap
Fetching profile over HTTP from http://127.0.0.1:4500/debug/pprof/heap
Saved profile in /home/vagrant/pprof/pprof.logger.alloc_objects.alloc_space.inuse_objects.inuse_space.007.pb.gz
File: logger
Type: inuse_space
Time: Jan 19, 2018 at 2:24pm (CST)
Entering interactive mode (type "help" for commands, "o" for options)
(pprof) top
Showing nodes accounting for 20441.23kB, 100% of 20441.23kB total
Showing top 10 nodes out of 35
      flat  flat%   sum%        cum   cum%
18071.75kB 88.41% 88.41% 18071.75kB 88.41%  bytes.makeSlice /usr/local/go/src/bytes/buffer.go
  815.27kB  3.99% 92.40%   815.27kB  3.99%  github.com/nsqio/go-diskqueue.(*diskQueue).readOne /home/vagrant/go/src/github.com/nsqio/go-diskqueue/diskqueue.go
  528.17kB  2.58% 94.98%   528.17kB  2.58%  regexp.(*bitState).reset /usr/local/go/src/regexp/backtrack.go
     514kB  2.51% 97.50%      514kB  2.51%  net/http.newBufioWriterSize /usr/local/go/src/bufio/bufio.go
  512.05kB  2.50%   100%   512.05kB  2.50%  net/http.(*persistConn).roundTrip /usr/local/go/src/net/http/transport.go
         0     0%   100%   528.17kB  2.58%  _/home/vagrant/logger/src/parser.ParserLogForMarco /home/vagrant/logger/src/parser/parser.go
         0     0%   100%   528.17kB  2.58%  bytes.(*Buffer).ReadFrom /usr/local/go/src/bytes/buffer.go
         0     0%   100% 17543.58kB 85.82%  bytes.(*Buffer).Write /usr/local/go/src/bytes/buffer.go
         0     0%   100% 17543.58kB 85.82%  bytes.(*Buffer).grow /usr/local/go/src/bytes/buffer.go
         0     0%   100%   528.17kB  2.58%  github.com/gin-gonic/gin.(*Context).Next /home/vagrant/go/src/github.com/gin-gonic/gin/context.go
(pprof)
通过常驻内存和临时内存分配 top 值,可以查看当前程序的内存占用情况和热点内存使用的代码,结合代码分析热点代码是否存在 bug、是否有优化的空间。
go-torch
通过上面的 go tool pprof 工具和 top 指令,我们能定位出程序的热点代码,但缺乏对程序运行情况的整体感知,能不能有类似火焰图的效果让我们对整个堆栈统计信息有个一目了然的效果呢?这里要感谢 uber 开源的工具 go-torch,能让我们将 profile 信息转换成火焰图,具体安装和使用过程见项目的介绍。
安装好 go-torch 后,运行
go-torch -u http://127.0.0.1:4500
生成 CPU 火焰图
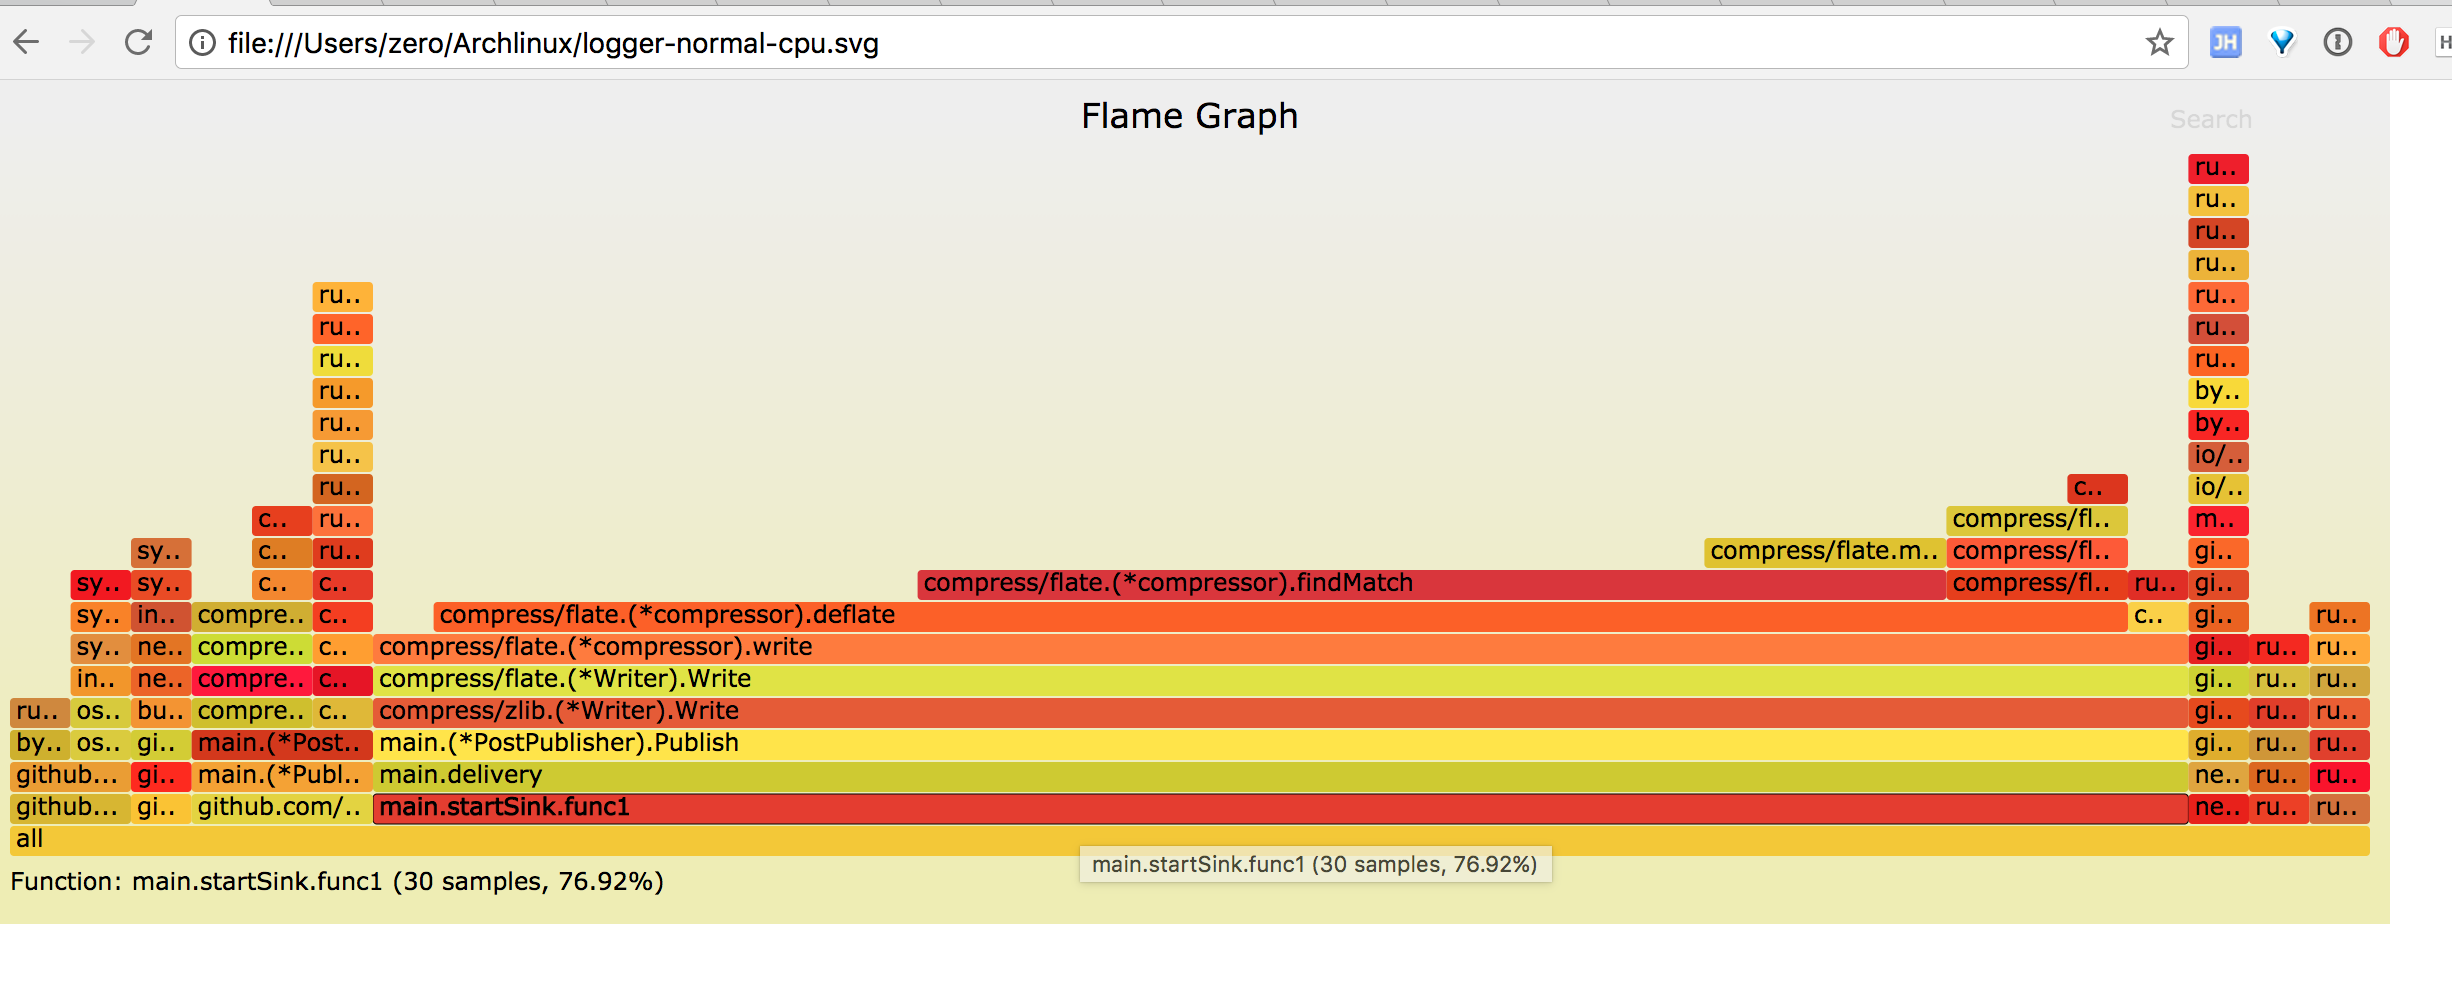
从图中能一眼看到 publish 函数中的压缩操作占了 70% 左右的 CPU。
而 gin httpserver 只占用了 2% 左右的 CPU, 和我们使用 go tool pprof 的 top 命令分析的结果一致。
默认情况下 go-torch 采集的是 CPU 的 profile, 这里介绍下 mem 火焰图的采集。
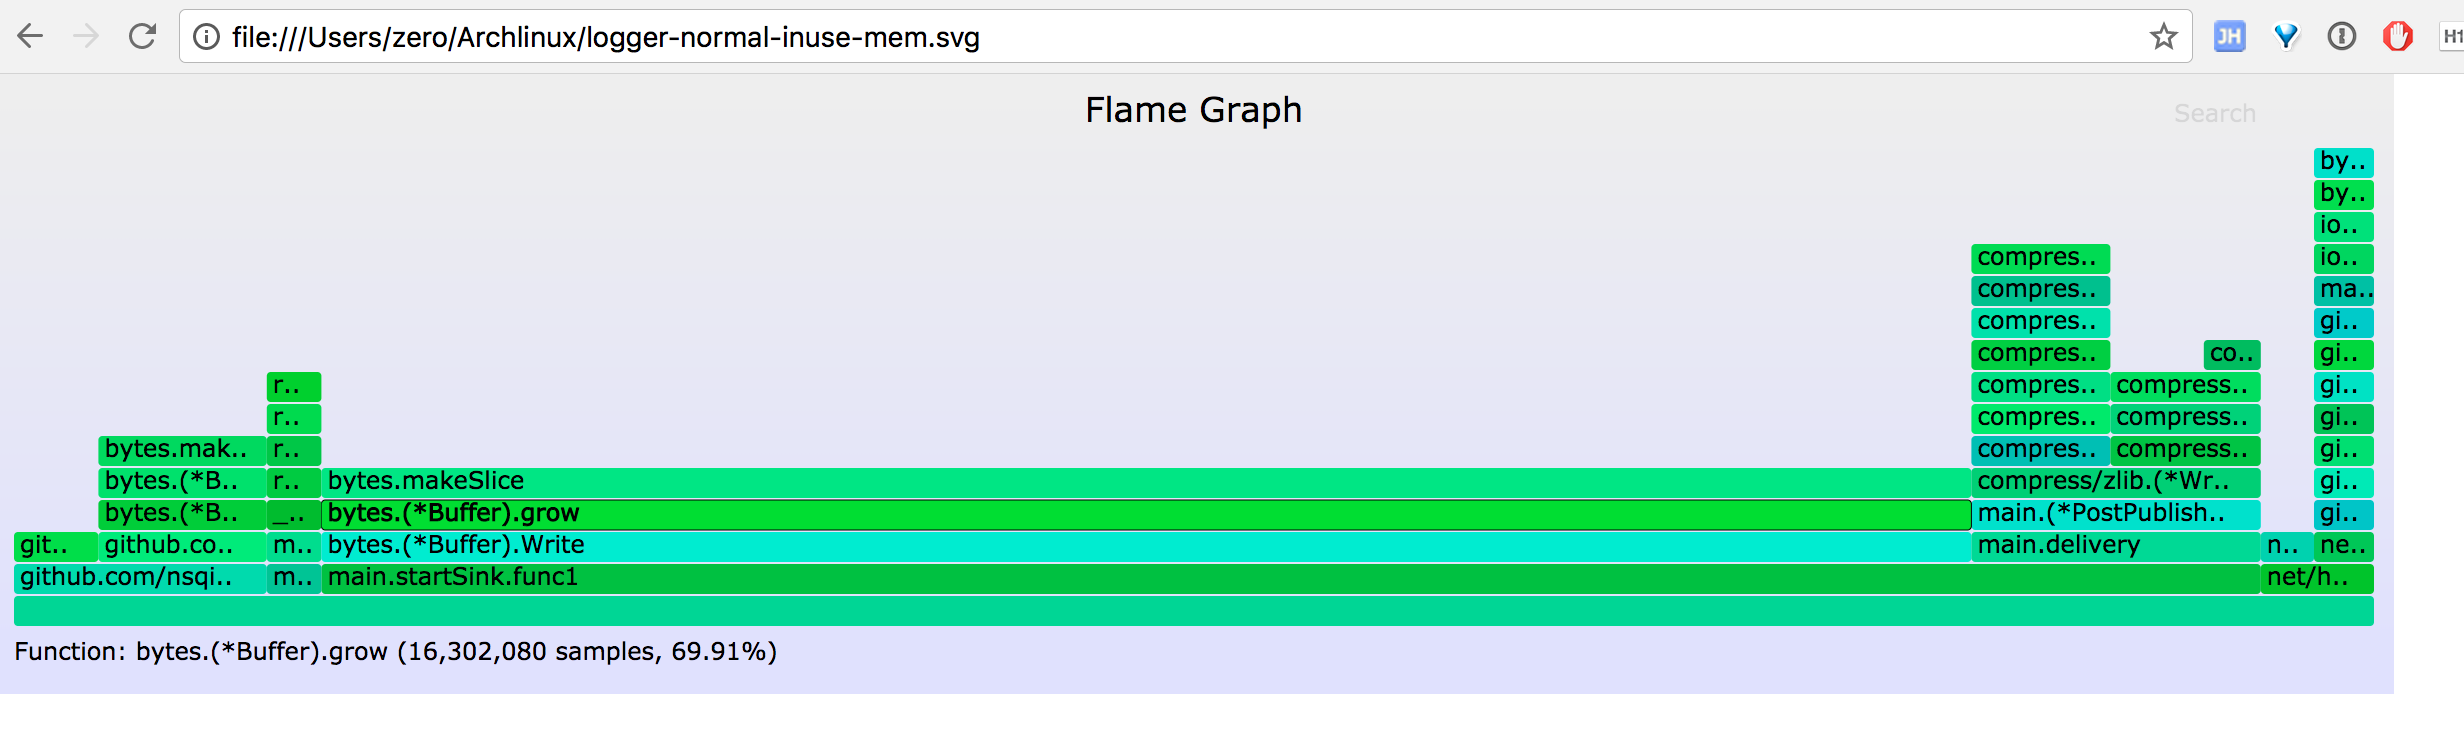
inuse_space 火焰图
go-torch -inuse_space http://127.0.0.1:4500/debug/pprof/heap --colors=mem
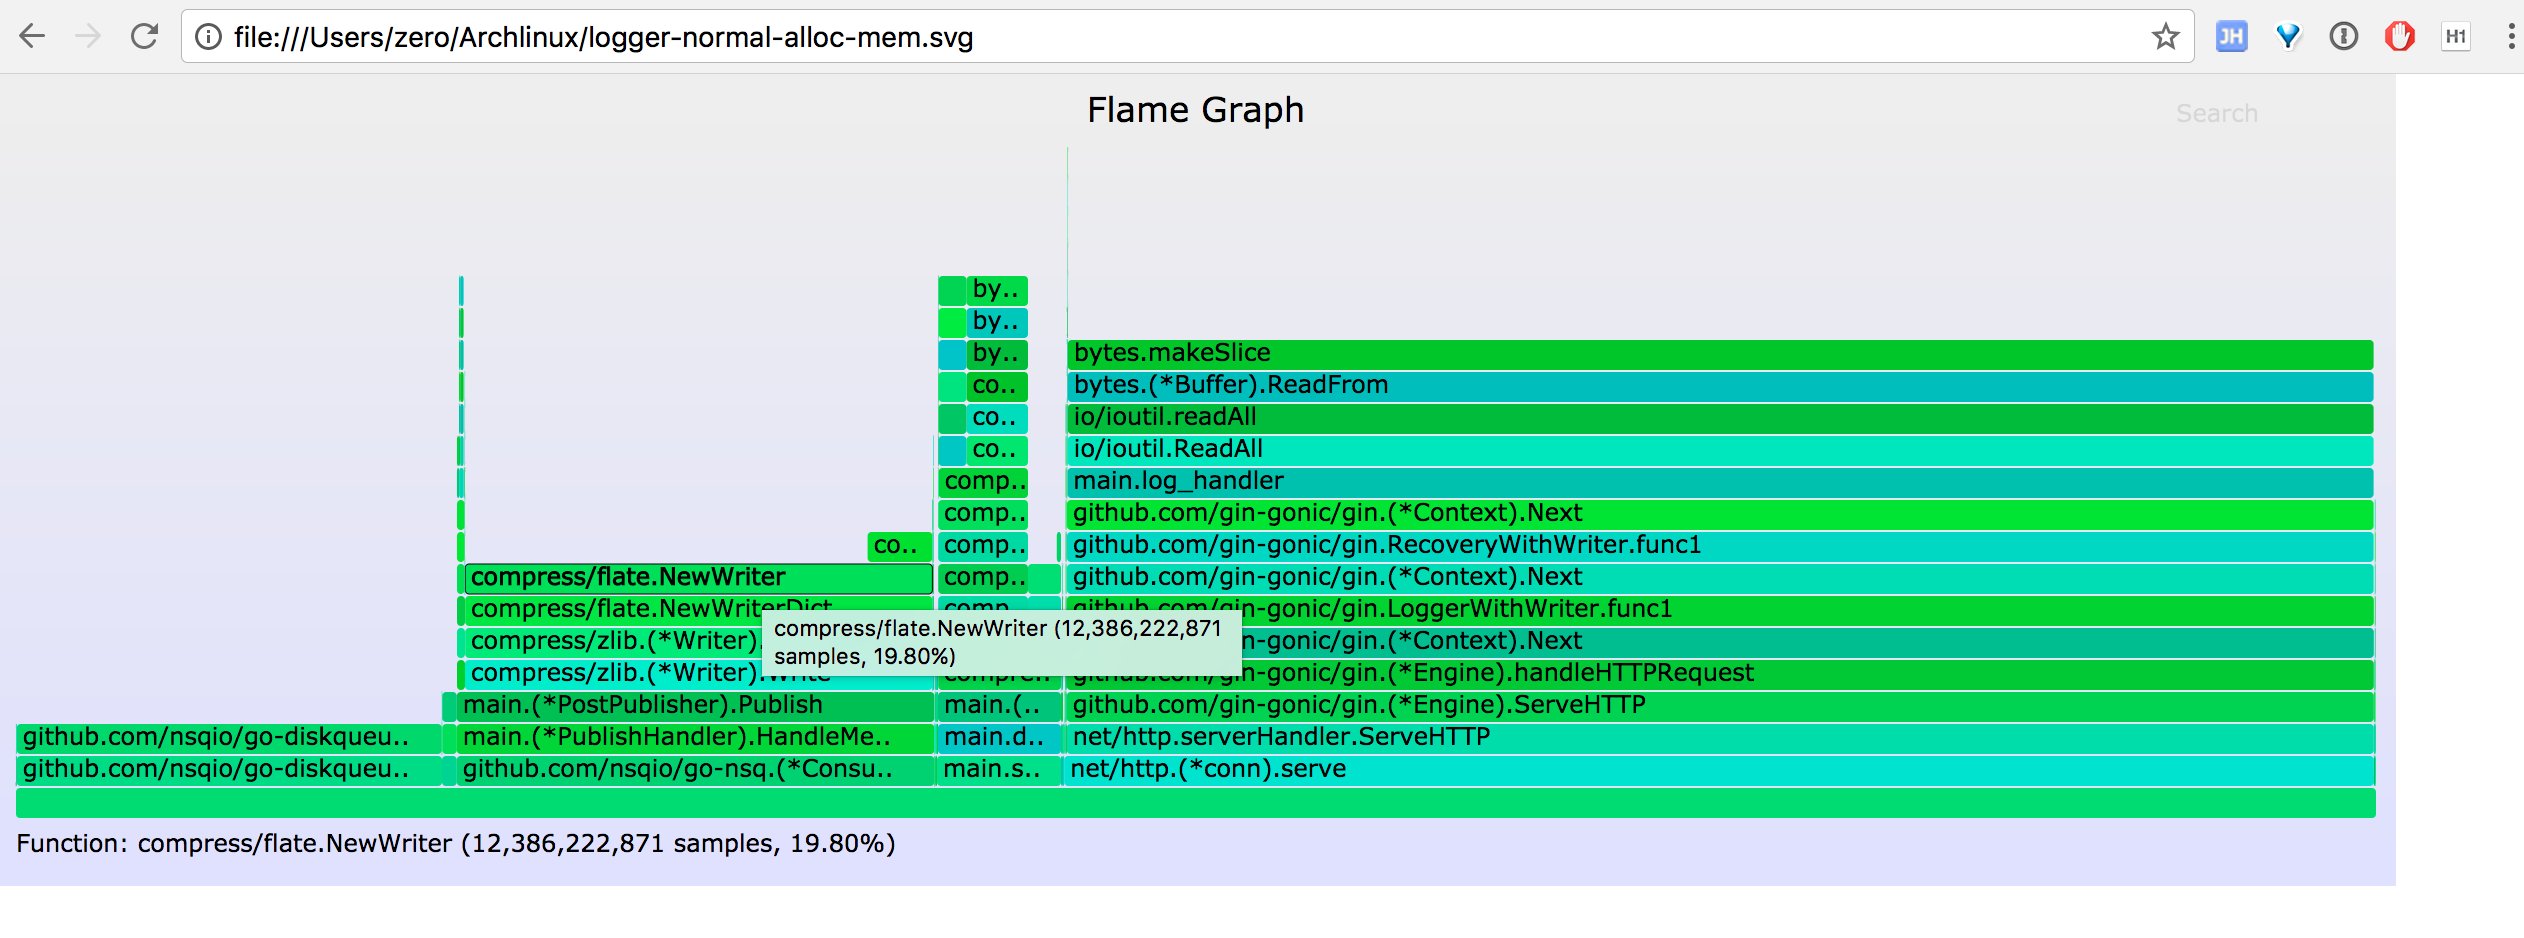
alloc_space 火焰图
go-torch -alloc_space http://127.0.0.1:4500/debug/pprof/heap --colors=mem
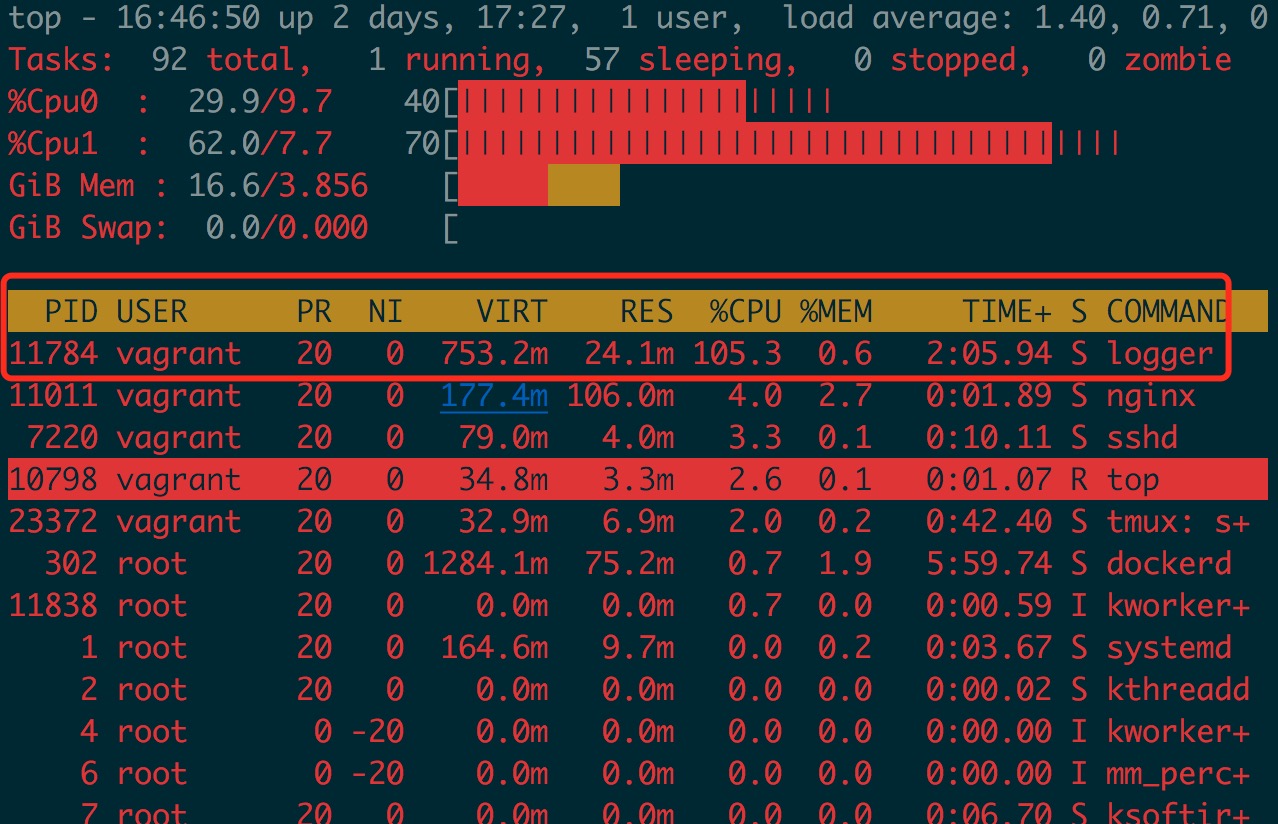
logger 100% CPU 分析
前面介绍了 go tool pprof 和火焰图的使用方法,这里使用火焰图复现 logger 100% CPU 问题。
先看现象, 用 wrk 压测 logger
wrk -t1 -c100 -d30 --script=post.lua 'http://127.0.0.1:4500/marco/log'
查看 CPU 占用情况
采集 30s 的 CPU profile 火焰图
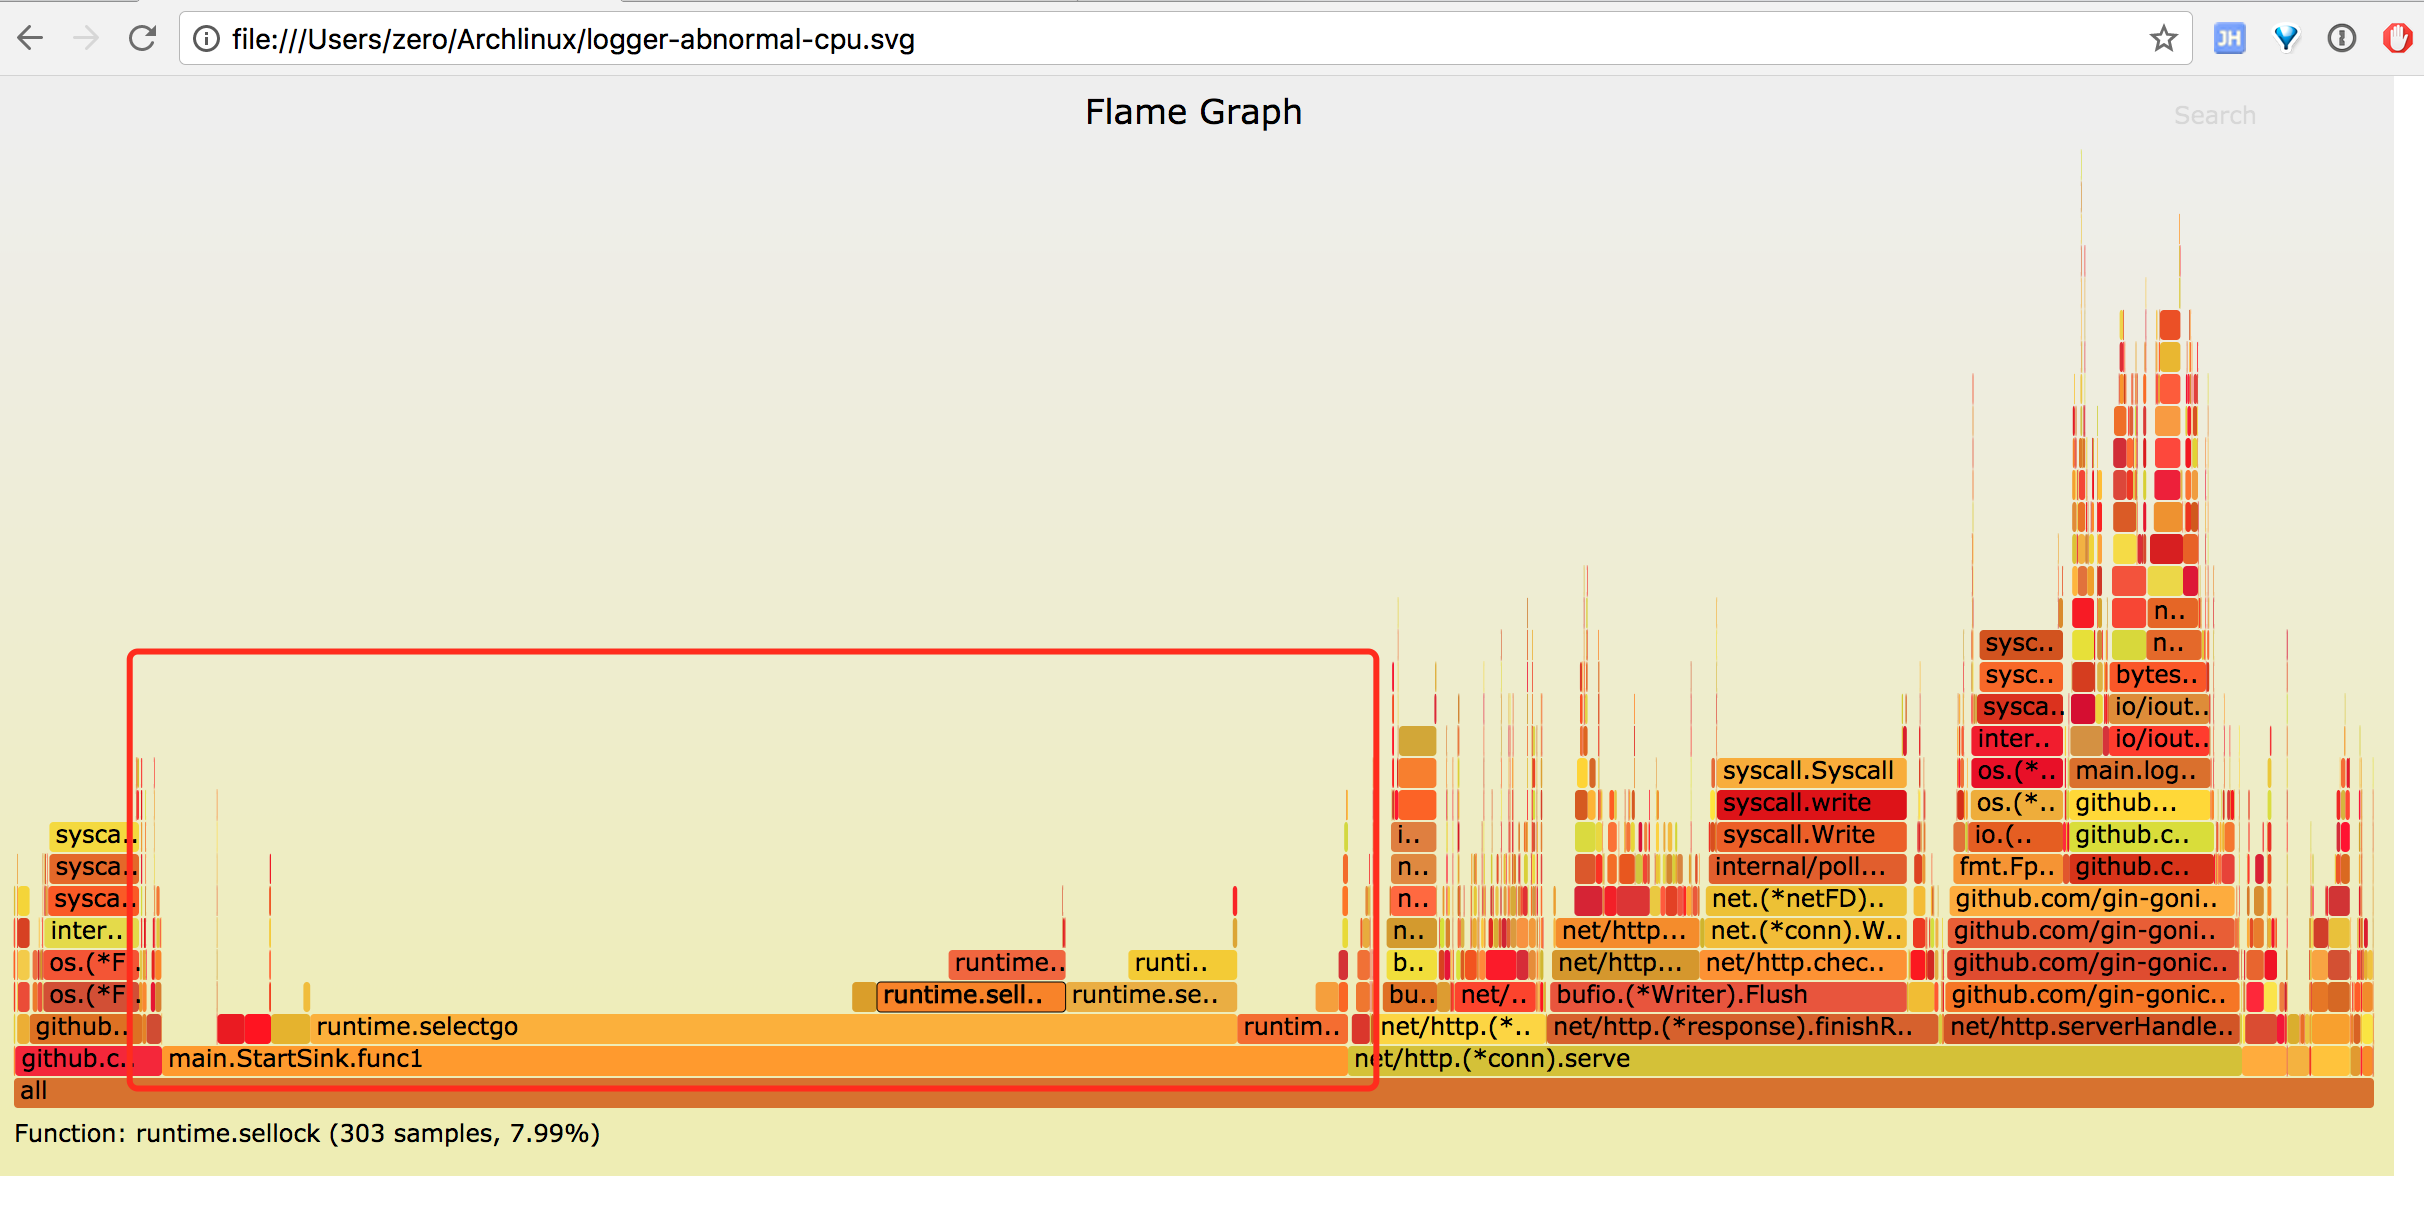
图中红色标记部分 startSink 函数中 runtime.selectgo 消耗了大量 CPU, 而 runtime.selectgo 上面只有 runtime.sellock 和 runtime.selunlock 两个操作,即大量 CPU 耗费在 select 操作上,火焰图呈秃顶状态,即瓶颈所在。
查看 startSink 实现
    for {
        if exit == true {
            return
        }

        if moveforward {
            fakeRead = readChan
        } else {
            fakeRead = nil
        }

        select {
        case read := <-fakeRead:
            count++
            buf.Write(read)
        case <-done:
            DiskQueue.Close()
            exit = true
        default:
            //pass
        }

        if count == GlobalConf.CntBatch || exit == true {
            hostPoolResponse := pool.Get()
            addr := hostPoolResponse.Host()
            err := handler.Publish(fmt.Sprintf("%s%s", addr, SinkConf.Uri), buf.Bytes())
            hostPoolResponse.Mark(err)

            if err != nil {
                Log.Error("%s", err.Error())
                moveforward = false
                time.Sleep(1 * time.Second)
                continue
            } else {
                moveforward = true
            }

            buf.Reset()
            count = 0
        }
    }
本希望通过 moveforward 来控制 fakeRead 是否取值,而如果 fakeRead 为 nil 时, 整个 select 会一直阻塞,所以加上了 default 操作,让 select 变成非阻塞,但因为一直没有读取内容,count 没有增加而不会触发 sleep 操作。最终导致非阻塞的 select 一直空转循环,类似一个空 while 循环,占用了大量 CPU。
改用其他方法实现这部分逻辑,这里不再贴出来了,重在分享发现问题的过程,改进后的火焰图在前面已给出。
Golang 应用通常只要能编译通过,很少有运行时问题;而当应用遇到高CPU 、高内存占用或者作为 http 服务端响应时间长,QPS 上不去等,且不能 code review 解决时,可以尝试使用pprof 和 Flame-Graph 来分析定位问题,有奇效。当然 Golang 程序的调试及调优还有很多方法,比如直接结合go test 和 benchmark通过测用例分析热点代码、使用 go pprof分析汇编代码等。
Recommend
-
67
前言 如果要说在 golang 开发过程进行性能调优,pprof 一定是一个大杀器般的工具。但在网上找到的教程都偏向简略,难寻真的能应用于实战的教程。这也无可厚非,毕竟 pprof 是当程序占用资源异常时才需要启用的工具,而我相信大家...
-
21
这是一篇给网友的文章,正好最近在研究分析golang的性能,我觉得是时候来一个了断了。 Golang 自带 的一款开箱即用的 性能监控 和 分析 工具。 (全篇看的过程中...
-
17
什么是 Profiling? Profiling 这个词比较难翻译,一般译成画像。比如在案件侦破的时候会对嫌疑人做画像,从犯罪现场的种种证据,找到嫌疑人的各种特征,方便对嫌疑人进行排查;还有就是互联网公司会对用户信息做画像,通过了解用户各个属性(年龄、性...
-
9
Java Package Flame Graph 30 Jun 2017 CPU flame graphs visualize running code based on its flow or stack trace ancestry, showing which functions called which other functions and so on. But with Java, there's another way to vi...
-
8
CPU profiles, which can be visualized as a CPU flame graph, can solve a wide range of CPU usage issues. Off-CPU analysis, which can be visualized as
-
11
Linux perf_events Off-CPU Time Flame Graph 26 Feb 2015 I've been asked how to do these several times, so here's a quick blog post. CPU Flame Graph...
-
7
Golang Profiling: 关于 pprof Golang 应用程序性能分析工具 pprof… 6 分钟阅读 ...
-
6
深入剖析 Golang Pprof 标签 h1z3y3 · 8天之前 · 173 次点击 · 预计阅读时间 5 分钟 · 大约8小时之前 开始浏...
-
7
不知道你有没有遇到这种情况,Go服务总是是不是的响应非常慢排查发现所有的依赖还都挺快,感觉是Go服务自身慢又不知道怎么慢在哪里;或者说请求甚至完全没响应,Go服务明明在正常运行,请求去哪儿了呢?或者说Go服务内存占用总是居高不下,内存都浪费在哪呢?这些...
-
3
0x00 前言 0x01 DEBUG 汇总 安装 yum install graphviz go tool pprof main http://localhost:8000/debug/pprof/heap 或者 goroutine,进入命...
About Joyk
Aggregate valuable and interesting links.
Joyk means Joy of geeK