
125

GitHub - TalkingData/inmap: Map visualization
source link: https://github.com/TalkingData/inmap
Go to the source link to view the article. You can view the picture content, updated content and better typesetting reading experience. If the link is broken, please click the button below to view the snapshot at that time.

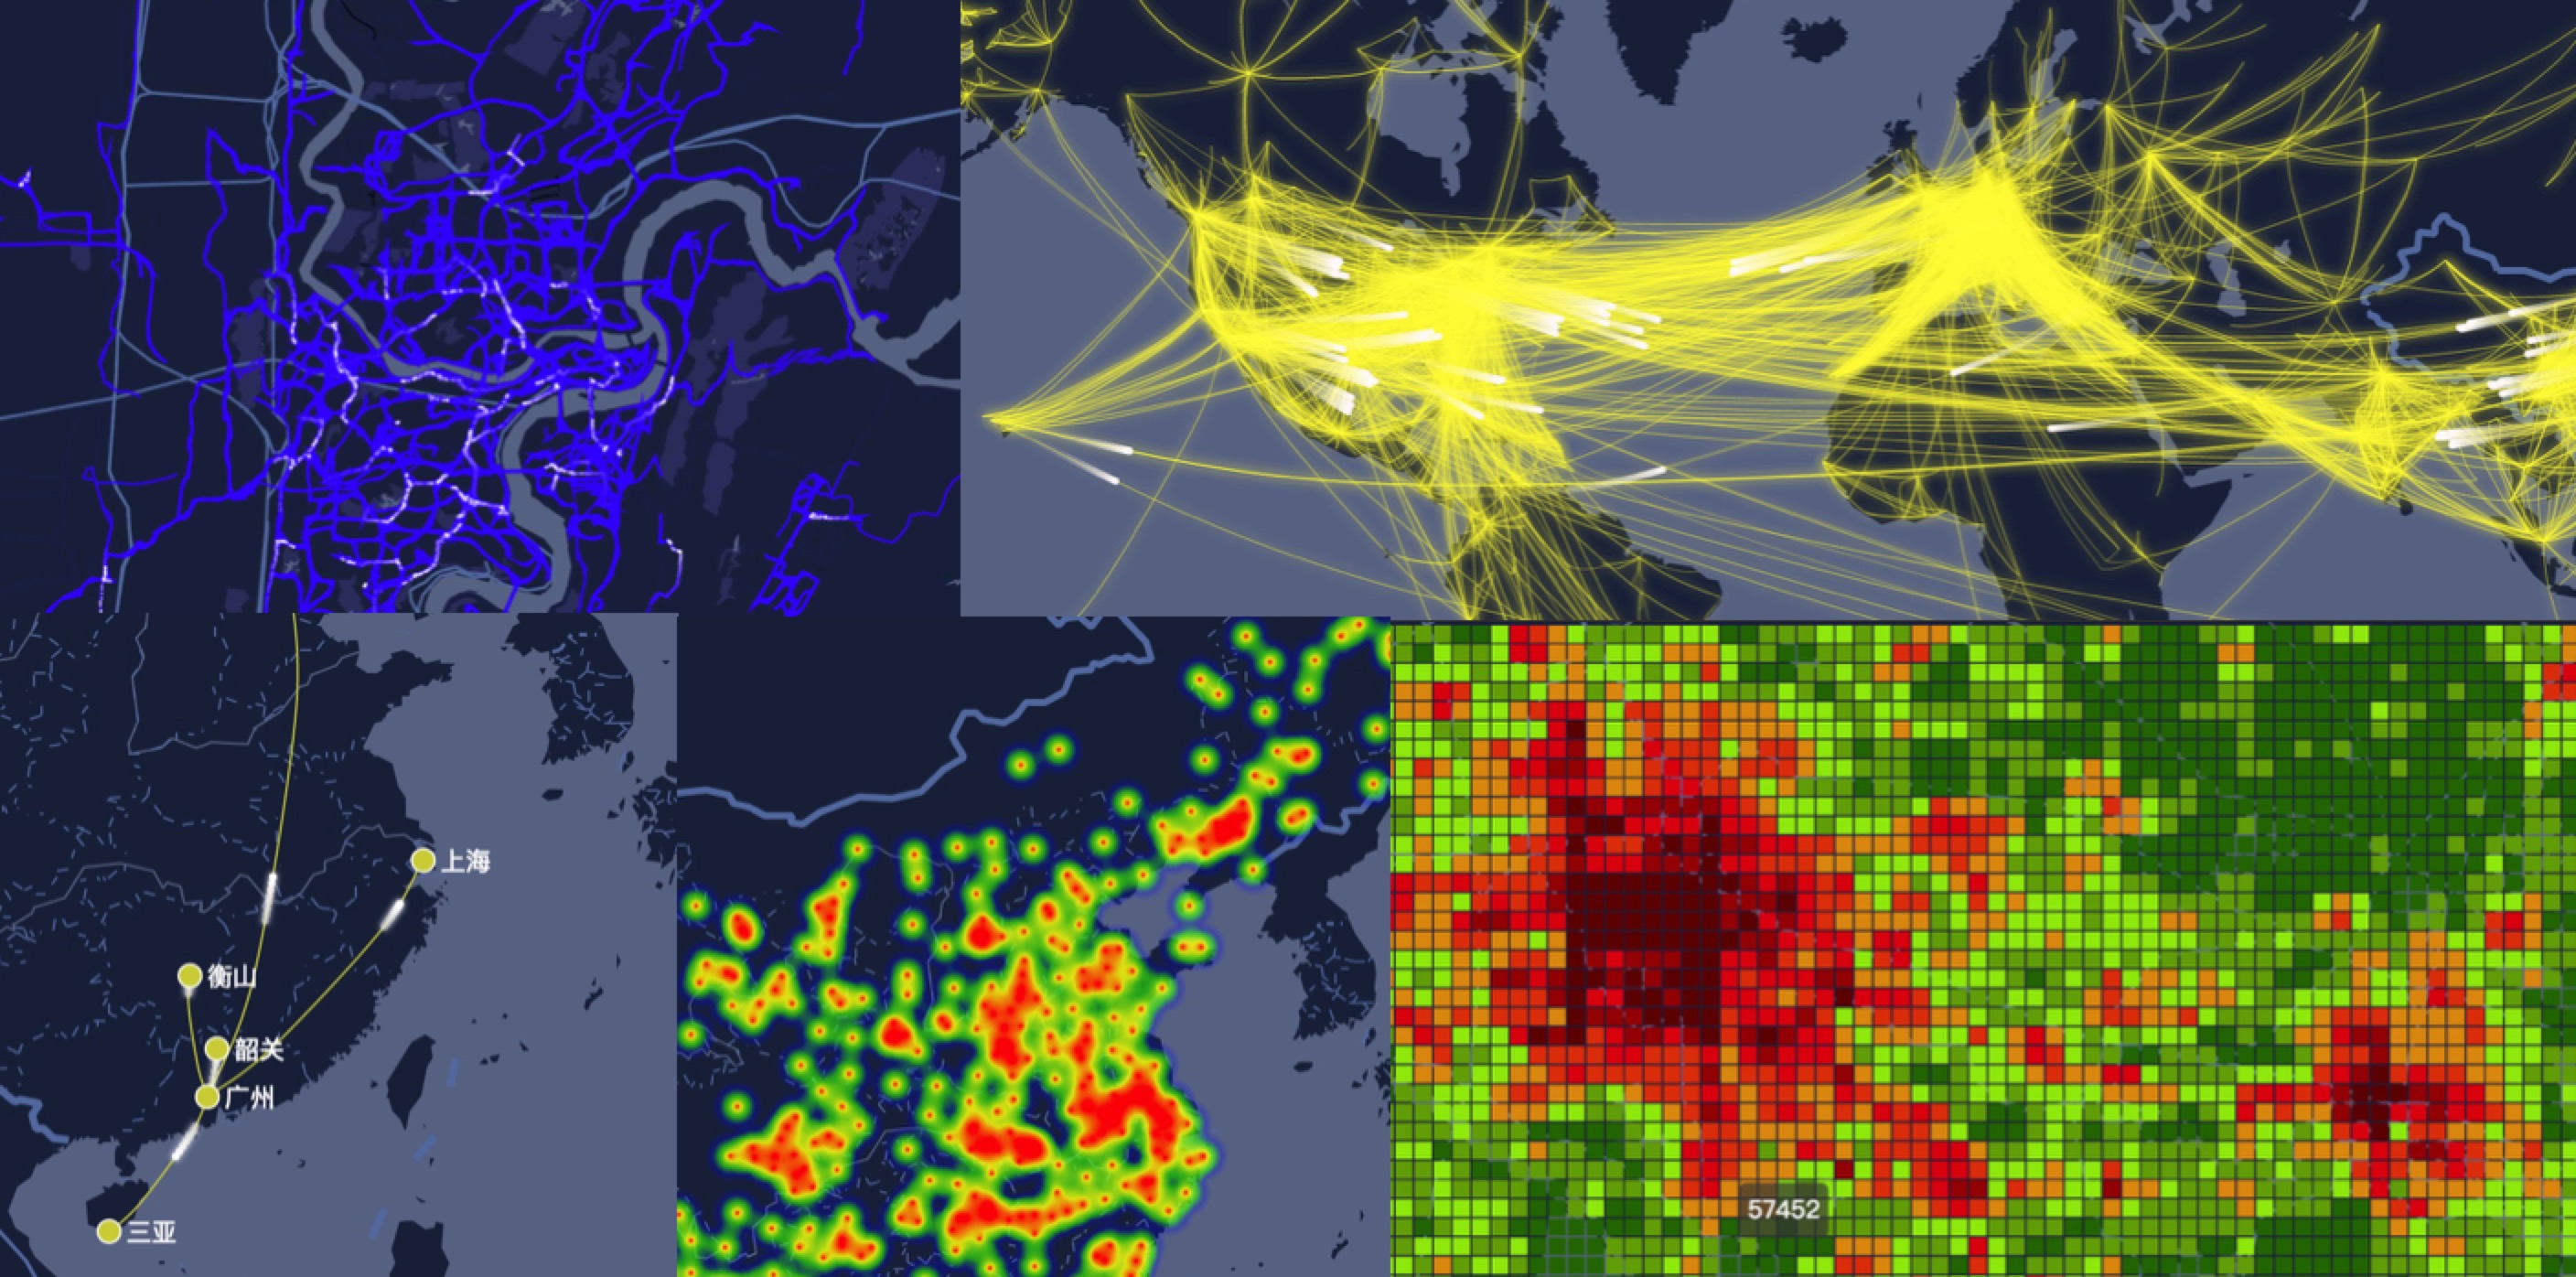
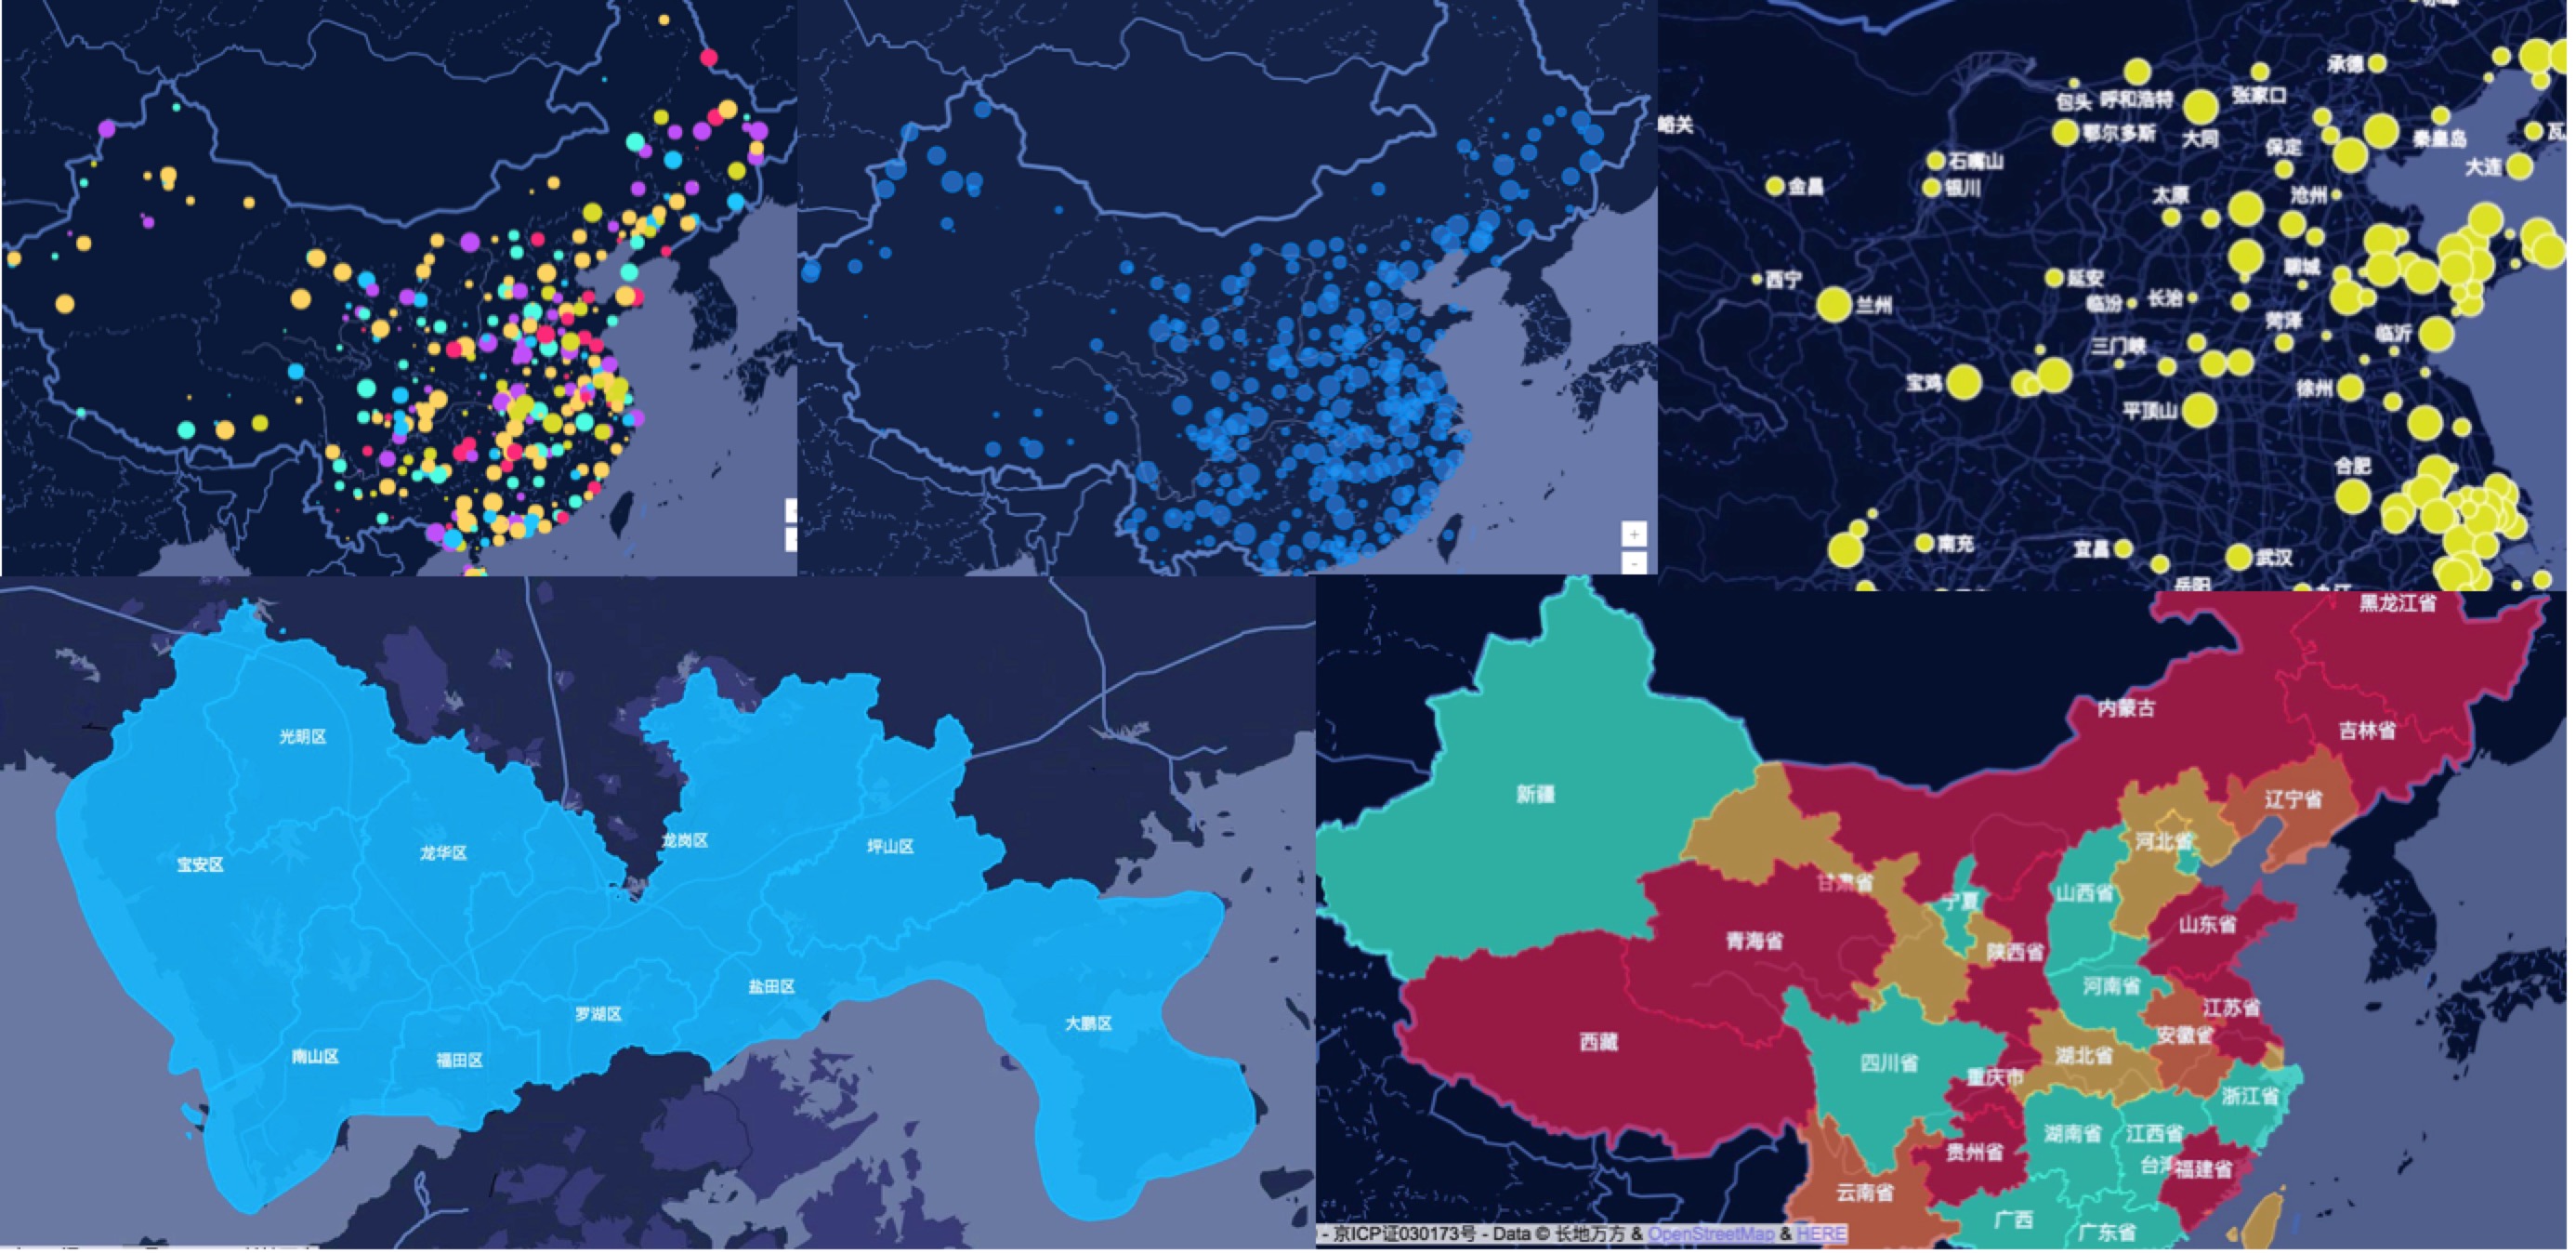
inMap
inMap 是一款基于百度地图的大数据可视化库,专注于大数据方向的散点、热力图、网格、聚合等方式展示,致力于让大数据可视化变得简单易用。
Features
- 多图层叠加.
- 支持GeoJSON
- 友好的 API.
- 可以自定义主题.
示例效果图
首先引用地图
<script type="text/javascript" src="http://api.map.baidu.com/api?v=3.0&ak=0lPULNZ5PmrFVg76kFuRjezF"></script>Using npm:
npm install inmap --save
或使用 <script> 全局引用,inMap 会被注册为一个全局变量:
<script type="text/javascript" src="http://unpkg.com/inmap/dist/inmap.min.js"></script><script>
var inmap = new inMap.Map({
id: 'allmap',
skin: 'Blueness',
center: [105.403119, 38.028658], // center of map
zoom: {
value: 5, // level of map
show: true, // whether to display the zoom button
max: 18,
min: 5
}
})
</script>examples
预览当前项目所有demo
# 从 GitHub 下载后,安装依赖
npm install

# 编译代码
npm run dev & npm run start

在浏览器地址栏输入:http://localhost:8088/examples/index.html
Major Contributors
欢迎加入QQ反馈问题: 618308202
Links
License
Copyright (c) 2015-present, TalkingData
</div
Recommend
About Joyk
Aggregate valuable and interesting links.
Joyk means Joy of geeK