
2

阿里云云监控实时数据对接自建Prometheus
source link: https://www.51cto.com/article/785566.html
Go to the source link to view the article. You can view the picture content, updated content and better typesetting reading experience. If the link is broken, please click the button below to view the snapshot at that time.
阿里云云监控实时数据对接自建Prometheus
原创作者:吴守阳 2024-04-08 08:00:00
云监控推出了监控数据实时导出工具。该工具可以在客户的线下运行,根据配置实时获取云监控的监控数据,并持续写入本地Prometheus。

部分客户在云下已有完善的企业IT管理系统,希望能够将云上数据实时导出到线下进行统一监控。基于该场景,云监控推出了监控数据实时导出工具。该工具可以在客户的线下运行,根据配置实时获取云监控的监控数据,并持续写入本地Prometheus。
- 支持云监控里的所有云服务。
- 更快更实时的基于企业云监控的实时数据导出功能流式导出监控数据,无需担心数据丢失的异常情况,更不用担心API调用次数限制和流控问题。
- 本地化部署,操作简单。
- 导出的监控数据维度更丰富,自动补全实例IP地址、实例名称、地域、资源组、标签等信息,使数据可以更方便的通过PromQL进行多维度的统计分析。
开通企业云监控不会产生任何费用,后续将按照实际使用量进行计费。关于实时数据导出的计费标准,请参见实时数据导出。
请确保您已开通企业云监控。具体操作,请参见开通企业云监控。 Prometheus必须与云监控网络互通。
1.服务解压
[root@prometheus opt]# unzip exporter_local-2023_04_23_18-24-53.zip
[root@prometheus opt]# mv exporter_local-2023_04_23_18-24-53  alyun_exporter
2.修改配置文件
[root@prometheus opt]# vim /opt/alyun_exporter/configs/product.yml
# 服务端接入点,配置文件位置、日志等级等
serverconf:
service_endpoint: cms-export.cn-shanghai.aliyuncs.com             # export服务地址(公网地址)
page_size: 300                                        # 查询数据的分页大小
log_dest: 1                                           # 1 stdout; 2 file
log_dir:                                              # 日志文件位置
log_level: Warning                                       # 日志等级
http_proxy:                                           # http代理
https_proxy:                                          # https代理
no_proxy:                                             # noproxy代理
no_meta: true                                         # 是否补充meta信息的功能
no_savepoint: true                                    # 是否记录进度
no_tag_prefix: true                                   # 是否为标签增加'tag_'前缀
# 远端 Prometheus 的写入地址和鉴权
remote_prom:
endpoint: http://172.30.71.5:9090/api/v1/write        # Prometheus服务地址(本地自建,需开启远程写入)
basic_auth:
username: name # basic auth 的 username
password: bb # basic auth 的 password
# 用户账号的信息,tag,desc等信息的查询
credential:
user_id: 14554*****     # 用户的 userid
access_key: L*****o9    # 用户的 ak
access_secret: O*****S # 用户的 sk
# 配置用户想要写入数据的label,如果不需要可以直接删除这一项配置
#datatag:
# - {key: customKey1, val: val1}
# - {key: customKey2, val: val2}
# 配置需要导出的产品类型和指标
products:
- namespace: acs_rds_dashboard ##名字是固定死的
metric_info:
- metric_list: [ConnectionUsage,CpuUsage,DataDelay,DiskUsage,IOPSUsage,MemoryUsage,MySQL_ActiveSessions,MySQL_ComDelete,MySQL_ComInsert,MySQL_ComInsertSelect,MySQL_ComReplace,MySQL_ComReplaceSelect,MySQL_ComSelect,MySQL_ComUpdate,MySQL_DataDiskSize,MySQL_IbufDirtyRatio,MySQL_IbufReadHit,MySQL_IbufRequestR,MySQL_IbufRequestW,MySQL_IbufUseRatio,MySQL_InnoDBDataRead,MySQL_InnoDBDataWritten,MySQL_InnoDBLogFsync,MySQL_InnoDBLogWriteRequests,MySQL_InnoDBLogWrites,MySQL_InnoDBRowDelete,MySQL_InnoDBRowInsert,MySQL_InnoDBRowRead,MySQL_InnoDBRowUpdate,MySQL_InstanceDiskSize,MySQL_LogDiskSize,MySQL_NetworkInNew,MySQL_NetworkOutNew,MySQL_OtherDiskSize,MySQL_ProxyCpuUsage,MySQL_QPS,MySQL_SlaveIORunning,MySQL_SlaveSQLRunning,MySQL_SlowQueries,MySQL_TPS,MySQL_TempDiskTableCreates,MySQL_ThreadsConnected,MySQL_TmpDiskSize,MySQL_ibufPoolReads]
period: 60
- namespace: acs_mongodb  ##名字是固定死的
metric_info:
- metric_list: [ShardingCPUUtilization,ShardingConnectionAmount,ShardingConnectionUtilization,ShardingDataDiskAmount,ShardingDataDiskAmountOriginal,ShardingDiskUtilization,ShardingIOPSUtilization,ShardingInstanceDiskAmount,ShardingIntranetIn,ShardingIntranetOut,ShardingLogDiskAmount,ShardingMemoryUtilization,ShardingNumberRequests,ShardingOpCommand,ShardingOpDelete,ShardingOpGetmore,ShardingOpInsert,ShardingOpQuery,ShardingOpUpdate,ShardingQPS,ShardingReplicationLag]
period: 60
[root@prometheus-20230428 alyun_exporter]# ./exporter_local &4.在prometheus获取指标
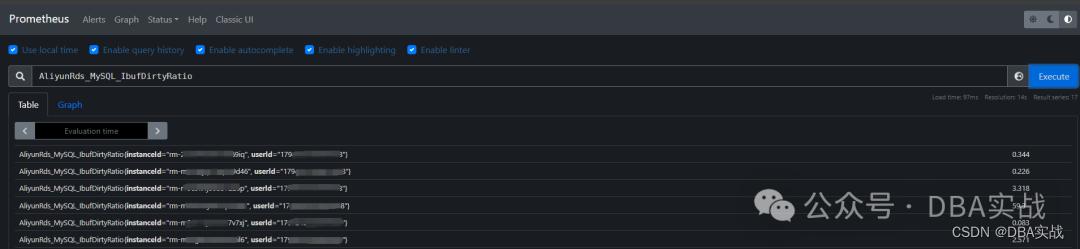
AliyunMongodb_ShardingConnectionAmount
AliyunRds_MySQL_IbufDirtyRatio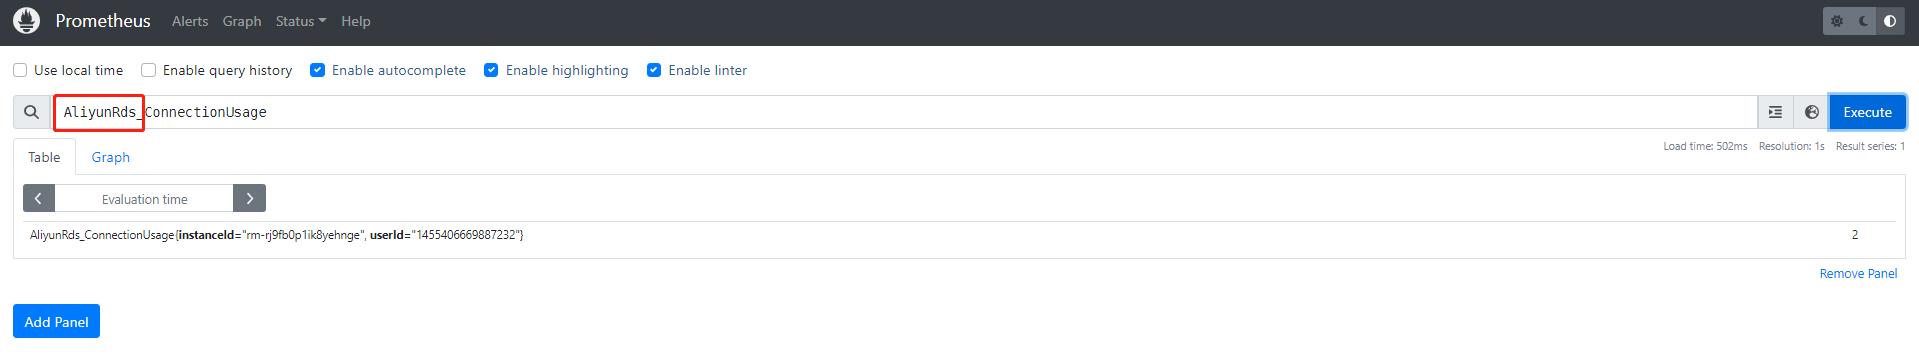
注意指标前缀:
企业云监控服务,在设计之初就带上了 Aliyun+{产品名称} + "_" 这样的前缀,比如:
- ecs的指标会增加前缀 AliyunEcs_
- slb的指标会增加前缀 AliyunSlb_
- eip的指标会增加前缀 AliyunVpceip_
- fc的指标会增加前缀 AliyunFc_
#配置需要导出的产品类型和指标
5.Prometheus页面展现
由于该组件是将云监控数据写入到Prometheus,Prometheus是无需做任何配置,只需开启远程写入即可,Prometheus里面不会主动显示监控的相关实例,可以被动进行实例查询。
6.Grafana 页面展现
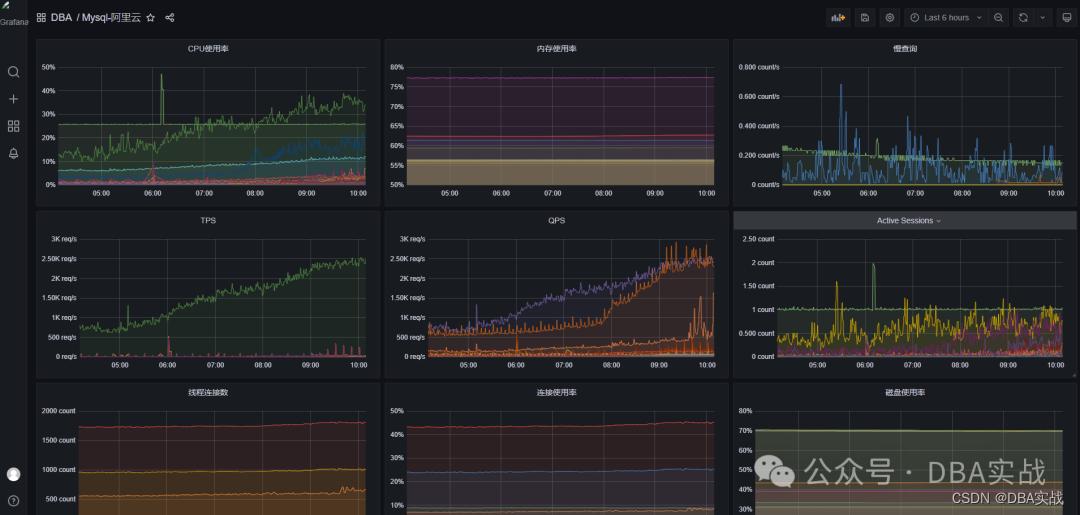
有组件安装包以及Grafana阿里云模版需求的可以关注我公众号,私聊我。
吴守阳,51CTO社区编辑,拥有8年DBA工作经验,熟练管理MySQL、Redis、MongoDB等开源数据库。精通性能优化、备份恢复和高可用性架构设计。善于故障排除和自动化运维,保障系统稳定可靠。具备良好的团队合作和沟通能力,致力于为企业提供高效可靠的数据库解决方案。
责任编辑:姜华
来源:
DBA实战
Recommend
About Joyk
Aggregate valuable and interesting links.
Joyk means Joy of geeK