

When Data Serves Turkey
source link: https://rjlipton.com/2016/11/30/when-data-serves-turkey/
Go to the source link to view the article. You can view the picture content, updated content and better typesetting reading experience. If the link is broken, please click the button below to view the snapshot at that time.
When Data Serves Turkey
A head-scratching inconsistency in large amounts of chess data

|
| Slate source |
Benjamin Franklin was the first American scientist and was sometimes called “The First American.” He also admired the American turkey, counter to our connotation of “turkey” as an awkward failure.
Today I wonder what advice Ben would give on an awkward, “frankly shocking,” situation with my large-scale chess data. This post is in two parts.
A common myth holds that Franklin advocated the turkey instead of the bald eagle for the Great Seal of the United States. In 1784, two years after the Great Seal design was approved over designs that included a bird-free one from Franklin, he wrote a letter to his daughter saying he was happy that the eagle on an emblem for Revolutionary War officers looked like a turkey. Whereas the eagle “is a Bird of bad moral Character [who] does not get his Living honestly” and “a rank coward,” the turkey is “in Comparison a much more respectable Bird, […and] though a little vain & silly, a Bird of Courage.” The Tony-winning 1969 musical 1776 cemented the myth by moving Franklin’s thoughts up eight years.
More to my point is a short letter Franklin wrote in 1747 at the height of his investigations into electricity. In his article “How Practical Was Benjamin Franklin’s Science,” Ierome Cohen summarizes it as admitting “that new experimental data seemed not to accord with his principles” and quotes (with Franklin’s emphasis):
“In going on with these Experiments, how many pretty systems do we build, which we soon find ourselves oblig’d to destroy! If there is no other Use discovered of Electricity, this, however, is something considerable, that it may help to make a vain Man humble.”
My problem, however, is that the humbling from data comes before stages of constructing my system. Cohen moves on to the conclusion of a 1749 followup letter and ascribes it to Franklin’s self-deprecating humor:
“Chagrined a little that we have been hitherto able to produce nothing in this way of use to mankind; [yet in prospect:] A turkey is to be killed for our dinner by the electrical shock, and roasted by the electrical jack, before a fire kindled by the electrified bottle: when the healths of all the famous electricians in England, Holland, France, and Germany are to be drank in electrified bumpers, under the discharge of guns from the electrical battery. ”
The Data
My backbone data set comprises all available games compiled by the ChessBase company in which both players were within 10 points of the same century or half-century mark in the Elo rating system. Elo ratings, as maintained by the World Chess Federation (FIDE) since 1971, range from Magnus Carlsen’s current 2853 down to 1000 which is typical of novice tournament players. National federations including the USCF track ratings below 1000 and may have their own scales. The rating depends only on results of games and so can be applied to any sport; the FiveThirtyEight website is currently using Elo ratings to predict NFL football games. Prediction depends only on the difference in ratings, not the absolute numbers—thus FiveThirtyEight’s use of a range centered on 1500 does not mean NFL teams are inferior to chess players. The linchpin is that a difference of 200 confers about a 75% expectation for the stronger player.
The difference of 81 to Sergey Karjakin’s 2772 gave Carlsen about a 61% points expectation, which FiveThirtyEight translated into an 88% chance of winning the match. This assumed that tiebreaks after a 6-6 tie—the situation we have today—would be a coinflip.
A chief goal of my work—besides testing allegations of human players cheating with computers during games—is to measure skill by analyzing the quality of a player’s moves directly rather than only by results of games. A top-level player may play only 100 games in a given year, a tiny sample, but those games will furnish on the order of 3,000 moves—excepting early “book” opening moves and positions where the game is all-but-over—which is a good sample. The 12 match games gave me an even better ratio since several games were long and tough: 517 moves for each player. My current model assesses Karjakin’s level of play in these games at 2890 +- 125, Carlsen’s at 2835 +- 135, with a combined level of 2865 +- 90 over 1,034 moves. The two-sigma error bars ward against concluding that Karjakin has outplayed Carlsen, but they do allow that Karjakin brought his “A-game” to New York and has played tough despite being on the ropes in games 3 and 4. No prediction for today’s faster-paced tiebreak games is ventured. (As we post, Carlsen missed wins in the second of four “Rapid” paced games; they are playing the third now still all-square.)
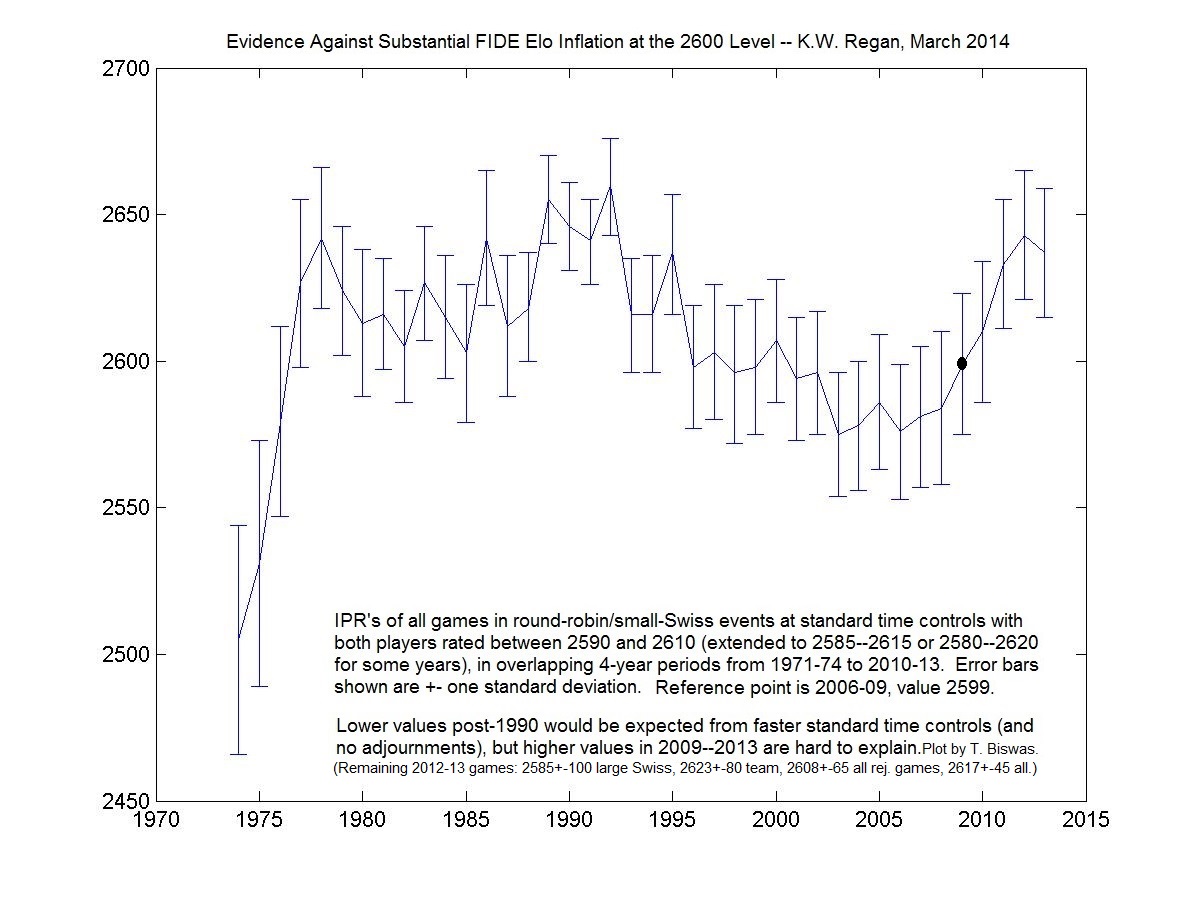
These figures are based on my earlier training sets from the years 2006–2013 on Elo century points 2000 through 2700, in which I analyzed positions using the former-champion Rybka 3 chess program. Rybka 3 is now far excelled by today’s two champion programs, called Komodo and Stockfish. I have more than quadrupled the data by adding the half-century marks and using all years since 1971, except that the range 2000-to-2500, with by far the most published games, uses the years 2006–2015. In all it has 2,926,802 positions over 48,416 games. The milepost radius is widened from 10 to 15 Elo points for the levels 1500–1750 and 2750, to 20 for 1400–1450 and 2800, and to 25 for 1050–1350. All levels have at least 20,000 positions except 1050–1150, while 2050–2300 and 2400 have over 100,000 positions each and 2550 (which was extended over all years) has 203,425. All data was taken using the University at Buffalo Center for Computational Research (CCR).
A Great Fit and a Problem
One factor that goes into my “Intrinsic Performance Ratings” is the aggregate error from moves the computer judges were inferior. All major programs—called engines—output values in discrete units of 0.01 called centipawns. For instance, a move value of +0.48 leaves the player figuratively almost half a pawn ahead, while -0.27 means a slight disadvantage. If the former move is optimal but the player makes the latter move, the raw difference is 0.75. Different engines have their own scales—even human chess authorities differ on whether to count a Queen as 9 or 10—and the problem of finding a common scale is the heart of my turkey.
Here are my plots of average raw difference (AD) over all of my thirty-six rating mileposts with the official Komodo 10.0 and Stockfish 7 versions. Linear regression, weighted by the number of moves for each milepost, was done from AD to Elo, so that the rating of zero error shows as the 

Having 
The scales between Komodo and Stockfish are also quite close. I am using Stockfish as baseline since it is open-source; to bring Komodo onto its scale here suggests multiplying its values 
Komodo 10 and Stockfish 7 agree within their error bars on the
A Second Problem Fixes the First, Maybe
A second issue is shown by graphing the average raw error as a function of the overall position value (i.e., the value of an optimal move) judged by the program, for players at any one rating level. Here they are with Stockfish 7 for the levels 1400, 1800, 2200, and 2600 (a few low-weight high outliers near the -4.0 limit have been scrubbed):


If taken at face value, this would say e.g. that 2600-level players, strong grandmasters, play twice as badly (0.12 error) when they are 0.75 ahead as when the game is even (0.06). Tamal Biswas and I found evidence against a claim that this effect is rational. Hence it is a second problem.
What has most immediately distinguished mine from others’ work since 2008 is that I correct for this effect by scaling the raw errors. My scaling function applies locally to each move, using only its value 


The plot for Elo 2050 is almost perfect, while the flattening remains good especially on the positive side throughout the range 1600–2500 which has almost all the data. I call the modified error metric ASD for average scaled difference, which is in units of “PEPs” for “pawns in equal positions” since the correction metric has value 


The fits are even better and with the previous “noise” at lower Elo levels optically much reduced. The
Most to the point, however, is that choosing to do scaling made a hugely significant difference in the intercept. The scaling is well-motivated, but the AD-to-Elo fit was already great without it. I could have stopped and said my evidence—from very large data—pegs perfection at 3200. This prompts us to ask:
How often does it happen that data-driven results have such degree of hidden arbitrariness?
I am sure Ben Franklin would have had some wise words about this. But we haven’t even gotten to the real issue yet.
Open Problems
What lessons for “Big Data” are developing here? To be continued after the match playoff ends…
[made figure labels more consistent with text, updated data size figures, added acknowledgment]
Like this:
Related
Magnus and the Turkey GrinderDecember 8, 2016In "All Posts"
Far From a Turkey ShootNovember 25, 2018In "All Posts"
The Singularity Is Here In ChessMarch 19, 2012In "News"
Recommend
About Joyk
Aggregate valuable and interesting links.
Joyk means Joy of geeK