

Make SHOW as good as SELECT even with InnoDB
source link: http://ocelot.ca/blog/blog/2024/03/19/make-show-as-good-as-select-even-with-innodb/
Go to the source link to view the article. You can view the picture content, updated content and better typesetting reading experience. If the link is broken, please click the button below to view the snapshot at that time.
Make SHOW as good as SELECT even with InnoDB
Here’s a snippet of what I’d like SHOW ENGINE INNODB STATUS to look like:
as opposed to what the server sends:
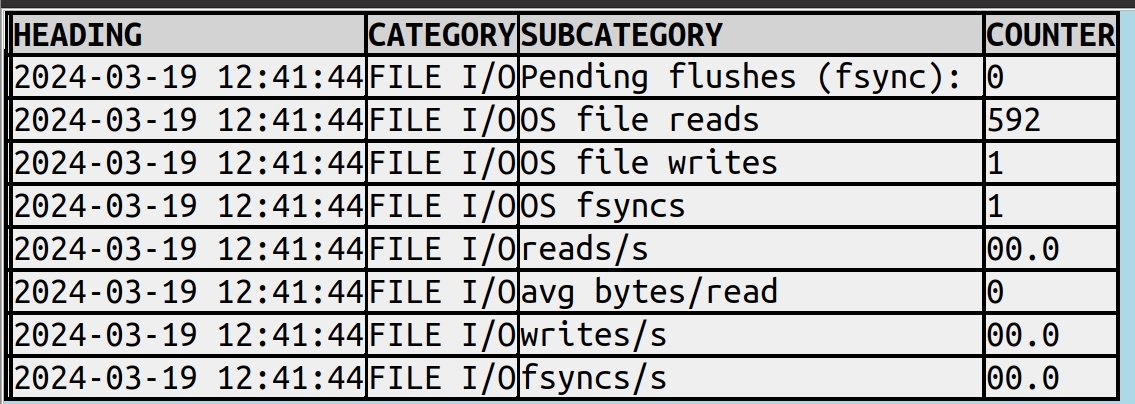
...
--------
FILE I/O
--------
Pending flushes (fsync): 0
295 OS file reads, 1 OS file writes, 1 OS fsyncs
0.00 reads/s, 0 avg bytes/read, 0.00 writes/s, 0.00 fsyncs/s
...
In my last post I described a way to
Make SHOW as good as SELECT”
which was possible because most result sets from SHOW etc. are at least table-like, but
STATUS’s wall of text isn’t table-like. So I forced it into a table with these basic rules:
- A line inside ——s, like FILE I/O, is the category of what follows.
- Otherwise a line is a row but if it contains commas it is multiple rows.
- Numbers can usually be extracted from text as different columns..
After that there’s still a bunch of fiddling, I put the details in source-code comments.
Version 2.3
The new features related to SHOW etc. are now in a released version as well as in source code,
downloadable from github.
In the rest of this post I’ll show a complete result from SHOW ENGINE INNODB STATUS; (“before”),
and the same data from SHOW ENGINE INNODB STATUS WHERE 1 > 0; after ocelot_statement_syntax_checker
has been set to ‘7’ (“after”). (Instead of copying the Grid Widget I copied from the History Widget
after setting Max Row Count to 100.)
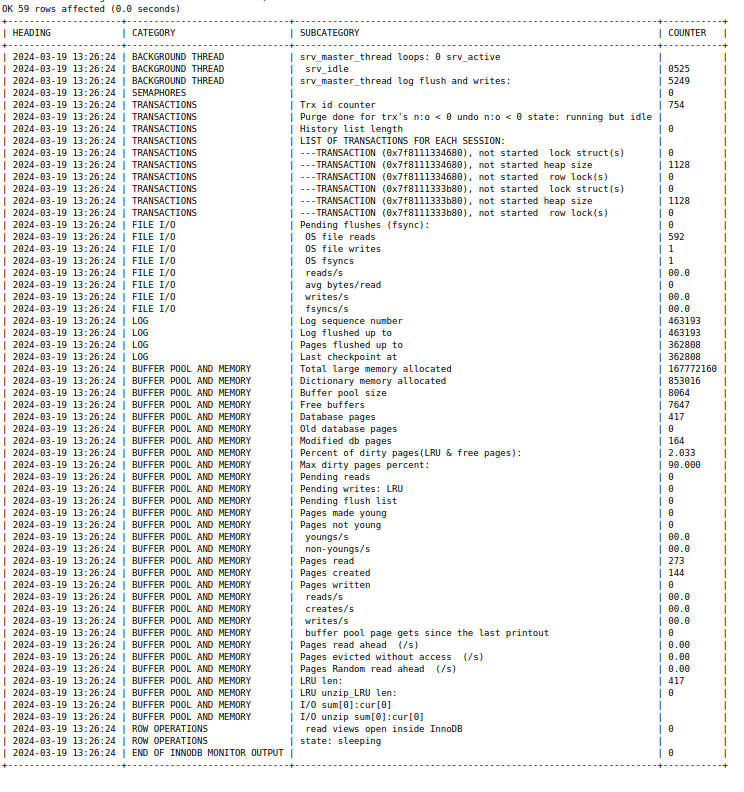
“before”
| InnoDB |      |
=====================================
2024-03-19 12:39:45 0x7f80f01f3700 INNODB MONITOR OUTPUT
=====================================
Per second averages calculated from the last 43 seconds
-----------------
BACKGROUND THREAD
-----------------
srv_master_thread loops: 0 srv_active, 2455 srv_idle
srv_master_thread log flush and writes: 2454
----------
SEMAPHORES
----------
------------
TRANSACTIONS
------------
Trx id counter 754
Purge done for trx's n:o < 0 undo n:o < 0 state: running but idle
History list length 0
LIST OF TRANSACTIONS FOR EACH SESSION:
---TRANSACTION (0x7f8111334680), not started
0 lock struct(s), heap size 1128, 0 row lock(s)
---TRANSACTION (0x7f8111333b80), not started
0 lock struct(s), heap size 1128, 0 row lock(s)
--------
FILE I/O
--------
Pending flushes (fsync): 0
295 OS file reads, 1 OS file writes, 1 OS fsyncs
0.00 reads/s, 0 avg bytes/read, 0.00 writes/s, 0.00 fsyncs/s
---
LOG
---
Log sequence number 463193
Log flushed up to   463193
Pages flushed up to 362808
Last checkpoint at  362808
----------------------
BUFFER POOL AND MEMORY
----------------------
Total large memory allocated 167772160
Dictionary memory allocated 853016
Buffer pool size   8064
Free buffers       7647
Database pages     417
Old database pages 0
Modified db pages  164
Percent of dirty pages(LRU & free pages): 2.033
Max dirty pages percent: 90.000
Pending reads 0
Pending writes: LRU 0, flush list 0
Pages made young 0, not young 0
0.00 youngs/s, 0.00 non-youngs/s
Pages read 273, created 144, written 0
0.00 reads/s, 0.00 creates/s, 0.00 writes/s
No buffer pool page gets since the last printout
Pages read ahead 0.00/s, evicted without access 0.00/s, Random read ahead 0.00/s
LRU len: 417, unzip_LRU len: 0
I/O sum[0]:cur[0], unzip sum[0]:cur[0]
--------------
ROW OPERATIONS
--------------
0 read views open inside InnoDB
state: sleeping
----------------------------
END OF INNODB MONITOR OUTPUT
============================
 |
“after”
/
Recommend
About Joyk
Aggregate valuable and interesting links.
Joyk means Joy of geeK