

Introducing the Benchmark Package: Complementing Unit Tests with Performance Che...
source link: https://www.swift.org/blog/benchmarks/
Go to the source link to view the article. You can view the picture content, updated content and better typesetting reading experience. If the link is broken, please click the button below to view the snapshot at that time.
Introducing the Benchmark Package: Complementing Unit Tests with Performance Checks
March 20, 2024

In the world of software development, the old adage “make it work, make it right, make it fast” serves as a guiding principle for creating robust, efficient applications. This journey starts with ensuring that our code functions as intended, a task where unit and integration testing have proven indispensable. However, ensuring functionality is only part of the equation. The true measure of an application’s excellence extends into its performance - how fast and efficiently it operates under various conditions. Herein lies the critical but often overlooked third step: making it fast.
In the realm of professional trading software, the role of a comprehensive benchmarking framework integrated with Continuous Integration (CI) parallels the importance of unit and integration testing. Just as unit and integration tests are essential for ensuring the functional correctness of software, benchmarking within a CI pipeline is crucial for continuously validating the non-functional aspects, such as high throughput, low latency, predictable performance and consistent resource usage. This is vital for maintaining the competitive edge in a fast-paced financial environment where the extreme market data rates and performance requirements means that even small variations in response time - on the scale of microseconds - can significantly impact trade outcomes.
Performance is an important part of the overall product regardless of the application domain, no end user wants to wait on a computer or other electronic device, instant response to user operations truly helps provide a delightful end user experience.
After examining the existing infrastructure within the Swift ecosystem, we concluded that there were no existing solutions meeting our needs for multi-platform and rich metrics support, CI integration, and developer-friendliness. Therefore, we decided to develop a Benchmark package and open source it, believing it could help advance performance for the Swift community and benefit all of us.
The Role Of Benchmarks
Have you ever encountered a performance problem that slipped through to end users which resulted in a bug report? Do you systematically measure and validate performance metrics when making changes to your Swift package?
Swift aims for performance that rivals C-based languages, emphasizing predictable and consistent execution. Achieving this involves optimizing the use of constrained resources like CPU, memory, and network bandwidth, which significantly influence application workloads across server-side, desktop, and mobile environments. Key performance metrics include CPU usage, memory allocation and management, network I/O, and system calls, among others. These metrics are essential for foundational software, where controlling resource usage and minimizing footprint are as critical as maintaining runtime performance. The Benchmark package readily supports these metrics, along with OS-specific ones for Linux and macOS, providing a comprehensive toolkit for Swift developers to monitor and enhance their applications’ efficiency.
Constructing a set of benchmarks and consistently running them provides an indication when something is not performing as expected, just as a unit test flags if some functional expectation is broken. Then complementary tools (e.g. Instruments, DTrace, Heaptrack, Leaks, Sample, …) are used to for root-cause analysis to analyze and fix the underlying problem.
This is analogous to unit tests, where a failed test indicates that something is wrong, and other more specialized tools are used to fix the problem (e.g., a debugger, TSAN/ASAN, adding asserts, debug printouts, …).
Benchmarking Infrastructure
The open-source Benchmark package helps you automate performance testing and makes it easy for individual developers to run a quick performance validation locally before pushing changes.
The Benchmark package is implemented as a SwiftPM command plugin and adds a dedicated command to interact with benchmarks:
swift package benchmark
Introductory getting started information is available both on the package GitHub page as well as in the Swift Package Index DocC documentation.
A minimalistic benchmark measuring the performance of Date would simply be:
import Benchmark
import Foundation

let benchmarks = {
    Benchmark("Foundation-Date") { benchmark in
        for _ in benchmark.scaledIterations {
            blackHole(Foundation.Date())
        }
    }
}
It is suitable both for microbenchmarks mostly concerned with CPU usage as well as for more complex long-running benchmarks and supports measuring a wide range of samples over a long time thanks to using the HDR Histogram package.
Benchmark provides support for an extensive set of built-in metrics:
cpuUser- CPU user space time spent for running the testcpuSystem- CPU system time spent for running the testcpuTotal- CPU total time spent for running the test (system + user)wallClock- Wall clock time for running the testthroughput- The throughput in operations / secondpeakMemoryResident- The resident memory usage - sampled during runtimepeakMemoryResidentDelta- The resident memory usage - sampled during runtime (excluding start of benchmark baseline)peakMemoryVirtual- The virtual memory usage - sampled during runtimemallocCountSmall- The number of small malloc calls according to jemallocmallocCountLarge- The number of large malloc calls according to jemallocmallocCountTotal- The total number of mallocs according to jemallocallocatedResidentMemory- The amount of allocated resident memory by the application (not including allocator metadata overhead etc) according to jemallocmemoryLeaked- The number of small+large mallocs - small+large frees in resident memory (just a possible leak)syscalls- The number of syscalls made during the test – macOS onlycontextSwitches- The number of context switches made during the test – macOS onlythreads- The maximum number of threads in the process under the test (not exact, sampled)threadsRunning- The number of threads actually running under the test (not exact, sampled) – macOS onlyreadSyscalls- The number of I/O read syscalls performed e.g. read(2) / pread(2) – Linux onlywriteSyscalls- The number of I/O write syscalls performed e.g. write(2) / pwrite(2) – Linux onlyreadBytesLogical- The number of bytes read from storage (may be from pagecache!) – Linux onlywriteBytesLogical- The number bytes written to storage (may be cached) – Linux onlyreadBytesPhysical- The number of bytes physically read from a block device – Linux onlywriteBytesPhysical- The number of bytes physically written to a block device – Linux onlyretainCount- The number of retain calls (ARC)releaseCount- The number of release calls (ARC)retainReleaseDelta-abs(retainCount - releaseCount)- if this is non-zero, it would typically mean the benchmark has a retain cycle (use Memory Graph Debugger to troubleshoot)
Custom metrics are supported as well for application-specific measurements (e.g. cache hit/miss statistics).
Writing Benchmarks
There’s an introduction to writing benchmarks as well as a sample repository.
A slightly more complicated benchmark measuring a part of the Histogram package:
import Benchmark
import Foundation
import Histogram
let benchmarks = {
// Minimal benchmark with default settings
Benchmark("Foundation-Date") { benchmark in
for _ in benchmark.scaledIterations {
blackHole(Foundation.Date())
}
}
// Slightly more complex with some customization
let customBenchmarkConfiguration: Benchmark.Configuration = .init(
metrics: [
.wallClock,
.throughput,
.syscalls,
.threads,
.peakMemoryResident
],
scalingFactor: .kilo
)
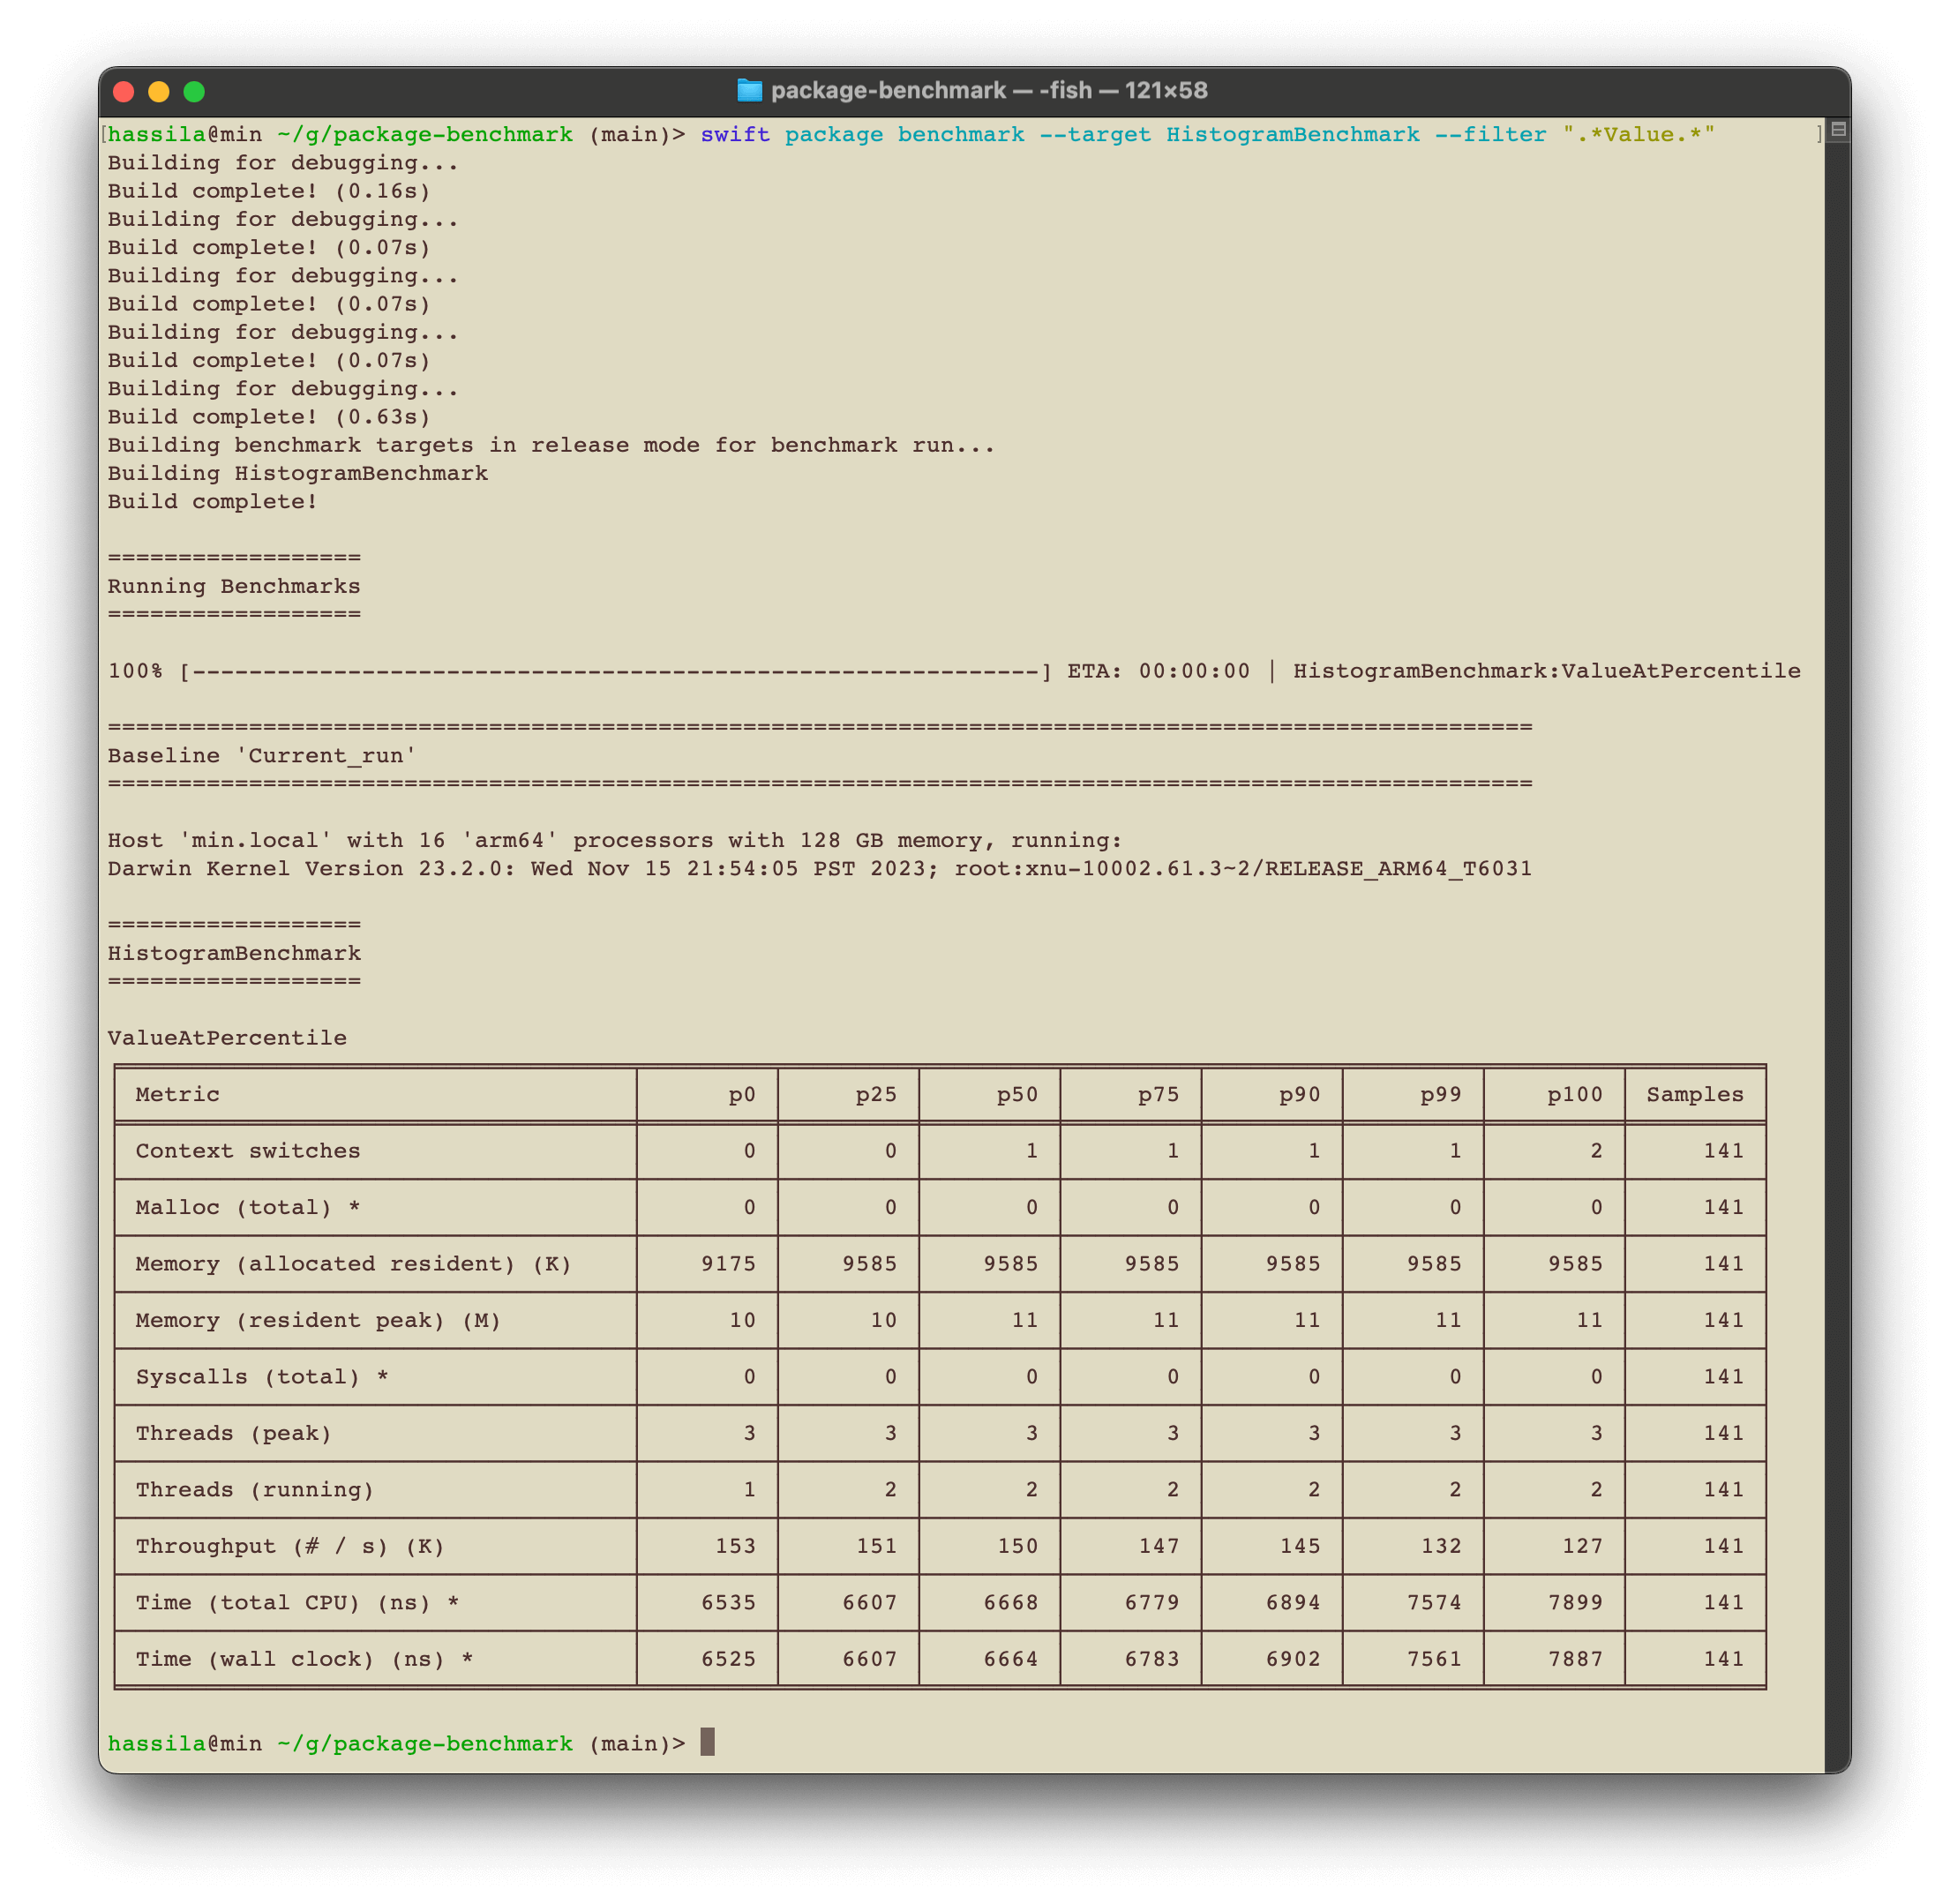
Benchmark("ValueAtPercentile", configuration: customBenchmarkConfiguration) { benchmark in
let maxValue: UInt64 = 1_000_000
var histogram = Histogram<UInt64>(highestTrackableValue: maxValue,
numberOfSignificantValueDigits: .three)
for _ in 0 ..< 10_000 {
blackHole(histogram.record(UInt64.random(in: 10 ... 1_000)))
}
let percentiles = [0.0, 25.0, 50.0, 75.0, 80.0, 90.0, 99.0, 100.0]
benchmark.startMeasurement() // don't measure the setup cost above
for i in benchmark.scaledIterations {
blackHole(histogram.valueAtPercentile(percentiles[i % percentiles.count]))
}
benchmark.stopMeasurement()
}
}
Benchmark Output And Analytics
The default output is in a table format for human readability, but the package supports a range of different output formats with output suitable for analysis with other visualization tools.
Sample default output when running benchmarks:
Key Benchmark Workflows Are Supported
- Automated Pull Request performance regression checks by comparing the performance metrics of a pull request with the main branch and having the PR workflow check fail if there is a regression according to absolute or relative thresholds specified per benchmark
- Automated Pull Request check vs. a pre-recorded absolute baseline p90 threshold (see e.g., Swift Certificates for such a workflow with related Docker files), suitable for e.g., malloc regression tests
- Manual comparison of multiple performance baselines for iterative or A/B performance work by an individual developer
- Export of benchmark results in several formats for analysis or visualization
- Running the Instruments profiler on the benchmark suite executable directly from Xcode
Closing Thoughts
The Swift community, including major public projects like Swift Foundation, SwiftPM, SwiftNIO, and Google Flatbuffers, has recently embraced the Benchmark package to focus on performance optimization.
Discover how to leverage this tool for your own Swift applications by exploring the extensive documentation and join the conversation on the Swift forums to share insights and get answers to your questions. Or why not provide a PR to your favourite open source package that lacks performance tests?
Take the first step to improve your software today, by adding its first benchmark to check performance!
Recommend
About Joyk
Aggregate valuable and interesting links.
Joyk means Joy of geeK