

GitHub - oslabs-beta/indiK8or: Kubernetes Visualization Tool
source link: https://github.com/oslabs-beta/indiK8or
Go to the source link to view the article. You can view the picture content, updated content and better typesetting reading experience. If the link is broken, please click the button below to view the snapshot at that time.


![]()
![]() IF YOU LIKE OUR PRODUCT, YOU CAN SHOW LOVE AND SUPPORT BY
IF YOU LIKE OUR PRODUCT, YOU CAN SHOW LOVE AND SUPPORT BY ![]() THIS REPOSITORY!
THIS REPOSITORY! ![]()
![]()
Built With
indiK8or
indiK8or is a Kubernetes Cluster Visualization Tool that will display your cluster metrics in real-time, it also provides the ability show security metrics by scanning your pods and display the vulnerabilities.
Features
- indiK8or provides an intuitive K8s cluster visualization, making it easy for users to understand their cluster's topology and access key details about each pod without running kubectl commands.
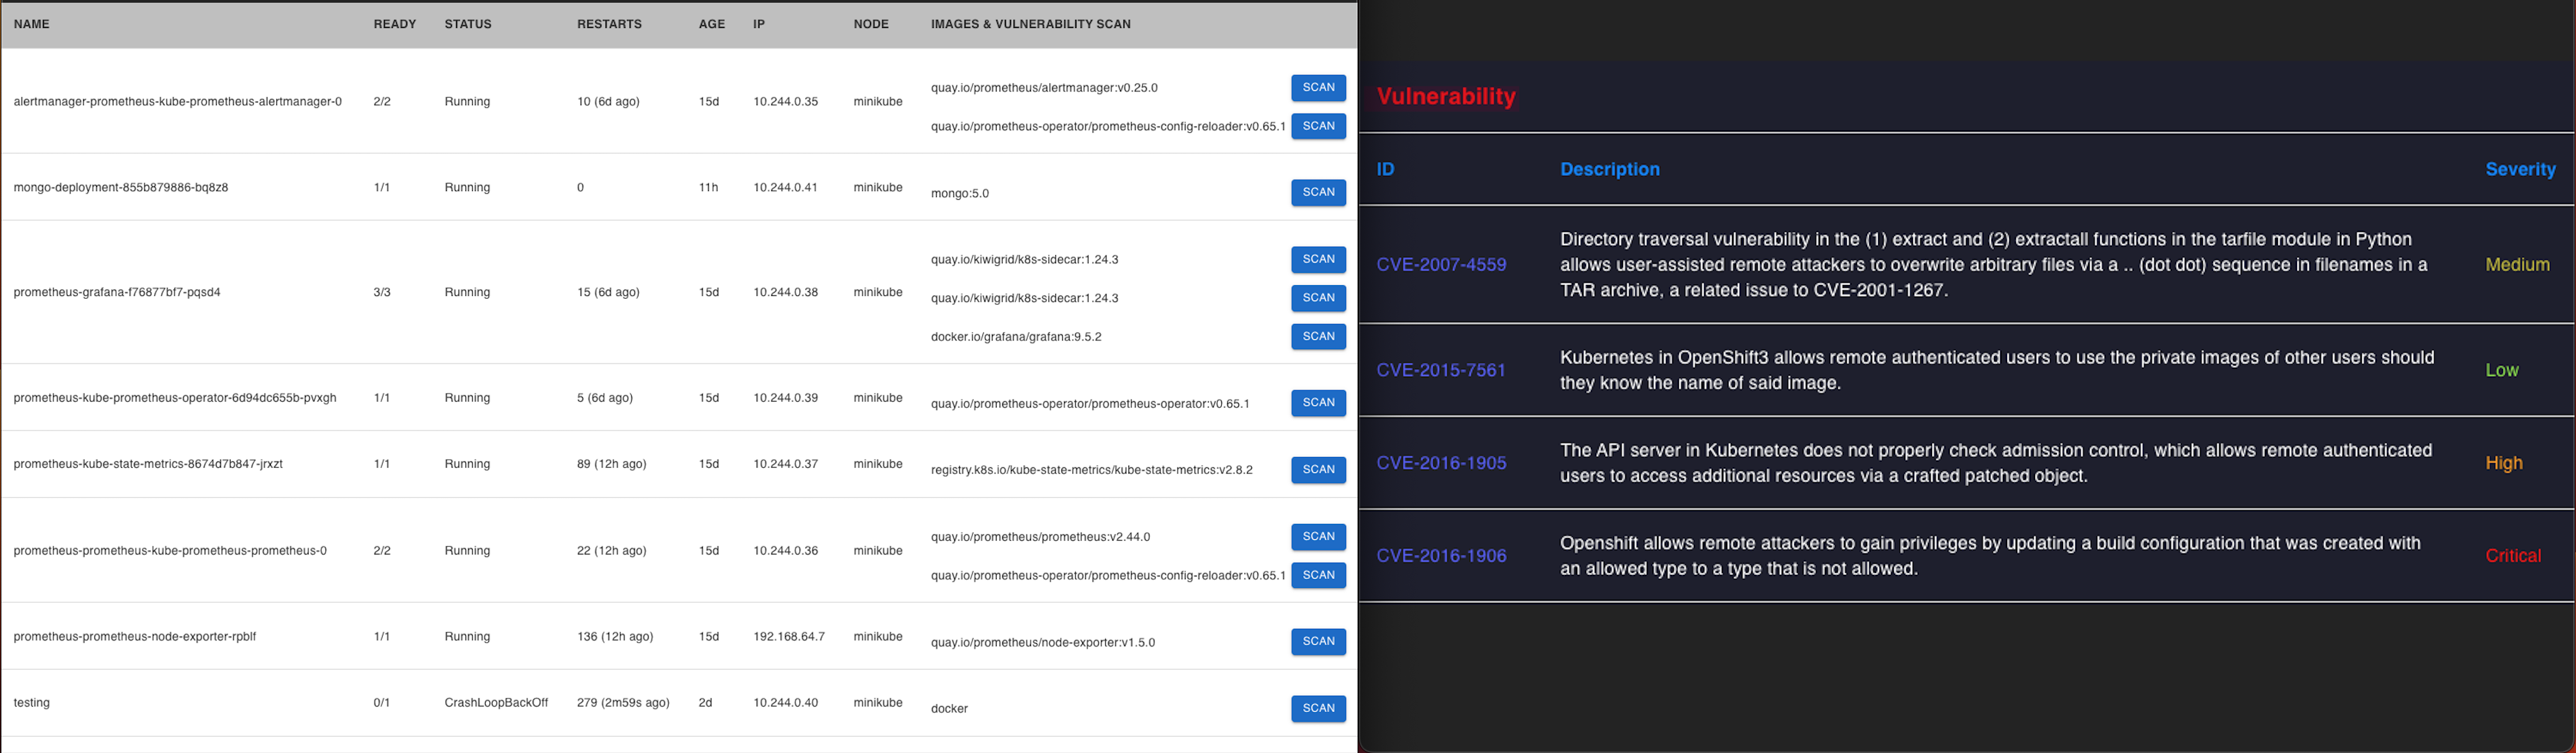
- Our app can conduct security scan of the pods in your K8s containers and display their vulnerabilities.
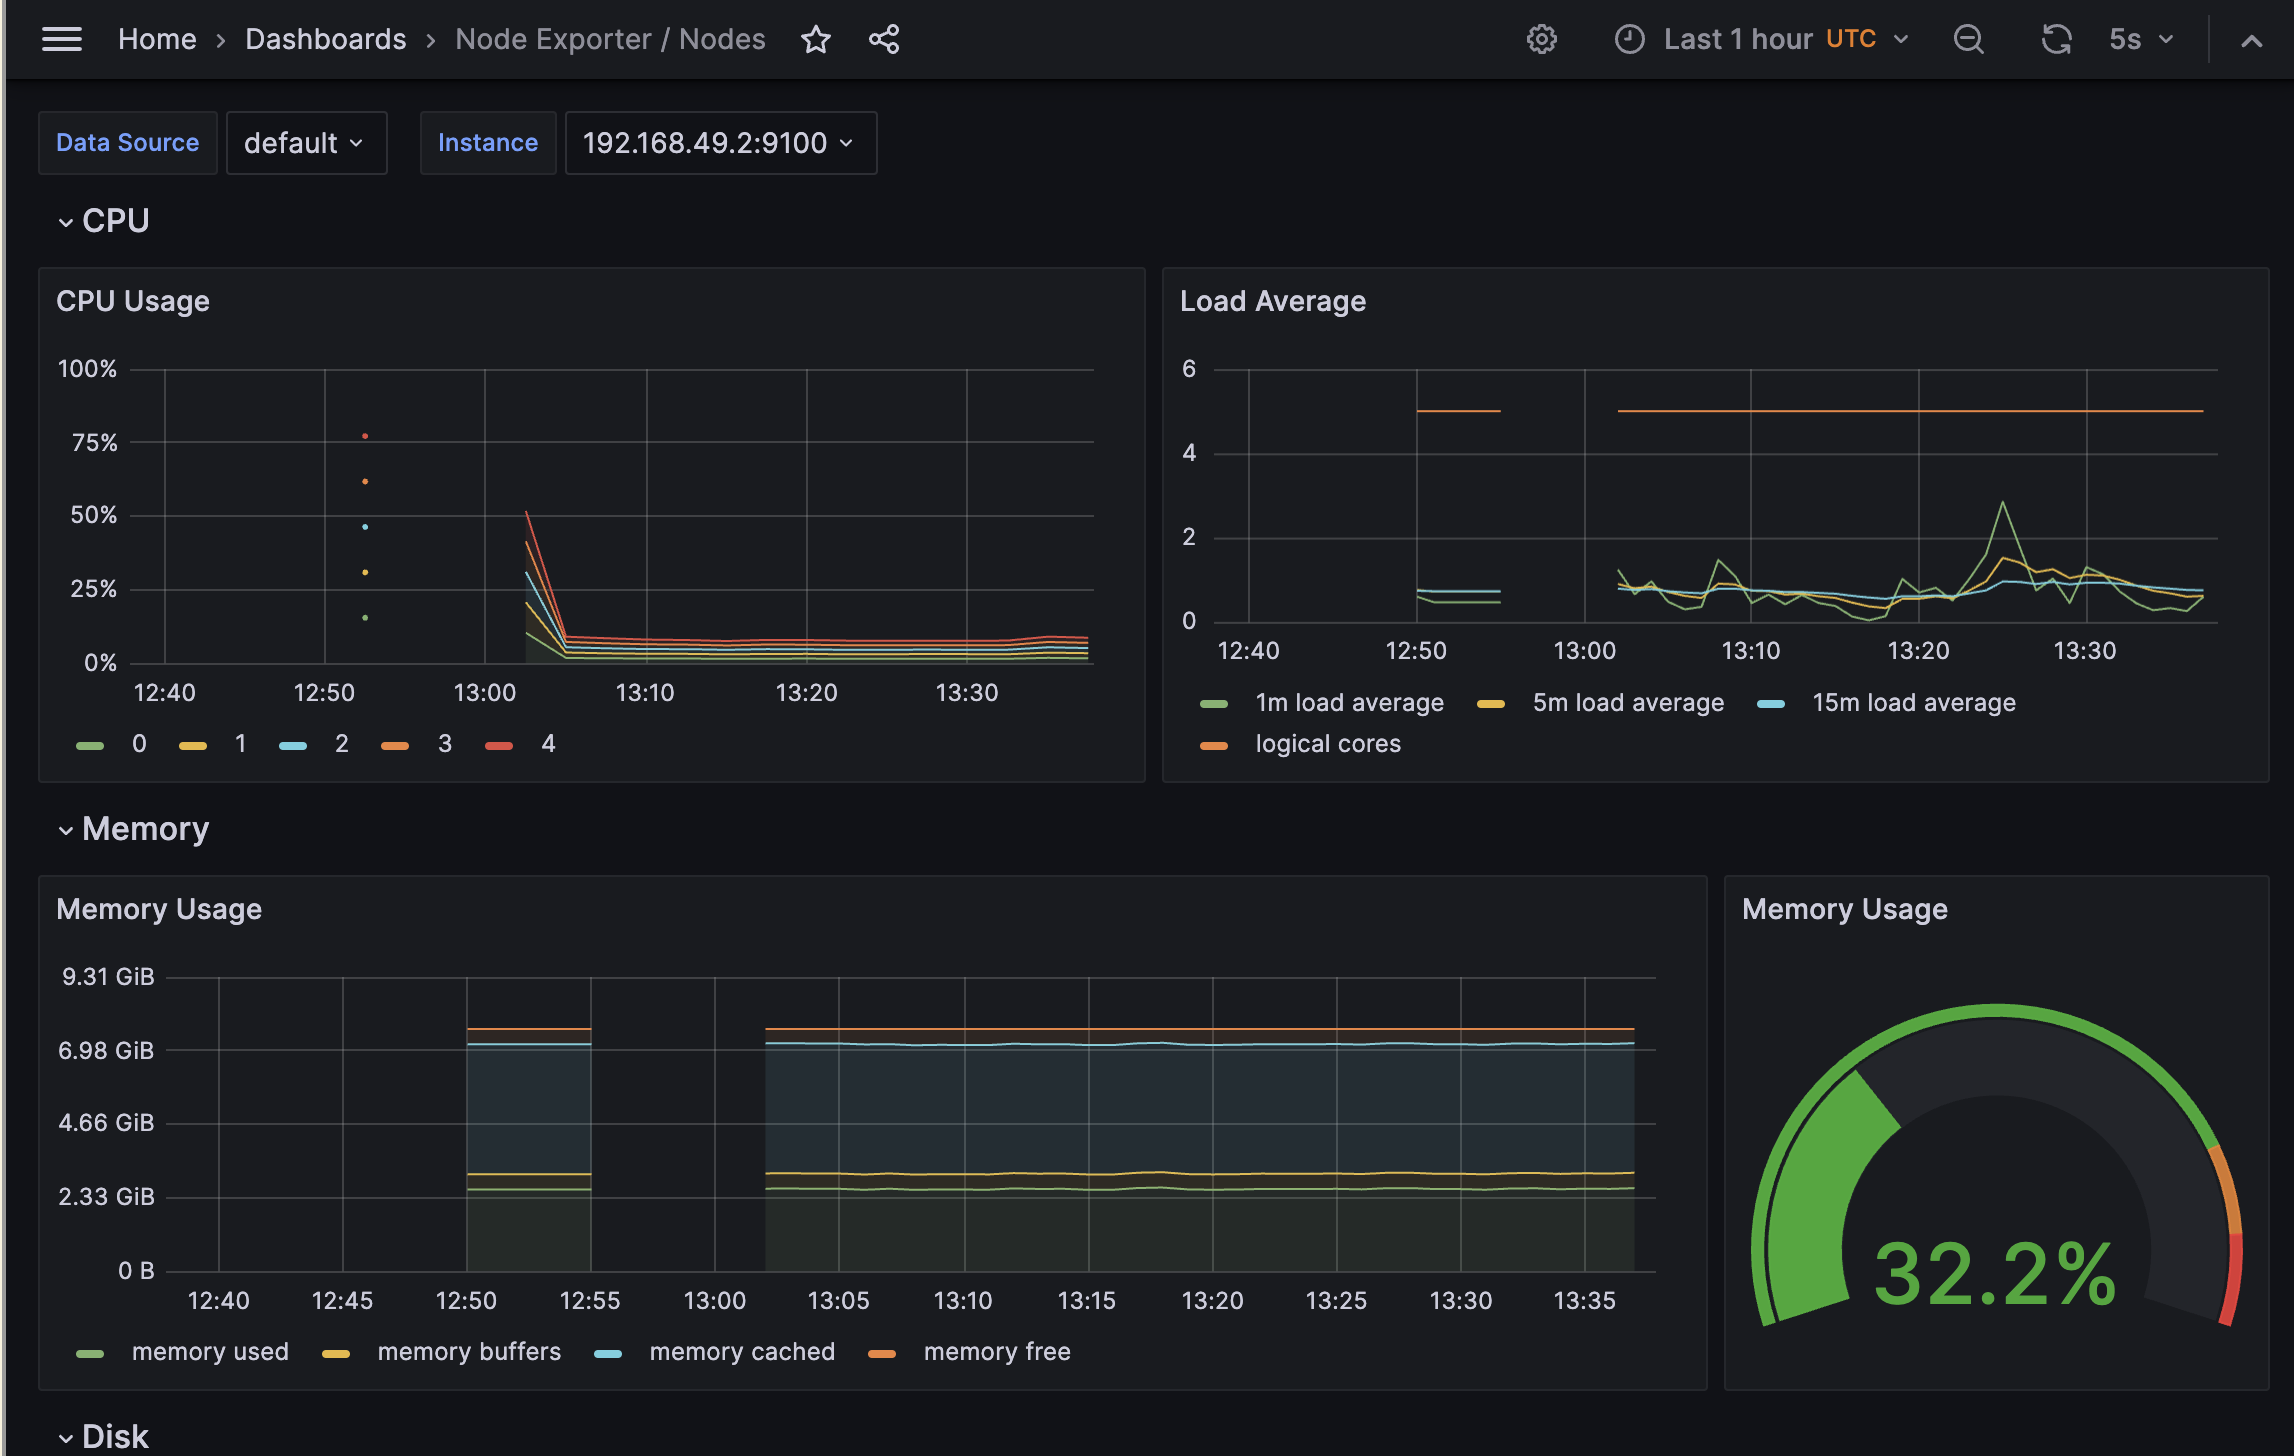
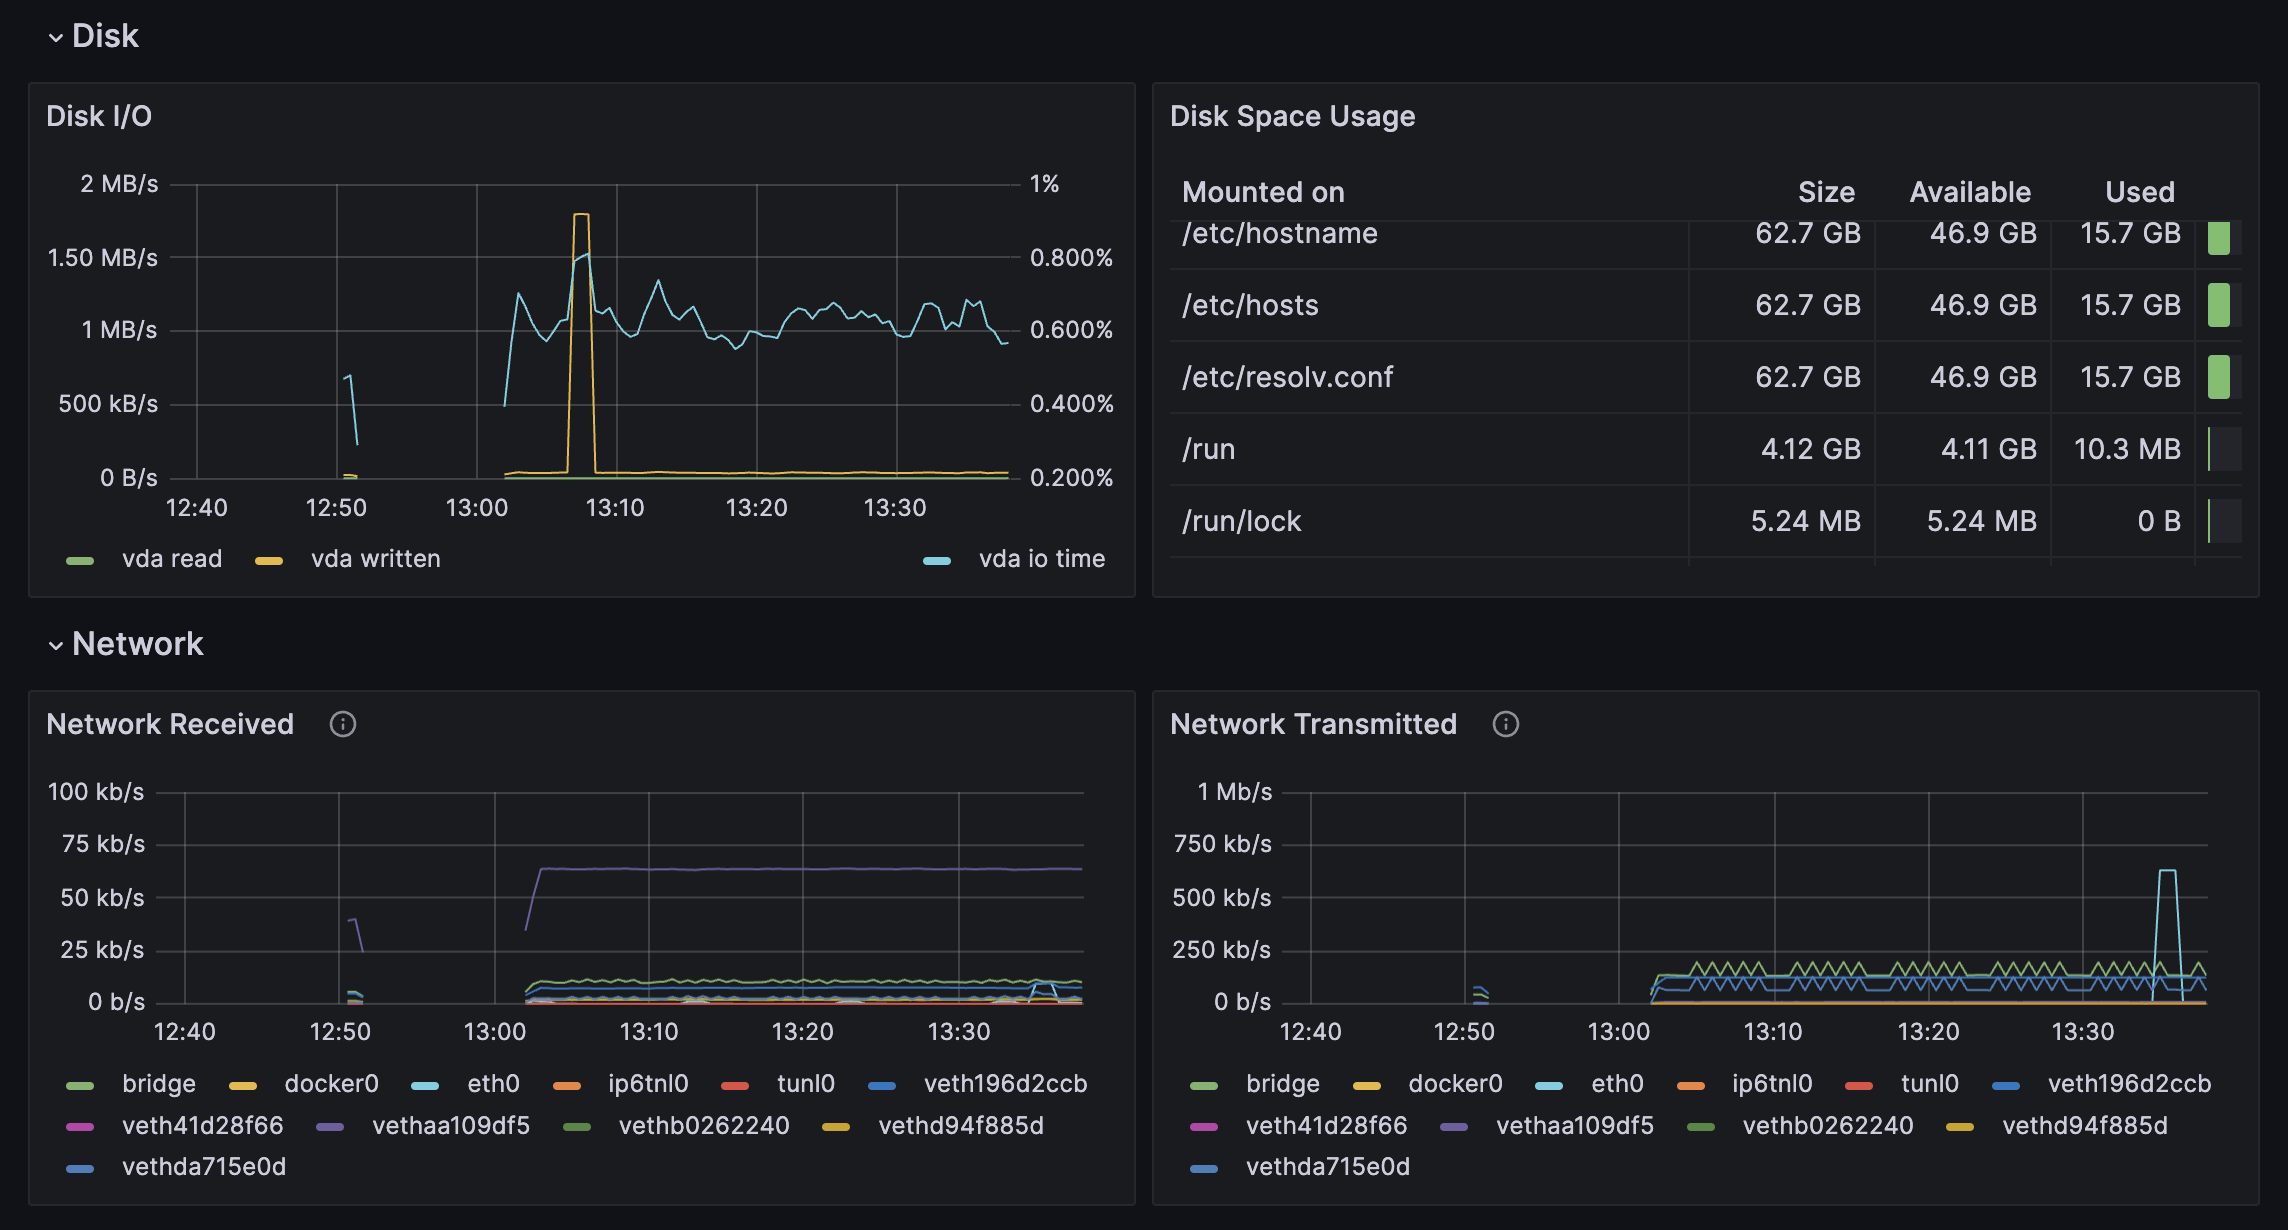
- The built-in Prometheus integration allows users to excute queries and easily monitor cluster performance without the need for additional configuration.
- Zero-setup Grafana integration provides users access to insightful visualizations of valuable cluster metrics.
Getting Started
indiK8or functionality assumes that you have Docker and Kubernetes already installed and running on your machine. The simplest way to install both is to follow the instructions for Docker Desktop installation, then enable Kubernetes from the Settings menu.
If you do not have a Kubernetes cluster up and running, use Minikube to quickly set one up, The instructions are laid out below.
NOTE: ONLY RUN STEP 1-15 IF THIS IS YOUR VERY FIRST TIME USING INDIK8TOR!
-
Make sure you have node.js installed, you can check if you have it by running
node -v -
Run
npm ito install all packages dependencies. -
Create a MongoDB database and Github OAuth credentials to use within your app.
-
create a .env file and assign the following environment variables according to your MongoDB and OAuth set up.
MONGO_URI='' SESSION_SECRET='' GitHubClientID='' GitHubClientSecret='' -
Make sure you have Docker installed on your local machine.
-
Once Docker is installed, run the following command:
minikube delete -
Start the minikube service with the following command:
minikube start --cpus 4 --memory 8192 --vm-driver DockerNote: it may take a while to fully install. Please be patient
-
Make sure you have kubectl installed to add deployments
- If you use macOS, run:
brew install kubectl - If you use Windows, run:
choco install kubernetes-cli - If you use Linux, run:
sudo install -o root -g root -m 0755 kubectl /usr/local/bin/kubectl
- If you use macOS, run:
-
Install helm
- If you use macOS, run:
brew install helm - If you use Windows, run:
choco install kubernetes-helm - If you use Linux, run:
    $ chmod 700 get_helm.sh
    $ ./get_helm.sh ```
NOTE: Refer to this link for more details: https://kubernetes.io/docs/tasks/tools/
- If you use macOS, run:
-
Copy the code snippet below into your terminal and run it
helm repo add prometheus-community https://prometheus-community.github.io/helm-charts
 helm repo add stable https://kubernetes-charts.storage.googleapis.com/
 helm repo update
- Install Prometheus
helm install prometheus prometheus-community/kube-prometheus-stack
12. Configure a yaml file for grafana, replace the part of 'yourFile' with the name you want for your yaml file
kubectl get configmap prometheus-grafana -o yaml > yourFile.yaml
13. Once you generated this yaml file, open it and paste the code below into your yaml file inside of grafana.ini
   [security]
   allow_embedding: true
   [auth.anonymous]
   enabled: true
   [dataproxy]
   timeout: 600
<img src="https://github.com/oslabs-beta/indiK8or/assets/112515781/cf928d70-129e-4ca7-9faa-16091aa8c785" width="350" height="300"/>
-
Apply the yaml file, and replace 'filePath' with the path of your yaml file
kubectl apply -f 'filePath'Here is an example if your yaml file resides in your desktop foler:
kubectl apply -f /Users/Ivy/Desktop/newMap.yaml -
Install grype, you can find the instruction here
NOTE: START HERE IF YOU HAVE COMPLETED THE INITIAL SETUP
-
Restart minikube by running below commands separately
minikube stopminikube start -
Open your browser and go to http://localhost:3000 and sign in to your grafana with default user: admin default password: prom-operator
NOTE: You do not have to do step 15 if you have previously logged before.
-
In your terminal, run this command
npm run dev -
Now visit http://localhost:5000 and Voila! Your will see your kubernetes cluster come alive monitoring real-time data!
Usage Guidelines
Dashboard
This page of the application will provide a visual overview of your kubernetes cluster. The visualization will show the control plane, namespaces, pods, services, deployments and nodes.

This page will show you the health and status of the pods, it provides the details including image's name, ready, status, age, and IP. It additionally offers images & vulnerability scan.

Contributing
This product is open source, being actively maintained, and open to contributions. Please inform us of any features or bugs you'd like to see addressed.
How to contribute
Contributions are an incredibly important part of the open source community. Any contributions you make are greatly appreciated!
- Fork the project
- Create your feature branch (git checkout -b feature/AmazingFeature)
- Commit your changes (git commit -m 'Add some AmazingFeature')
- Push to the branch (git push origin feature/AmazingFeature)
- Open a pull request with clear descriptions of changes (from feature/AmazingFeature to dev)
Publications
You can check our amazing medium article here.
Contributors
| Tadd Lerocque | Ivy Wang | Yueran Li | Julian Babon |
License Information
Distributed under the MIT License. See LICENSE for more information.
![]() IF YOU FIND OUR PRODUCT HELPFUL, YOU CAN SHOW YOUR SUPPORT BY
IF YOU FIND OUR PRODUCT HELPFUL, YOU CAN SHOW YOUR SUPPORT BY ![]() THIS REPOSITORY!
THIS REPOSITORY! ![]()
</article
Recommend
About Joyk
Aggregate valuable and interesting links.
Joyk means Joy of geeK